


VOL. 17, ISSUE NO. 9 | December 2024
Oversight


ENGINEERING TRADE ANALYSIS FOR OCTOBER 2024
India’s engineering exports in October 2024 was at its highest in fiscal 2024-25 with a robust 38.5 percent year-on-year growth
| Trade Flow | Export figures (in US$ billion) | Growth (%) | ||||
|---|---|---|---|---|---|---|
| Oct-2023 | Oct-2024 | Apr - Oct 2023-24 | Apr - Oct 2024-25 | Oct-2024 over Oct-2023 | Apr-Oct 2024-25 over Apr-Oct 2023-24 | |
| Engineering exports | 8.08 | 11.19 | 61.50 | 66.59 | 38.53% | 8.27% |
| Overall merchandise exports | 33.43 | 39.20 | 244.51 | 252.28 | 17.23% | 3.18% |
| Share of engineering (%) | 24.16% | 28.72% | 25.15% | 26.75% | --- | -- |
| Service Exports | 28.05 | 34.02 | 191.97 | 215.98 | 21.28% | 12.51% |
Indian engineering exports continued its growth run for the sixth straight month to October 2024 and this time the growth was at an unprecedented high of 38.5 perecnt over Oct 2023 driven by exceptionally high growth in exports of Aircraft, spacecraft and parts; and Ships, boats and floating structures. For the first time in fiscal 2024-25, Indian engineering exprts crossed USD 10 billion mark and stood at its highest of this fiscal. Exports of Iron and steel turned positive for the first time in fiscal 2024-25 while Electric machinery, Industrial machinery and automobile also supported this high growth of overall engineering exports by showing noticeable increase in exports.Cumulativeexports during Apr-Oct 2024-25 also recorded 8.27 percent growth over the same period last fiscal. Share of engineering in overall merchandise exports was at an impressive 28.72 percent in October 2024 and at 26.75 percent on a cumulative basis.
HIGHLIGHTS
• Indian engineering exports continued its growth run for the sixth straight month to October 2024 and this time the growth was at an unprecedented high of 38.5 percent over Oct 2023. For the first time in fiscal 2024-25, Indian engineering exports crossed USD 10 billion mark and stood at its highest of this fiscal.
• In October 2024, engineering exports went up to USD 11,190.84 million from a much lower USD 8,078.48 million in the same month last fiscal.
• Cumulative engineering exports during April-October 2024-25 was recorded at USD 66,585.89 million as against USD 61,499.68 million during the same period of the last fiscal, registering an increase of 8.27 percent.
• According to the Quick Estimates of Department of Commerce, Government of India, share of engineering in India’s total merchandise exports in October 2024 rose to 28.72 percent from28.41 percent in September 2024, 27.20 percent in August 2024 and 26.60 percent in July 2024. Cumulative share stood at 26.75 percent during April-October 2024-25.
• In October 2024, 33 out of 34 engineering panels witnessed positive year-on-year growth. Only exports of Office equipment declined by merely 1%.
• On a cumulative basis, 27 out of 34 engineering panels recorded positive growth and remaining 7 engineering panels including Iron and Steel, some non-ferrous sectors including Copper, Aluminium and Zinc products, and Office Equipment recorded negative growth during April-October 2024-25.
• Region wise, North America and European Union remained India’s topmost destinations for engineering exports with share of around 21% and 17% respectively, in India’s total engineering exports. Highest growth was registered by ASEAN (137%), WANA (57%) and EU (41%) in October 2024
• In cumulative terms, all regions experienced growth barring Sub-Saharan Africa (-1%) and Oceania (-8%)
• Among the top export destinations, rise in cumulative terms was noticed in USA, UAE, Singapore, Saudi Arabia, Germany, etc.
Overall Engineering Exports vs Engineering Exports Excluding Steel Segment
(Values in USD Million)
| Trade Flow | Export in Oct 2023 | Exports in Oct 2024 | Growth (%) | Exports in Apr-Oct 2023-24 | Exports in Apr-Oct 2024-25 | Growth (%) |
|---|---|---|---|---|---|---|
| Overall engineering exports | 8078.48 | 11190.84 | 38.53 | 61499.68 | 66585.89 | 8.27 |
| Engineering exports excluding Iron and Steel | 7439.92 | 10364.23 | 39.31 | 54629.95 | 61152.46 | 11.94 |
Observation:
Excluding the export of iron and steel, engineering exports recorded a higher growth both on a monthly as well as cumulative basis as shown in the table above. Exports of Iron and Steel however secured 29.4 percent year-on-year growth in October 2024 but continued to decline on a cumulative basis and dropped by 20.91 percent year-on-year during April-October 2024-25.
ENGINEERING EXPORTS:
MONTHLY TREND
The monthly engineering figures for 2024-25 vis-à-vis 2023-24 are shown below as per the latest DGCI&S estimates:
TOP 25 ENGINEERING EXPORT DESTINATIONS IN OCTOBER 2024
We now look at the export scenario of the top 25 nations that had highest demand for Indian engineering products during October 2024 over October 2023 as well as in cumulative terms during April-October 2024-25 vis-à-vis April-October 2023-24. The data clearly shows that top 25 countries contribute 75.8% of total engineering exports.
Table 1: Engineering Exports: Monthly Trend in 2024-25
(Values in USD Million)
| Month | 2023-24 | 2024-25 | Growth (%) |
|---|---|---|---|
| April | 8949.36 | 8366.65 | -6.51 |
| May | 9300.62 | 9818.00 | 5.56 |
| June | 8515.72 | 9193.63 | 7.96 |
| April-June | 26765.71 | 27378.28 | 2.29 |
| July | 8720.30 | 8959.50 | 2.74 |
| August | 9048.65 | 9332.19 | 3.13 |
| September | 8886.54 | 9725.08 | 9.44 |
| July-September | 26655.49 | 28016.78 | 5.11 |
| October | 8078.48 | 11190.84 | 38.53 |
| April-October | 61499.68 | 66585.89 | 8.27 |
Table 2: Engineering exports country wise
(Values in USD Million)
| Countries | October 2023 | October 2024 | Growth (%) | April-October 2023-24 | April-October 2024-25 | Growth (%) |
|---|---|---|---|---|---|---|
| U S A | 1387.7 | 1612.4 | 16% | 10121.9 | 10706.6 | 6% |
| UAE | 348.3 | 825.2 | 137% | 3043.7 | 4504.4 | 49% |
| SINGAPORE | 184.0 | 1236.9 | 572% | 1889.9 | 3154.8 | 67% |
| SAUDI ARABIA | 397.7 | 379.9 | -4% | 2605.8 | 2990.4 | 15% |
| GERMANY | 342.1 | 392.8 | 15% | 2431.9 | 2451.9 | 1% |
| U K | 301.7 | 311.4 | 3% | 2117.5 | 2189.2 | 3% |
| MEXICO | 247.1 | 251.4 | 2% | 1830.6 | 2141.3 | 17% |
| TURKEY | 228.9 | 249.3 | 9% | 1682.2 | 1903.6 | 13% |
| ITALY | 192.8 | 333.9 | 73% | 2155.7 | 1817.5 | -16% |
| CHINA | 213.2 | 220.3 | 3% | 1441.8 | 1559.8 | 8% |
| KOREA RP | 169.8 | 268.5 | 58% | 1570.0 | 1554.7 | -1% |
| SOUTH AFRICA | 190.0 | 215.3 | 13% | 1342.0 | 1387.0 | 3% |
| JAPAN | 141.7 | 197.8 | 40% | 1030.1 | 1359.5 | 32% |
| BRAZIL | 172.5 | 219.7 | 27% | 1176.8 | 1317.2 | 12% |
| NEPAL | 162.8 | 200.3 | 23% | 1338.1 | 1294.3 | -3% |
| FRANCE | 169.6 | 238.7 | 41% | 1245.1 | 1289.8 | 4% |
| INDONESIA | 122.9 | 178.0 | 45% | 1700.5 | 1265.5 | -26% |
| BANGLADESH | 166.9 | 172.4 | 3% | 1303.1 | 1195.6 | -8% |
| THAILAND | 166.1 | 173.2 | 4% | 1080.2 | 1169.6 | 8% |
| NETHERLAND | 137.3 | 148.6 | 8% | 1175.6 | 1093.0 | -7% |
| MALAYSIA | 176.4 | 139.7 | -21% | 1087.8 | 851.4 | -22% |
| VIETNAM | 106.2 | 151.0 | 42% | 684.2 | 848.3 | 24% |
| BELGIUM | 102.0 | 123.6 | 21% | 918.1 | 837.4 | -9% |
| SPAIN | 95.2 | 111.0 | 17% | 882.8 | 803.6 | -9% |
| RUSSIA | 109.7 | 121.9 | 11% | 773.0 | 757.5 | -2% |
| Total engineering exports to top 25 countries | 6032.8 | 8473.2 | 40% | 46628.4 | 50479.8 | 8% |
| Total engineering exports | 8078.5 | 11190.8 | 39% | 61499.7 | 66585.9 | 8% |
REGION WISE INDIA’S ENGINEERING EXPORTS
The following table depicts region wise India’s engineering exports for April-October 2024 as compared to April-October 2023.
Table 3: Region wise engineering exports in April-October 2024-25 vis-à-vis April-October 2023-24(Values in USD Million)
| Countries | October 2023 | October 2024 | Growth (%) | April-October 2023-24 | April-October 2024-25 | Growth (%) |
|---|---|---|---|---|---|---|
| NORTHAMERICA | 1729.9 | 1976.6 | 14% | 12631.7 | 13557.8 | 7% |
| EUROPEAN UNION | 1373.1 | 1932.9 | 41% | 11454.4 | 11468.9 | 0% |
| WANA | 1100.2 | 1730.7 | 57% | 8439.2 | 10624.5 | 26% |
| ASEAN | 822.8 | 1950.3 | 137% | 6927.5 | 7868.1 | 14% |
| N E ASIA | 583.3 | 776.7 | 33% | 4571.1 | 5016.9 | 10% |
| SSA( Sub Saharan Africa) | 695.9 | 752.2 | 8% | 4733.4 | 4687.1 | -1% |
| OTHER EUROPE | 552.2 | 612.9 | 11% | 4011.7 | 4338.7 | 8% |
| SOUTH ASIA | 483.6 | 567.5 | 17% | 3483.5 | 3600.9 | 3% |
| LATIN AMERICA | 471.7 | 581.8 | 23% | 3398.7 | 3507.6 | 3% |
| CIS | 134.8 | 177.6 | 32% | 945.8 | 1080.2 | 14% |
| OCEANIA | 127.5 | 124.8 | -2% | 886.8 | 812.0 | -8% |
| OTHERS | 3.5 | 6.9 | 95% | 16.6 | 23.0 | 39% |
| Grand Total | 8078.5 | 11190.8 | 39% | 61499.7 | 66585.9 | 8% |
PANEL WISE INDIA’S ENGINEERING EXPORTS
In this section we look at the Engineering Panel wise exports for the month of October 2024 vis-à-vis October 2023 as well as the cumulative exports for April-October 2024-25 vis-à-vis April-October 2023-24. These are indicated in the tables below.
Table 4: Panel-wise Export Analysis for April-October 2024-25 vis-à-vis
April-October 2023-24
| Product panels | October 2023 | October 2024 | Growth (%) | April-October 2023-24 | April-October 2024-25 | Growth (%) |
|---|---|---|---|---|---|---|
| Ferrous | ||||||
| Iron and Steel | 638.6 | 826.6 | 29% | 6869.7 | 5433.4 | -21% |
| Products of Iron and Steel | 788.2 | 912.4 | 16% | 5673.3 | 5712.6 | 1% |
| Sub Total | 1426.8 | 1739.0 | 22% | 12543.0 | 11146.0 | -11% |
| Non-ferrous | ||||||
| Copper and products | 202.0 | 253.7 | 26% | 1389.1 | 1306.9 | -6% |
| Aluminium and products | 546.1 | 637.5 | 17% | 4164.3 | 3883.2 | -7% |
| Zinc and products | 59.9 | 78.6 | 31% | 450.1 | 426.0 | -5% |
| Nickel and products | 13.3 | 19.8 | 49% | 100.6 | 107.5 | 7% |
| Lead and products | 72.9 | 74.5 | 2% | 381.1 | 496.0 | 30% |
| Tin and products | 0.8 | 1.6 | 106% | 8.7 | 12.9 | 47% |
| Other Non-Ferrous Metals | 64.5 | 79.2 | 23% | 432.4 | 503.3 | 16% |
| Sub Total | 959.6 | 1144.9 | 19% | 6926.4 | 6735.8 | -3% |
| BRAZIL | 172.5 | 219.7 | 27% | 1176.8 | 1317.2 | 12% |
| NEPAL | 162.8 | 200.3 | 23% | 1338.1 | 1294.3 | -3% |
| Industrial Machinery | ||||||
| Industrial Machinery like Boilers, parts, etc. | 46.7 | 77.7 | 67% | 414.8 | 485.7 | 17% |
| IC Engines and Parts | 305.7 | 363.6 | 19% | 2157.7 | 2208.6 | 2% |
| Pumps of all types | 99.5 | 145.1 | 46% | 804.1 | 903.9 | 12% |
| Air condition and Refrigerators | 127.6 | 179.1 | 40% | 958.9 | 1094.0 | 14% |
| Industrial Machinery for dairy, food processing, textiles etc. | 664.1 | 730.8 | 10% | 4640.6 | 4796.3 | 3% |
| Machine Tools | 64.3 | 71.9 | 12% | 429.4 | 464.6 | 8% |
| Machinery for Injecting moulding, valves and ATMs | 201.1 | 244.3 | 21% | 1433.2 | 1605.9 | 12% |
| Sub Total | 1508.9 | 1812.5 | 20% | 10838.7 | 11559.0 | 7% |
| Electrical Machinery | ||||||
| Electrical Machinery | 1002.9 | 1262.1 | 26% | 7206.1 | 8229.3 | 14% |
| Automobile and auto component | ||||||
| Motor Vehicle/cars | 659.3 | 772.6 | 17% | 4930.2 | 5153.3 | 5% |
| Two and Three Wheelers | 223.4 | 286.6 | 28% | 1537.2 | 1831.2 | 19% |
| Auto Components/Part | 643.3 | 718.1 | 12% | 4411.9 | 4808.1 | 9% |
| Auto Tyres and Tubes | 239.1 | 257.1 | 8% | 1605.8 | 1768.6 | 10% |
| Sub Total | 1765.2 | 2034.3 | 15% | 12485.2 | 13561.3 | 8.6% |
| Aircrafts and related products | ||||||
| Aircrafts and Spacecraft parts and products | 131.4 | 666.5 | 407% | 808.1 | 3092.2 | 283% |
| Ships Boats and Floating products and parts | ||||||
| Ships Boats and Floating products and parts | 72.8 | 1092.1 | 1400% | 2238.5 | 3015.7 | 35% |
| Miscellaneous engineering products | ||||||
| Medical and Scientific instruments | 196.8 | 251.5 | 28% | 1387.2 | 1589.9 | 15% |
| Railway Transport | 37.7 | 44.2 | 17% | 186.5 | 197.9 | 6% |
| Hand Tools & Cutting Tools | 76.7 | 96.9 | 26% | 540.8 | 600.0 | 11% |
| Bicycle & Parts | 29.1 | 35.6 | 23% | 212.1 | 224.0 | 6% |
| Cranes Lifts & Winches | 95.4 | 96.6 | 1% | 572.8 | 658.8 | 15% |
| Office Equipment | 31.2 | 31.0 | -1% | 197.2 | 171.8 | -13% |
| Other Construction Machinery | 236.0 | 258.5 | 10% | 1680.2 | 1782.4 | 6% |
| Prime Mica & Mica Products | 2.4 | 2.6 | 8% | 23.1 | 17.5 | -24% |
| Project Goods | 0.1 | 0.4 | 501% | 2.0 | 1.5 | -24% |
| Miscellaneous engineering products (Contd.) | ||||||
| Other Rubber
Product Except Footwear |
141.6 | 158.4 | 12% | 962.7 | 1033.5 | 7% |
| Other Misc. Items | 364.0 | 463.8 | 27% | 2689.1 | 2969.4 | 10% |
| Total engineering exports | 8078.5 | 11190.8 | 38.5% | 61499.7 | 66585.9 | 8.27% |
Reasons for Decline (As per April-October 2024-25):
1. Iron and Steel and Products of Iron and Steel: - Insights:
• During April-October 2024-25, India’s exports of Iron and Steel deteriorated by 21% vis-à-vis same period last fiscal, while Products of Iron and Steel witnessed growth to the extent of 1% during the same period, after continuous decline for many months.
• Indian steel HRC exports remained sluggish this week as global market sentiments weakened further. Indian offers to the Middle East (ME) remained largely stable amid competitive quotes from China. Furthermore, a recent deal between China and the Middle East further pressured Indian exports. In contrast, European offers continue to be affected by weak regional demand.
• India’s HRC offer to Middle East: Indian HRC export prices to the Middle East (ME) continued to remain stable for the week at $560/t CFR, as per sources. Chinese HRC export prices to the Middle East fell by $10/t w-o-w to $520-525/t CFR UAE against $530-535/t CFR UAE last week amid active trade.
• India’s HRC offer to EU: India’s HRC export offers to Europe (S275, 3mm) continued to remain range-bounded at $590-595/t CFR Antwerp ($540-545/t FOB, east coast India). Indian steel mills’ export offers failed to gain traction in the European market due to high prices relative to domestic rates and EU trade restrictions. The unfavourable US dollar-euro exchange rate further increased import costs. In the EU, domestic HRC prices remained flat amid sluggish trading, with market participants uncertain about the market’s direction for Q1CY’25.
• Overall outlook: Chinese steelmakers continue to be highly competitive, offering lower prices and actively seeking export markets. This poses a significant challenge for Indian exporters. The global economic outlook remains sluggish, with geopolitical tensions contributing to concerns about overall steel demand and potential impacts on Indian exports.
2. Non- Ferrous Sector (Copper, Aluminium, Zinc)
Copper: decline of 6% in April-October 2024
• Copper exports have increased in October 2024 by 26%. If this trend continues, we will see a revival in copper exports for the fiscal 2024-25
• The 6% decline in cumulative terms can be attributed to the declining copper exports in the previous months
• The decline was a result of » global price volatility: In September global copper prices showed volatility – trended downwards in the beginning of September 2024 before gaining on growing anticipation of a rate cut by the US Federal Reserve which was came through on 18 September » Increase in domestic demand especially the EV sector: The Ministry of Mines projects that the demand for copper in India, particularly from the EV sector, will increase by 1.7 million tonnes by 2027. The per capita copper consumption in India is also expect
copper consumption in India is also expect-ed to rise from the current level of 0.6 kg to 1 kg in the coming years.» Closure of Vedanta’s Sterlite copper plant.3. Aluminium: decline of 7% in April-October 2024
• Aluminium exports have increased in October 2024 by 17%. If this trend continues, we will see a revival in Aluminium exports for the fiscal 2024-25
• The 7% decline in cumulative terms can be attributed to the declining Aluminium exports in the previous months
• The decline was a result of
• Restrictive trade policies and geopolitical tensions including Section 232 and U.S. Tariffs, U.S. Anti-Dumping Duties on Aluminium Extrusion Products » The Indian aluminium exports also face discrimination in market access in ASEAN countries and even our neighbouring markets: In the ASEAN region, countries like Malaysia have imposed high Most Favoured Nation (MFN) duties ranging from 25% to 30% on tariff lines between 7604 to 7608, 30% on tariff lines between 7604 to 7608, severely limiting exports from India’s downstream aluminium industry, which predominantly comprises MSMEs. Similarly, Indonesia has placed downstream aluminium products under the Sensitive Track, further restricting market access.» India’s aluminium exports also face discriminatory practices in neighbouring countries such as Bangladesh. In April 2023, Bangladesh reclassified aluminium billets under HS code 76012090 to 76012000, removing them from the South Asian Free Trade Area (SAFTA) agreement and imposing a 5% Basic Customs Duty (BCD) on imports from India. This change has increased the cost of exporting aluminium billets to Bangladesh, affecting trade volumes.» Fluctuation in global aluminium prices» Rising domestic demand
4. Zinc: decline of 5% in April-October 2024
• Zinc exports have increased in October 2024 by 31%. If this trend continues, we will see arevival in zinc exports for the fiscal 2024-25. The cumulative decline can be attributed mainly to the rising demand for Zinc in the domestic market.
ENGINEERING EXPORTS – STATE-WISE ANALYSIS
State wise engineering export performance
The table below indicates the exports from top Indian states. It is evident from the table that almost 93.7 % of India’s exports is contributed by the listed 12 states. Within this almost 56.1 percent of exports is done by Maharashtra, Tamil Nadu and Gujarat together.
Table 5:Top state wise engineering export performance – April-September 2024-25
(Values in USD Million)
| Top States | April-September 2023-24 | April-September 2024-25 | Growth% | % Share in India's Eng Export | Remark |
|---|---|---|---|---|---|
| Maharashtra | 11378.8 | 11155.0 | -2.0% | 22.9% |
93.7% share covered by top 12 states |
| Tamil Nadu | 8473.0 | 8702.7 | 2.7% | 17.9% | |
| Gujarat | 7075.6 | 7497.0 | 6.0% | 15.4% | |
| Karnataka | 3376.5 | 3439.7 | 1.9% | 7.1% | |
| Telangana | 828.4 | 3228.8 | 289.7% | 6.6% | |
| Odisha | 3447.2 | 2812.3 | -18.4% | 5.8% | |
| Andhra Pradesh | 2749.3 | 2542.5 | -7.5% | 5.2% | |
| Uttar Pradesh | 2094.1 | 2147.9 | 2.6% | 4.4% | |
| West Bengal | 1649.9 | 1682.3 | 2.0% | 3.5% |
93.7 % share covered by top 12 states |
| Madhya Pradesh | 911.1 | 942.2 | 3.4% | 1.9% | |
| Rajasthan | 1557.6 | 757.4 | -51.4% | 1.6% | |
| Haryana | 3321.1 | 749.1 | -77.4% | 1.5% |
Table 6: Region wise exports from India
(Values in USD Million)
| Region | April-Sep 2023-24 | April-Sep 2024-25 | Growth% |
|---|---|---|---|
| EASTERN REGION | 6117.7 | 5356.3 | -12.4% |
| NORTHERN REGION | 11187.1 | 4554.8 | -59.3% |
| SOUTHERN REGION | 15987.1 | 18435.8 | 15.3% |
| WESTERN REGION | 20242.2 | 20376.6 | 0.7% |
CORRELATION BETWEEN MANUFACTURING PRODUCTION AND EN- GINEERING EXPORTS
Engineering forms a considerable part of the broader manufacturing sector and the share of engineering production in overall manufacturing output is quite significant. As exports generally come from what is produced within a country, some correlation between manufacturing production growth and engineering export growth should exist. We briefly look at the trend in manufacturing growth as also engineering export growth to see if they move in tandem. It may be mentioned that manufacturing has 77.63% weightage in India’s industrial production.
Engineering export growth and manufacturing output growth moved in the same di- rection in as many as nine out of twelve months in each of the fiscal years 2019-20 and 2020-21. During fiscal 2021-22, however, this correlation weakened, with only six months showing aligned growth patterns.engineering export growth and manufacturing growth moved in the same direction in sev- en out of twelve monthswhile in each of fiscal 2022-23 and 2023-24, as many as10 out of 12 months saw engineering ex- ports and manufacturing out- put moved in the same direc- tion.
The first two month of fiscal 2024-25 also saw manufactur- ing output growth and engi- neering exports growth mov- ing in the same direction. April 2024 saw engineering exports declined from a growth in Mar 2024 and manufacturing output growth decelerated. The month of May 2024 witnessed just the opposite. Engineering ex- ports bounced back to growth path and manufacturing output growth accelerated. Then June, July and August2024 however saw both moved in the opposite direction. June and August 2024 saw higher engineering export growth but lower manufactur- ing growth in comparison to the previous month while July 2024 just witnessed the reverse. Sep- tember 2024 again saw both moving in the same direction by securing higher growth. The link between these two may not be established on a monthly basis, but a positive correlation may be seen if medium to long term trend is considered.
Table 7: Engineering exports growth vis-à-vis manufacturing growth from April 2022
| Months/ Year | Engg. Export Growth (%) | Manufacturing Growth (%) |
|---|---|---|
| April 2023 | -7.52 | 5.5 |
| May 2023 | -4.25 | 6.3 |
| June 2023 | -11.12 | 3.5 |
| July 2023 | -6.91 | 5.3 |
| August 2023 | 7.66 | 10.0 |
| September 2023 | 6.50 | 5.1 |
| October 2023 | 6.99 | 10.6 |
| November 2023 | -3.48 | 1.3 |
| December 2023 | 9.82 | 4.6 |
| January 2024 | 4.20 | 3.6 |
| February 2024 | 15.90 | 4.9 |
| March 2024 | 10.66 | 5.9 |
| April 2024 | -6.51 | 4.2 |
| May 2024 | 5.56 | 5.1 |
| June 2024 | 7.96 | 3.5 |
| July 2024 | 2.74 | 4.4 |
| August 2024 | 3.13 | 1.1 |
| September 2024 | 9.44 | 3.9 |
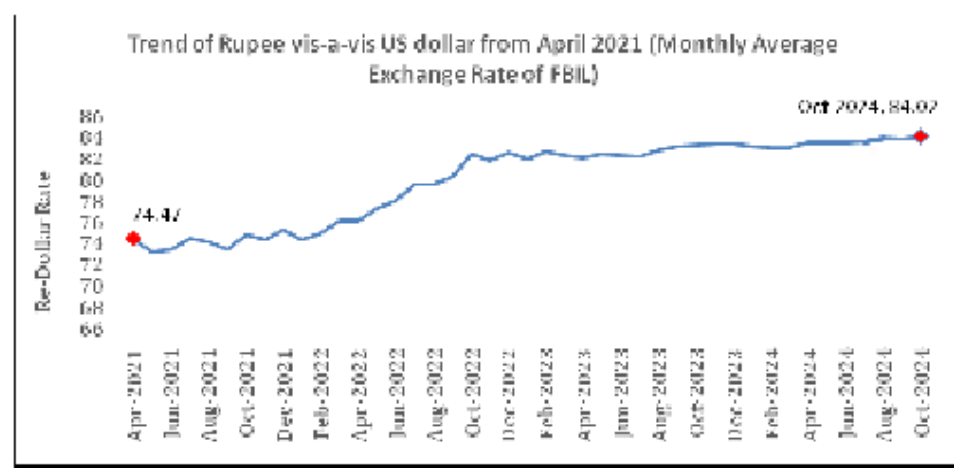
IMPACT OF EXCHANGE RATE ON INDIA’S EXPORTS
How did the exchange rate fare during October 2024 and what was the recent trend in Re-Dol- lar movement? In order to get a clearer picture of the recent Re-Dollar trend, not only we took the exchange rate of Oc- tober 2024, but also considered monthly average exchange rate of Rupee vis-à-vis the US Dollar for each month of fiscal 2023- 24 and 2024-25 till October 2024 as per the latest data pub- lished, as mere one-month fig- ure does not reflect any trend. The following two tables clearly depicts the short-term trend:
Table 8: USD-INR monthly average exchange rate in 2024-25 vis-à-vis2023-24
(As per latest data released by FBIL)
|
Monthly Average Exchange Rate (1 USD to INR) |
Year-on-Year Change (%) |
Direction |
Month-on-Month Change (%) |
Direction | ||
| Month | 2023-24 | 2024-25 | ||||
|---|---|---|---|---|---|---|
| April | 82.02 | 83.41 | 1.69 | Depreciation | 0.49 | Depreciation |
| May | 82.34 | 83.39 | 1.28 | Depreciation | -0.02 | Appreciation |
| June | 82.23 | 83.47 | 1.51 | Depreciation | 0.10 | Depreciation |
| July | 82.15 | 83.59 | 1.75 | Depreciation | 0.14 | Depreciation |
| August | 82.79 | 83.89 | 1.33 | Depreciation | 0.36 | Depreciation |
| September | 83.05 | 83.81 | 0.92 | Depreciation | -0.10 | Appreciation |
| October | 83.24 | 84.02 | 0.94 | Depreciation | 0.25 | Depreciation |
Rupee depreciation vis-à-vis the US Dollar continued in the new fiscal 2024-25 on a year- on-year basis and again depre- ciated on a month-on-month basis in October 2024. Ru- pee remained under pressure through most of the month due to appreciation of USD over the month, coupled with equity outflows by foreign portfolio in- vestors from Indian stock mar- ket andstrong dollar demand from local importers. Geopolit- ical tensions in the Middle East, and worries over recession in the US also weighed on rupee. US dollar strengthened due to rising uncertainties around just concluded US presidential elec- tion, along with a reduced likeli- hood of interest rate cuts by the Federal Reserve.
Table 9: USD-INR monthly average exchange rate in 2023-24vis-à-vis2022-23
(As per latest data released by FBIL)
|
Monthly Average Exchange Rate (1 USD to INR) |
Year-on-Year Change (%) |
Direction |
Month-on-Month Change (%) |
Direction | ||
| Month | 2023-24 | 2024-25 | ||||
|---|---|---|---|---|---|---|
| April | 76.17 | 82.02 | 7.68 | Depreciation | -0.33 | Appreciation |
| May | 77.32 | 82.34 | 6.49 | Depreciation | 0.39 | Depreciation |
| June | 78.04 | 82.23 | 5.37 | Depreciation | -0.13 | Appreciation |
| July | 79.60 | 82.15 | 3.20 | Depreciation | -0.10 | Appreciation |
| August | 79.56 | 82.79 | 4.06 | Depreciation | 0.78 | Depreciation |
| September | 80.23 | 83.04 | 3.50 | Depreciation | 0.30 | Depreciation |
| October | 82.34 | 83.24 | 1.09 | Depreciation | 0.24 | Depreciation |
| November | 81.81 | 83.30 | 1.82 | Depreciation | 0.07 | Depreciation |
| December | 82.46 | 83.28 | 0.99 | Depreciation | -0.02 | Appreciation |
| January | 81.90 | 83.12 | 1.49 | Depreciation | -0.19 | Appreciation |
| February | 82.61 | 82.96 | 0.42 | Depreciation | -0.19 | Appreciation |
| March | 82.29 | 83.00 | 0.86 | Depreciation | 0.05 | Depreciation |
Fig 2: Trend of Rupee vis-a-vis US dollar from April 2020
(Monthly Average Rate of FBIL has been considered)
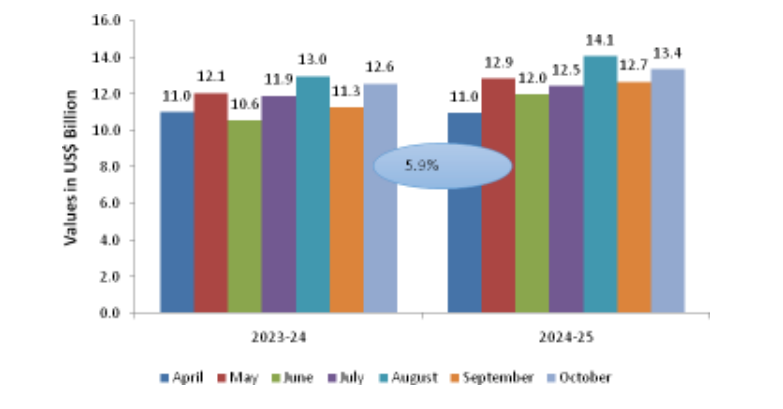
ANALYSIS OF INDIA’S ENGINEERING IMPORTS
India’s Engineering imports during October 2024 were valued at US$ 13374.5 million compared to US$ 12624.1 million in October 2023 registering a positive growth of 5.9 percent in dollar terms. All the engineering panels barring Transport equipment witnessed an increase in import during October 2024 compared to October 2023. The share of engineering imports in India’s total merchandise imports in October 2024 was estimated at 13.4 percent, higher than that of October 2023 which was estimated at 12.6 %. The figure below depicts engineering imports for October 2024 compared to October 2023.
Table 10: India’s engineering imports in April-October 2024-25 vis-à-vis
April-October 2023-24
| Values in US$ MN | October '23 | October | Growth (%) | April-October 2023 | April-October 2024 | Growth (%) |
|---|---|---|---|---|---|---|
| India's Engineering Imports | 12624.1 | 13374.5 | 5.9% | 82589.1 | 88550.8 | 7.2% |
Fig 3: Monthly Engineering Imports for April-October 2024-25 vis-a-vis
April-October2023-24
TREND IN ENGINEERING TRADE BALANCE
We now present the trend in two-way yearly trade for the engineering sector for the 2024-25 depicted in the table below:
Table 11: Monthly Trend in Engineering Trade Balance for the current FY 2024-25
(US$ Billions)
| Trade Flow | April | May | June | July | August | September | October |
|---|---|---|---|---|---|---|---|
| Engineering Export | 8.7 | 10.0 | 9.4 | 9.0 | 9.4 | 9.8 | 11.2 |
| Engineering Import | 11.0 | 12.9 | 12.0 | 12.5 | 14.1 | 12.7 | 13.4 |
| Trade Balance | -2.3 | -2.9 | -2.6 | -3.5 | -4.7 | -2.9 | -2.2 |
CONCLUSION
The Indian engineering exports recorded another remarkable performance for the 6th month in the current fiscal with a Y-o-Y growth of 38.5% in October 2024 and 8.2% in April-October 2024. It needs to be mentioned here that after a considerable number of months, October 2024 also recorded positive growth in exports of ferrous and non-ferrous metals including iron and steel, copper, aluminium and zinc which otherwise recorded negative growth in the previous months. This performance despite the growing global uncertainties and shifting trade policies is commendable.In its latest Global Trade Out- look and Statistics (October 2024), WTO revised its forecast for global merchandise trade for 2024 to 2.7% which is slight- ly better than the previous 2.6%. The update for 2025 however is revised down to 3% from the previous 3.3%. The growth is trade will be mainly contributed by the rising demand in ASEAN countries rather than the West. The WTO further mentions the current trade trend has indi- cated rising trade volume and flate trade values – an incation towards decline in export and import prices. The WTO expects that lower inflation will boost consumer spending, while low- er interest rates should raise investment spending by firms. The risks to merchandise trade mainly remains similar to previ- ous months including geopolit- ical tensions, regional conflicts and policy uncertainty.The results and the recent WTO updates indicates the existing volatility of the global markets and the engineering industry’s performance will depend on the intitiaves of both the industry and the government.
ENGINEERING PRODUCT PANELS – COUNTRY-WISE ANALYSIS
We now analyze the performance of some of the important products for the fiscal April-October 2024-25 vis-à-vis April-October 2023-24. We have taken the major panels and computed the top im- porters to get an idea of the current trade pattern.
Engineering Product Panel - Country matrix(US$ Billions)
| Product panels | Top 5 nations | Apr-Oct 2023-24 | Apr-Oct 2024-25 | Growth |
|---|---|---|---|---|
| Iron and Steel | Italy | 981.6 | 688.8 | -30% |
| Nepal | 545.9 | 429.3 | -21% | |
| UAE | 380.2 | 384.3 | 1% | |
| Belgium | 347.7 | 321.5 | -8% | |
| UK | 217.8 | 309.9 | 42% | |
| Products of Iron and Steel | USA | 1603.0 | 1710.3 | 7% |
| UAE | 329.4 | 436.3 | 32% | |
| Saudi Arab | 290.6 | 375.4 | 29% | |
| Germany | 264.8 | 269.3 | 2% | |
| UK | 213.6 | 211.7 | -1% | |
| Industrial Machinery | USA | 2125.6 | 2407.7 | 13% |
| UAE | 458.9 | 552.0 | 20% | |
| Germany | 598.5 | 537.1 | -10% | |
| China | 415.5 | 552.0 | 20% | |
| Thailand | 477.2 | 457.4 | -4% | |
| Automobiles (Motor Vehicles/Cars and Two and Three Wheelers) | Saudi Arab | 935.4 | 928.6 | -1% |
| Mexico | 674.2 | 829.9 | 23% | |
| South Africa | 770.7 | 802.8 | 4% | |
| Japan | 110.5 | 446.6 | 304% | |
| UAE | 305.5 | 414.8 | 36% | |
| Non-Ferrous metals | USA | 849.2 | 831.0 | -2% |
| Korea RP | 731.8 | 560.2 | -23% | |
| Turkey | 127.3 | 447.7 | 252% | |
| Saudi Arab | 639.4 | 421.1 | -34% | |
| China | 287.1 | 373.8 | 30% | |
| Electrical Machinery and Components | USA | 1417.2 | 1602.2 | 13% |
| Singapore | 599.0 | 922.2 | 54% | |
| UK | 592.3 | 614.3 | 4% | |
| Germany | 434.7 | 535.9 | 23% | |
| Korea RP | 217.4 | 441.8 | 103% | |
| Aircrafts and Space crafts | UAE | 12.4 | 938.9 | 7461% |
| Saudi Arab | 1.5 | 351.2 | 22905% | |
| France | 108.3 | 303.4 | 180% | |
| Turkey | 60.7 | 236.5 | 290% | |
| Czech Republic | 3.0 | 206.6 | 6868% | |
| Ships, Boats and Floating Structures and parts | Singapore | 606.4 | 1567.8 | 159% |
| UAE | 485.9 | 611.1 | 26% | |
| Indonesia | 556.2 | 262.3 | -53% | |
| USA | 52.6 | 250.8 | 376% | |
| Sri Lanka | 234.7 | 126.4 | -46% | |
| Auto Components (including Auto Parts and Auto Tyre) | USA | 1357.7 | 1367.2 | 1% |
| Brazil | 289.0 | 368.3 | 27% | |
| Germany | 326.1 | 359.3 | 10% | |
| Turkey | 319.3 | 302.6 | -5% | |
| Mexico | 263.2 | 288.8 | 10% |
•In April-October 2024, Italy, Nepal and UAE ranked as the top importers of Indian Iron and Steel, while the USA, UAE and Saudi Arabia lead in import of ‘Products of Iron & Steel.’ •The USA stood out as the primary importer of Indian ‘Industrial machinery,’ mak- ing up 21% of India’s global exports in this category, fol- lowed by UAE and Germany with 5% and 5% shares, re- spectively. •Saudi Arabia, Mexico and South Africa were top three importers of India’s Automo- biles during April-October 2024 in India’s global exports respectively over April- Oc- tober 2023. •USA, South Korea and Turkey were the top three import- ers of India’s Non-ferrous metals and products’ during April-October 2024 whereas USA, Singapore and UK were the three top importers of Indian Electrical Machinery & Components during the same period. •UAE, Saudi Arabia and France were the top three importers of India’s Air- crafts and Spacecraft during April-October 2024 in India’s total global exports of the product followed by Turkey and Czech Republic. •Singapore, UAE and Indo- nesia became the largest importer of ships, boats and floating structures fol- lowed by USA and Sri Lanka. While for the auto compo- nents’ product group, USA remained the top importer in April- October 2024 fol- lowed by Brazil, Germany, Turkey and Mexico.

EEPC India offices
Office bearers of EEPC India
Pankaj Chadha
Tel: 91-22-26455474 - 75
e-mail: export@jyotisteel.com/pankaj@ jyotisteel.com
VICE CHAIRMANAakash Shah
Tel: 91-33-22747466/24744226
e-mail: aakash@niphaindia.com
REGIONAL CHAIRPERSONS
Eastern RegionB D Agarwal
Tel: 91-33-22487249
e-mail: bdacec@gmail.com, admin@calcuttaexport.com
Northern RegionPradeep Kumar Aggarwal
Tel 0120 408 9000
e-mail: pradeepkaggarwal@outlook.com
Mobile: 09810008154
Raman Raghu
Tel: 91-44 6670 3111
Mob: 98410 94194
Email: ramanraghu43@yahoo.in,
edc@rbronze.com
Western RegionAnoop Marwaha
Tel: 91-22 2493 5152/8003 (O)
Mob: 98200 97292
E-mail: anoop@marslon.com
Offices in India
Adhip Mitra
Executive Director and Secretary
EEPC India
Vandhna (4th Floor)
11 Tolstoy Marg, New Delhi 110 001
Tel: 91-11-23353353, 23711124/25
e-mail: eepcto@eepcindia.net
REGISTERED & HEAD OFFICEDr Rajat Srivastava
Additional Executive Director
EEPC India
Vanijya Bhavan (1st Floor)
International Trade Facilitation Centre
1/1 Wood Street
Kolkata 700 016
Tel: 91-33-22890651/52/53
e-mail: eepcho@eepcindia.net
REGIONAL OFFICES
ChennaiB D Agarwal
Tel: 91-33-22487249
e-mail: bdacec@gmail.com, admin@calcuttaexport.com
KolkataEEPC India
Vanijya Bhavan (2nd Floor)
International Trade Facilitation Centre
1/1 Wood Street, Kolkata 700 016
Tel: 91-33-22890673/74
e-mail: eepcrokol@eepcindia.net
Mumbai
EEPC India
B-202 & 220, Aurus Chambers
Annex "B", 2nd Floor (behind Mahindra Tower)
S.S. Amrutwar Marg, Worli, Mumbai 400 013
Tel: 91-22-42125555
e-mail: eepcromum@eepcindia.net
EEPC India
Flat No. 10 P, Q, N, 10th Floor, DCM Building
16 Barakhamba Road, New Delhi 110 001
Tel: 91-11-23314171/74
e-mail: eepcrodel@eepcindia.net
Sub-regional offices
EEPC India
Embassy Square, Flat 103
148 Infantry Road
Bengaluru 560 001
Tel: 91-80-22261396 / 8669
e-mail: eepcsroblr@eepcindia.net
HyderabadEEPC India
'Soham Mansion' (1st Floor)
No. 5-4-187/3 & 4/4, M. G. Road
Secunderabad 500 003
Tel: 91-40-27536704
e-mail: eepcsrohyd@eepcindia.net
EEPC India
Plot Comm. 1, Focal Point
Jalandhar 144 012
Tel: 91-181-2602264
e-mail: eepcsrojld@eepcindia.net
AhmedabadEEPC India
TF-313/A (3rd Floor)
ATMA House, Ashram Road
Ahmedabad 380 009
Tel: 91-9725663534/79-26588720
e-mail: eepcsroahd@eepcindia.net
IndianEngineeringExports advertising rates:
| Advertisement Tariff | |
|---|---|
| Colour | |
| Back Cover | Rs20,000 (US$294) |
| Inside Back Cover | Rs16,000 (US$235) |
| Inside Front Cover | Rs18,000 (US$264) |
| Centre-spread | Rs30,000 (US$441) |
| Full Page | Rs13,000 (US$191) |
| Half Page | Rs8,000 |
| Strip | Rs6,000 |
| Print Area | |
|---|---|
| Back Cover | 26.6 cm x 20.7 cm |
| Inside Back Cover | 26.6 cm x 20.7 cm |
| Inside Front Cover | 26.6 cm x 20.7 cm |
| Centre-fold | 26.9 cm x 41.4 cm |
| Full Page | 26.6 cm x 20.7 cm |
| Half Page | 12.9 cm x 18.4 cm |
The US dollar tariffs will be based on the prevailing exchange rate
The rates are for a single insertion. Discounts may be given for more than one insertion.
The discounts are:
| For 3 months | 3% |
| For 6 months | 6% |
| For 12 months | 10% |
Members of EEPC India will get a further discount of 10% of the total cost.
EEPC INDIA CALENDAR OF EVENTS
All events subject to change
| Name of the Event | Date | Place | Product sectors |
|---|---|---|---|
| International Engineering Sourcing Show (IESS - XII) | 27 - 29 November, 2024 | Chennai | Engineering, Multiple-products |
| Automechanika Dubai | 10 - 12 December, 2024 | Dubai, UAE | Auto component and accessories |
| Arab Health | 27 - 30 January, 2025 | Dubai, UAE | Medical Device & Supplies |
| Bharat Mobility Global Expo 2025 | 17 - 22 January 2025 | New Delhi |
Automobiles, components, Electric vehicles, Tyres, Urban mobility, Technology & Innovative solutions |
| Nepal Medical Expo | 27 Feb - 01 Mar,
2025 (Tentative) |
Kathmandu, Nepal | Medical Devices, Lab instruments, Healthcare |