


VOL. 18, ISSUE NO. 9 | December 2025
Oversight


HIGHLIGHTS
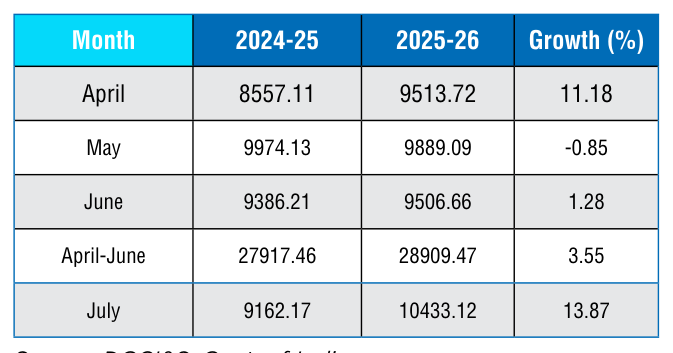
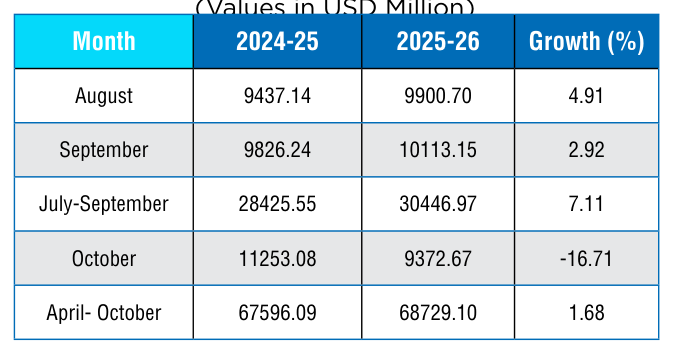
- Engineering exports from India conceded year-on-year decline in October 2025 after four consecutive months of growth. This was the second monthly decline in fiscal 2025-26 after May 2025 and this time the drop was quite high at 16.71 percent.
- Engineering exports in October 2025 was recorded at USD 9.37 billion as against USD 11.25 billion in October 2024. High statistical base was one of the reasons for drop in engineering exports during October 2025. The drop was also recorded on a monthon-month basis.
- However, engineering exports still recorded year-on-year growth on a cumulative basis. During April – October 2025, engineering exports stood at USD 68.73 billion as against USD 67.60 billion during the same period last fiscal, registering 1.68 percent growth year-on-year.
- As per the quick estimates of the government, the share of engineering in total merchandise exports was recorded at 27.27 percent in October 2025, which was a bit lower than that of the previous month at 27.80 percent. The share was recorded at 27.03 percent on a cumulative basis during April – October 2025-26.
- In October 2025, 23 out of 34 engineering panels witnessed negative year-on-year growth. While 11 engineering panels including copper and its products, zinc, tin, iron and steel, motor vehicles, two and three wheelers, etc., witnessed increase in exports during October 2025 vis-à-vis October 2024.
- On a cumulative basis, 27 out of 34 engineering panels recorded growth and remaining 7 engineering panels including Non-ferrous sectors including Aluminium products and Nickel products, Aircraft and Spacecrafts and Ships, boats and floating products and Cranes, Lifts and Winches etc. recorded negative growth during April-October 2025-26.
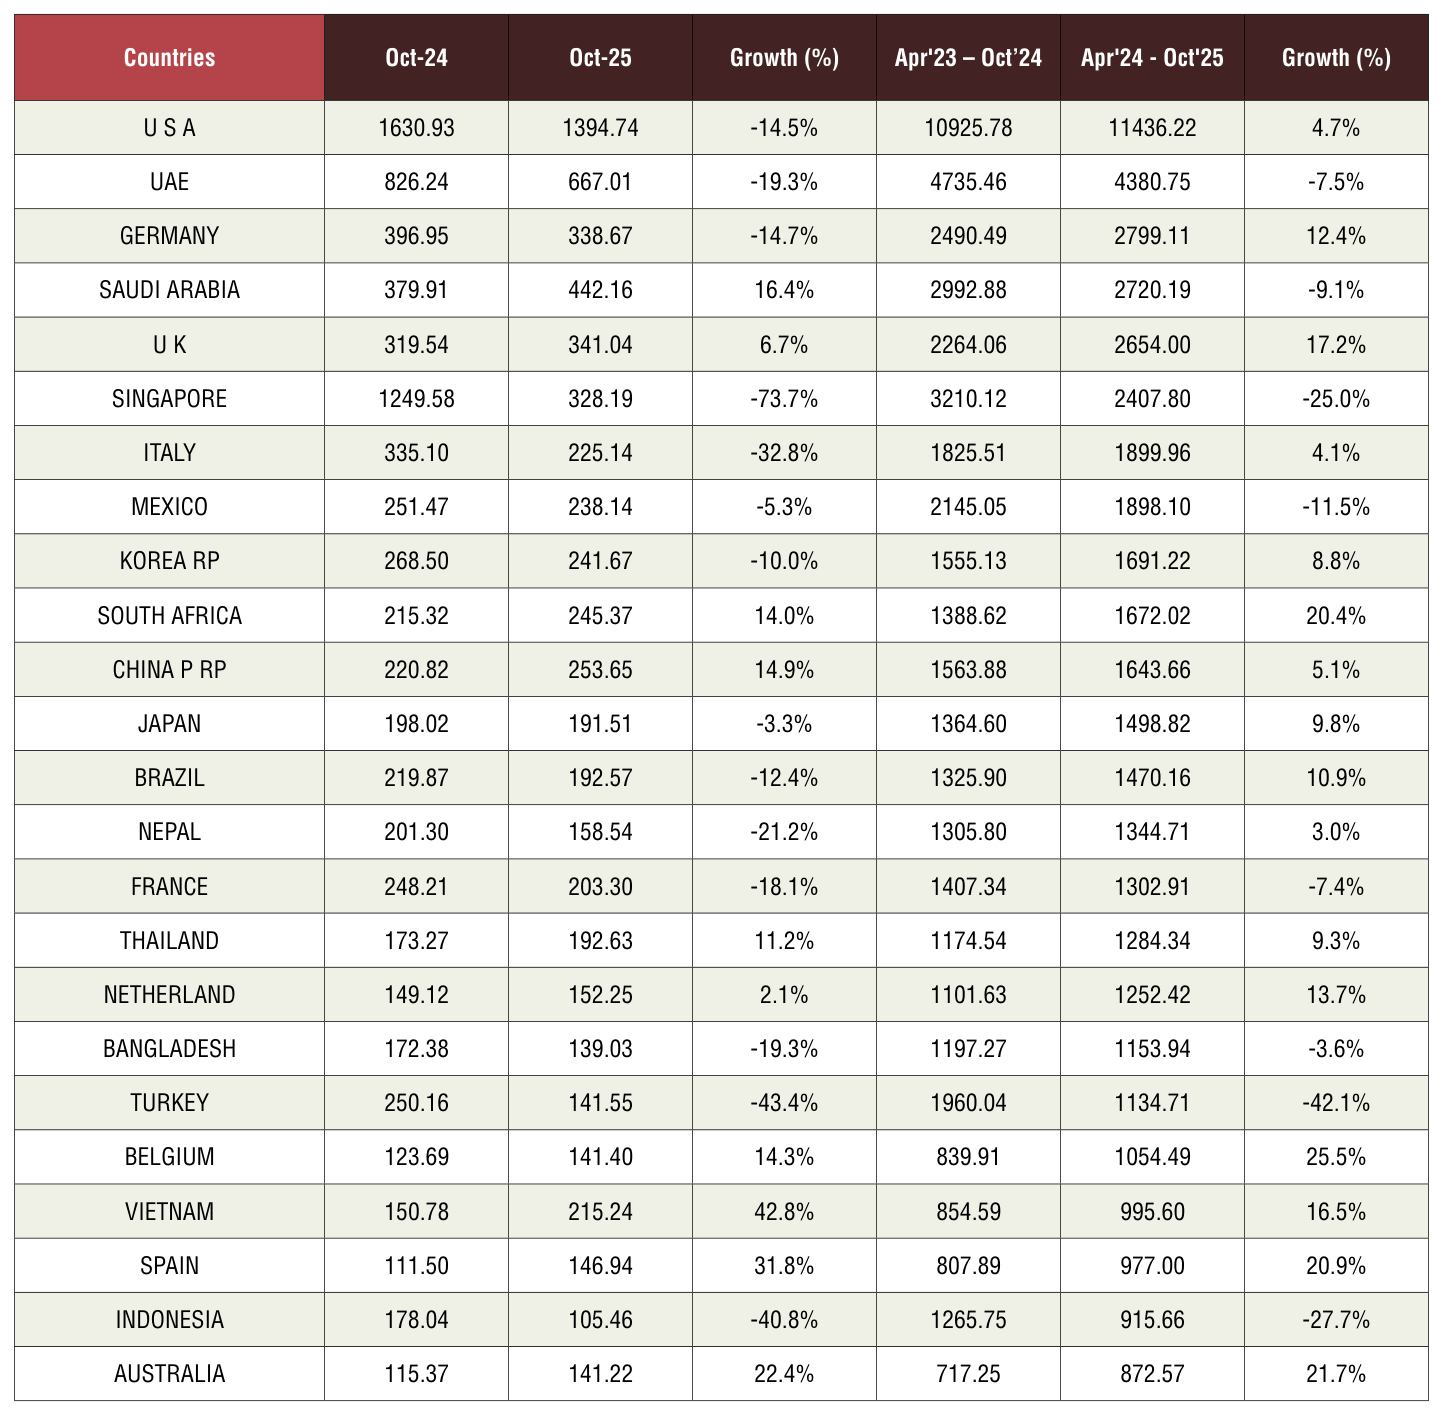
- Region wise, North America and EU remained the top two exporting regions for Indian engineering but exports to both the regions declined for the second time in October 2025 on a year-on-year basis. Significant decline was also noted in WANA, ASEAN, South Asia, Latin America and CIS.
- Country-wise, USA remained the top destination followed by UAE and Germany but exports to these countries declined yearon-year in October 2025. For the other top destinations viz. Saudi Arabia and UK, exports recorded decent growth in October 2025 over the same month last fiscal.On a cumulative basis, exports to USA grew over the years but shipments to UAE and Saudi Arabia declined.
ENGINEERING EXPORTS: MONTHLY TREND
The monthly engineering export figures for 2025-26 vis-à-vis 2024-25 are shown below as per the latest DGCI&S estimates:
Table 1: Engineering Exports: Monthly Trend in 2025-26
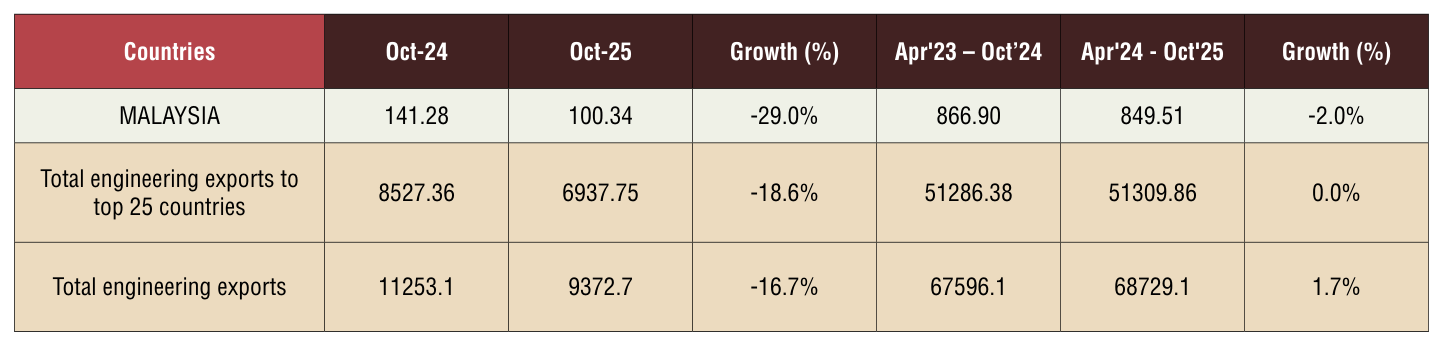
TOP 25 ENGINEERING EXPORT DESTINATIONS IN OCTOBER 2025
We now look at the export scenario of the top 25 nations that had highest demand for Indian engineering products during October 2025 over October 2024 as well as in cumulative terms during April-October 2025-26 vis-à-vis April-October 2024-25. The data clearly shows that top 25 countries contribute almost 75 % of total engineering exports.
Table 2: Engineering exports country-wise
REGION WISE INDIA’S ENGINEERING EXPORTS
The following table depicts region wise India’s engineering exports for April-October 2025 as compared to April-October 2024
Table 3: Region wise engineering exports in April-October 2025-26 vis-à-vis April-October 2024-25

Note: Myanmar has been included in ASEAN and not in South Asia, since ASEAN is a formal economic grouping.
Figure 1: Region-wise shares of India’s engineering exports during April-October 2025-26
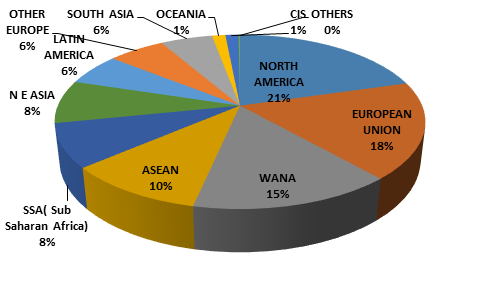
Source: DGCI & S
- North America: The decline is mainly due to decline in exports to USA (-14.5%). The decline in exports to USA is fuelled by the combined impact of Section 232 tariffs and the reciprocal tariff. Panel-wise decline was noted in products of iron and steel (-26.5%), auto components (-18.9%), iron and steel (-1.9%).These panels have come under Section 232. Barring that decline was also noted in industrial machinery which are mostly under Reciprocal tariff. Apart from USA decline was also noted in Mexico by more than 5% mainly due to decline in exports of two and three wheelers, auto components and parts and electrical machinery. The decline may be fuelled by trade diversion from other countries which are also facing high tariff in USA
- EU: The decline is mainly due to decline in exports of iron and steel, electrical machinery and aircraft, spacecraft and parts.Country-wise decline was noted in France and Germany. The decline in exports of aircrafts, spacecrafts and parts can be attributed to volatility in MRO activities. Decline in other products may be due to decline in demand and also trade diversion from other countries which are also facing high tariff in USA
- WANA: The decline in exports to WANA is mainly due to significant drop in exports to UAE (-19.3%). The sectors which faced decline include motor vehicles (-12%), iron and steel (-27%), auto components (-7%) and most importantly aircraft, spacecraft and parts (-99%). The decline in the last product can be attributed to volatility in MRO activities. The industry also feels that since the imposition of the US tariffs and increased compliance regrading origin of goods, it has become difficult for Indian exporters to use UAE as a base for export to US with tax benefits. This has also impacted our exports to UAE.Furthermore, iron and steel and auto components are both under Section 232 tariffs. Our analysis has indicated that significant trade diversion has happened in UAE since the imposition of US taxes.
- ASEAN: Decline in exports has stemmed from increase within intra-ASEAN trade as ASEAN’s exports to US has also declined due to the Section 232 tariffs
- Other Europe: Mainly declined due to decline in exports to Turkey – geopolitical conflicts and diplomatic issues have impacted India’s prospects.
- South Asia: Decline in demand and diversification from China at a much more competitive price
PANEL WISE INDIA’S ENGINEERING EXPORTS
In this section we look at the Engineering Panel wise exports for the month of September 2025 vis-à-vis September 2024 as well as the cumulative exports for April-October 2025-26 vis-à-vis April-October 2024-25. These are indicated in the tables below.
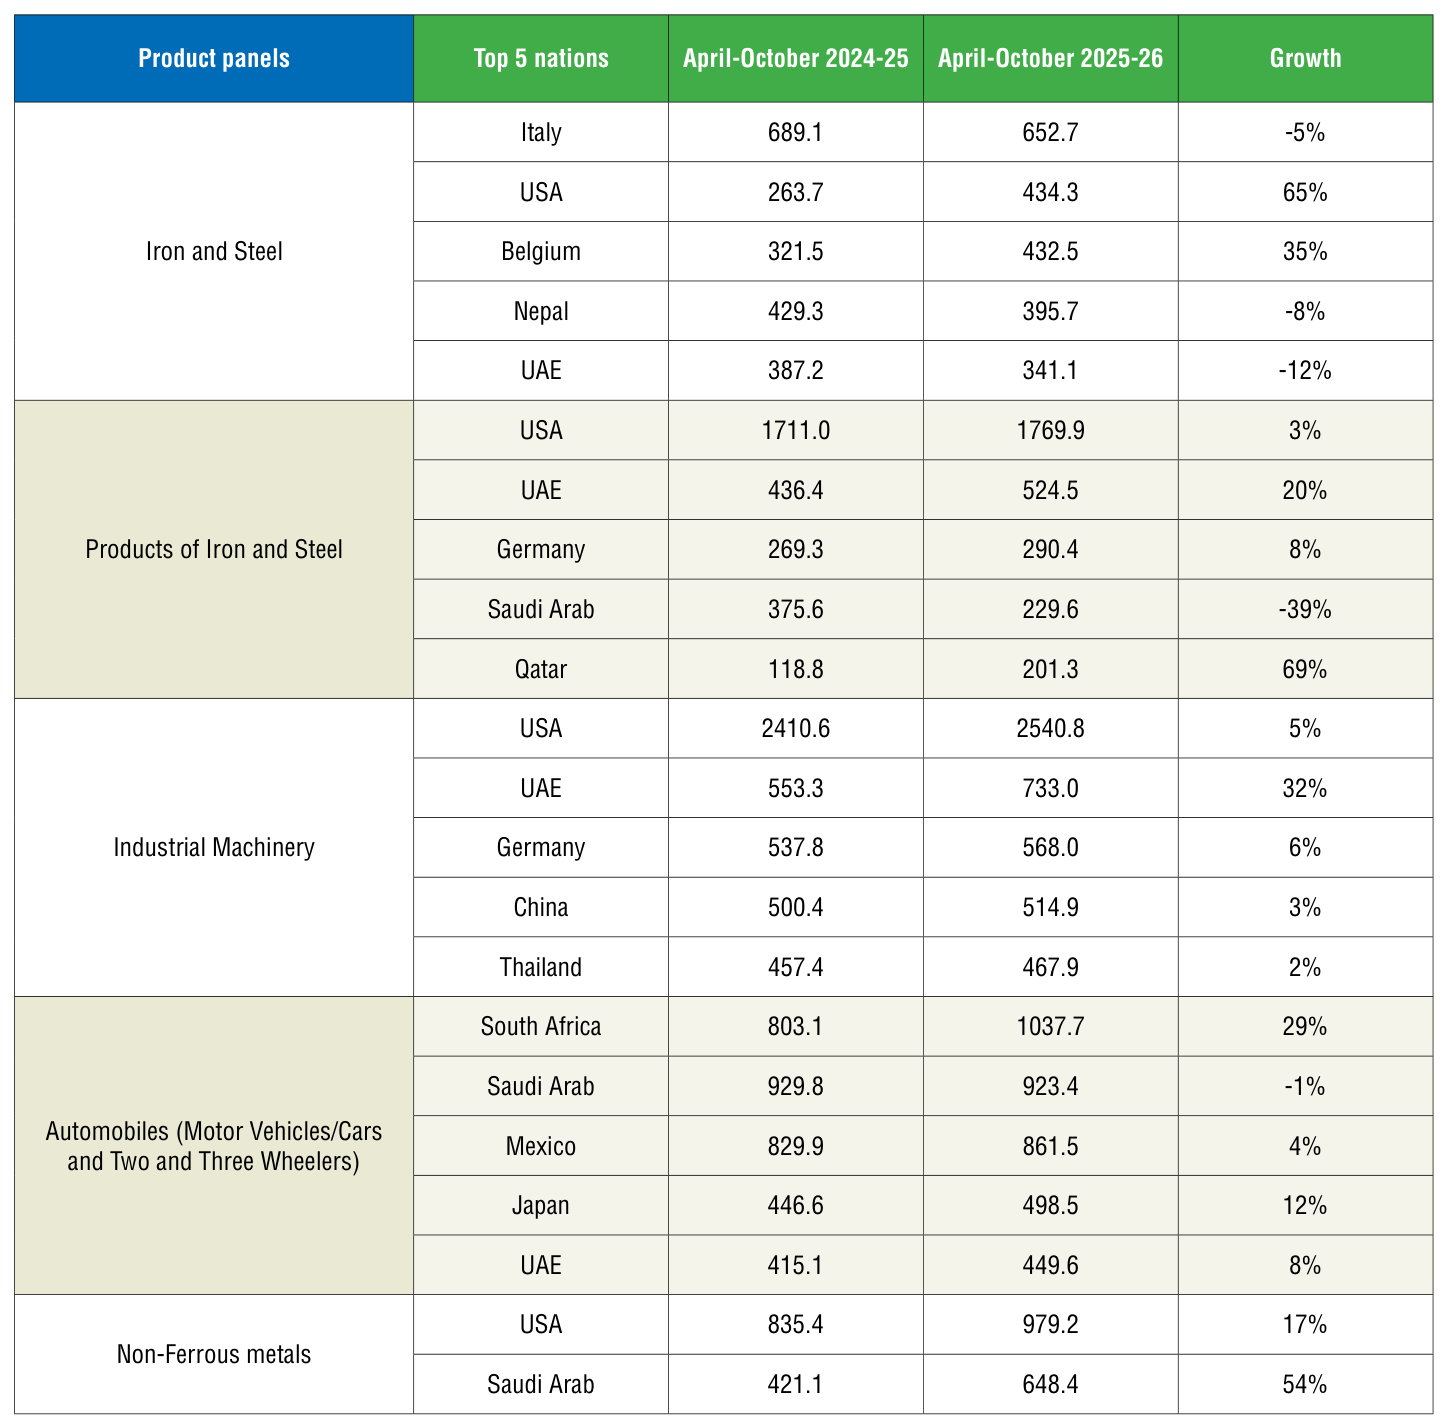
Table 4: Panel-wise Export Analysis for April-October 2025-26 vis-à-vis April-October 2024-25 (Value in US$ million)
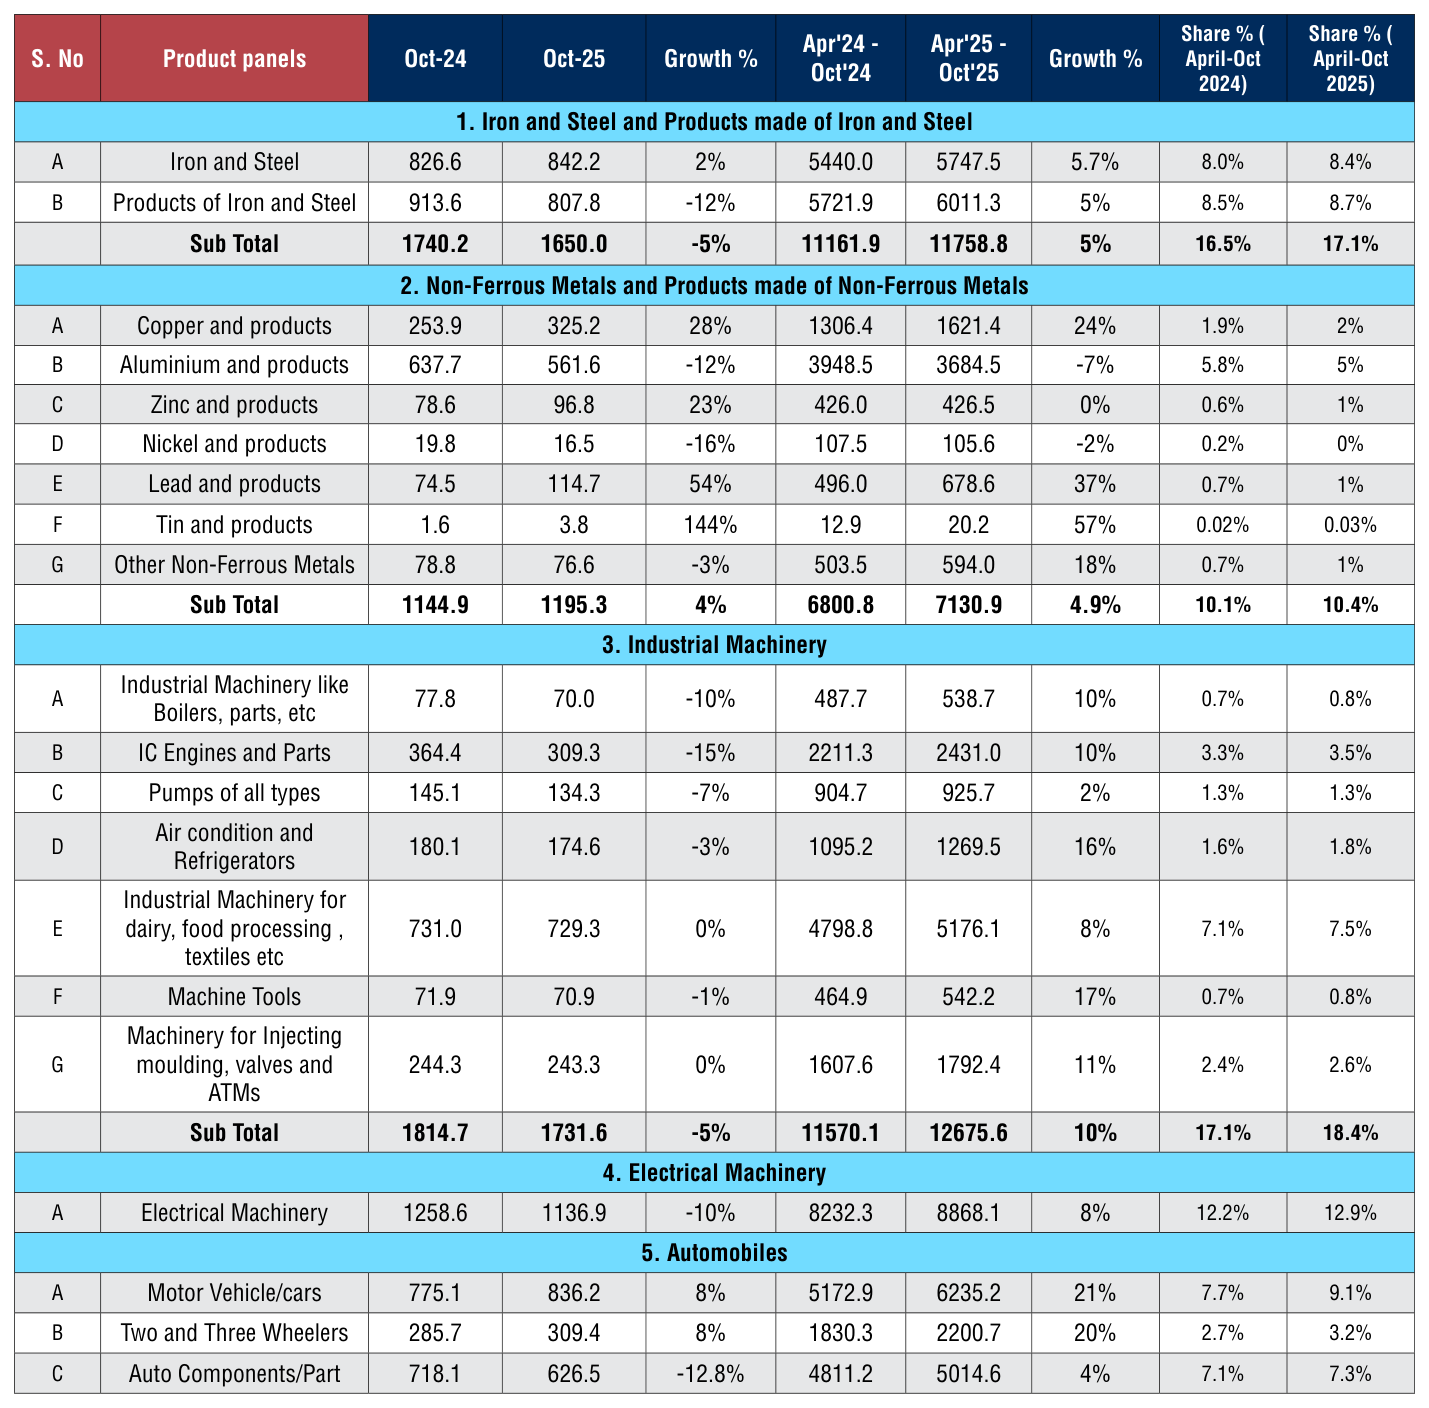
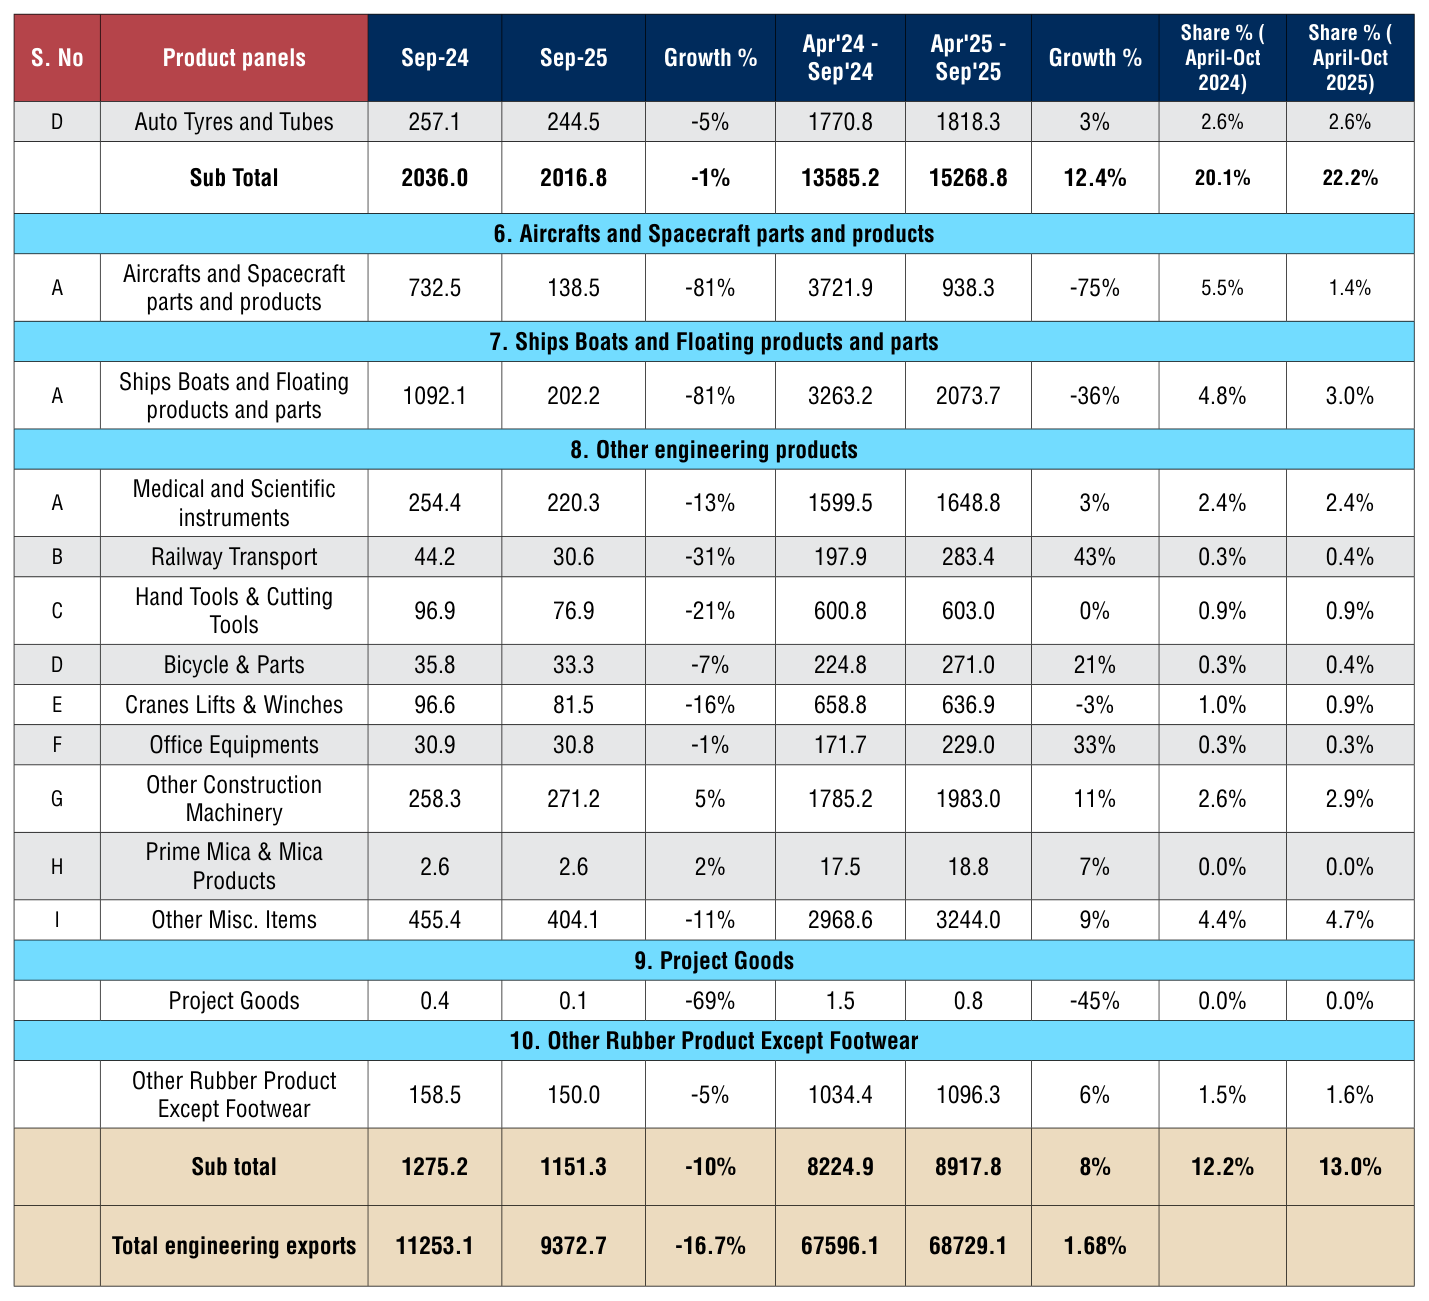
Sectoral Observations:
India’s engineering exports grew marginally by about 1.7% in April– October 2025 to around US$68.7 billion, with mixed performance across panels:
- Iron and steel (including products) grew about 5%, and their share in total exports inched up from 16.5% to 17.1%, indicating stronger demand for metal-based engineering goods.
- Non ferrous metals rose roughly 5%, led by sharp increases in copper, lead, and tin products, even as aluminium exports declined, keeping the segment’s share stable around 10%.
- Aluminium exports declined in South Korea, ASEAN and EU countries due to factors including lower demand, greate diversion due to the US tariff and expansion of capacity in ASEAN. High cost of compliance with CBAM documentation is also affecting exports to the EU
- Industrial machinery and electrical machinery together showed healthy growth of about 8–10%, and their combined share increased, confirming machinery
as a key growth driver despite some October-on-October dips.
- Automobiles (cars, two/three wheelers, components, tyres) recorded the fastest expansion at about 12%, with their share jumping from 20.1% to 22.2%, driven mainly by strong car and two/ three-wheeler exports.
- Aircraft, spacecraft, and Ship and Boats exports contracted sharply (around 36% and 75% respectively), pulling down their contribution to total engineering exports.
- Other engineering products (like construction machinery, medical instruments, railway items, bicycles, and misc. items) grew about 8%, nudging their share up from 12.2% to 13.0%.
TARIFF AND SAFEGUARD OBSERVATIONS:
Table 5: USA Tariff Impact ( Section 232 and Reciprocal Tariff) Value in US$ million
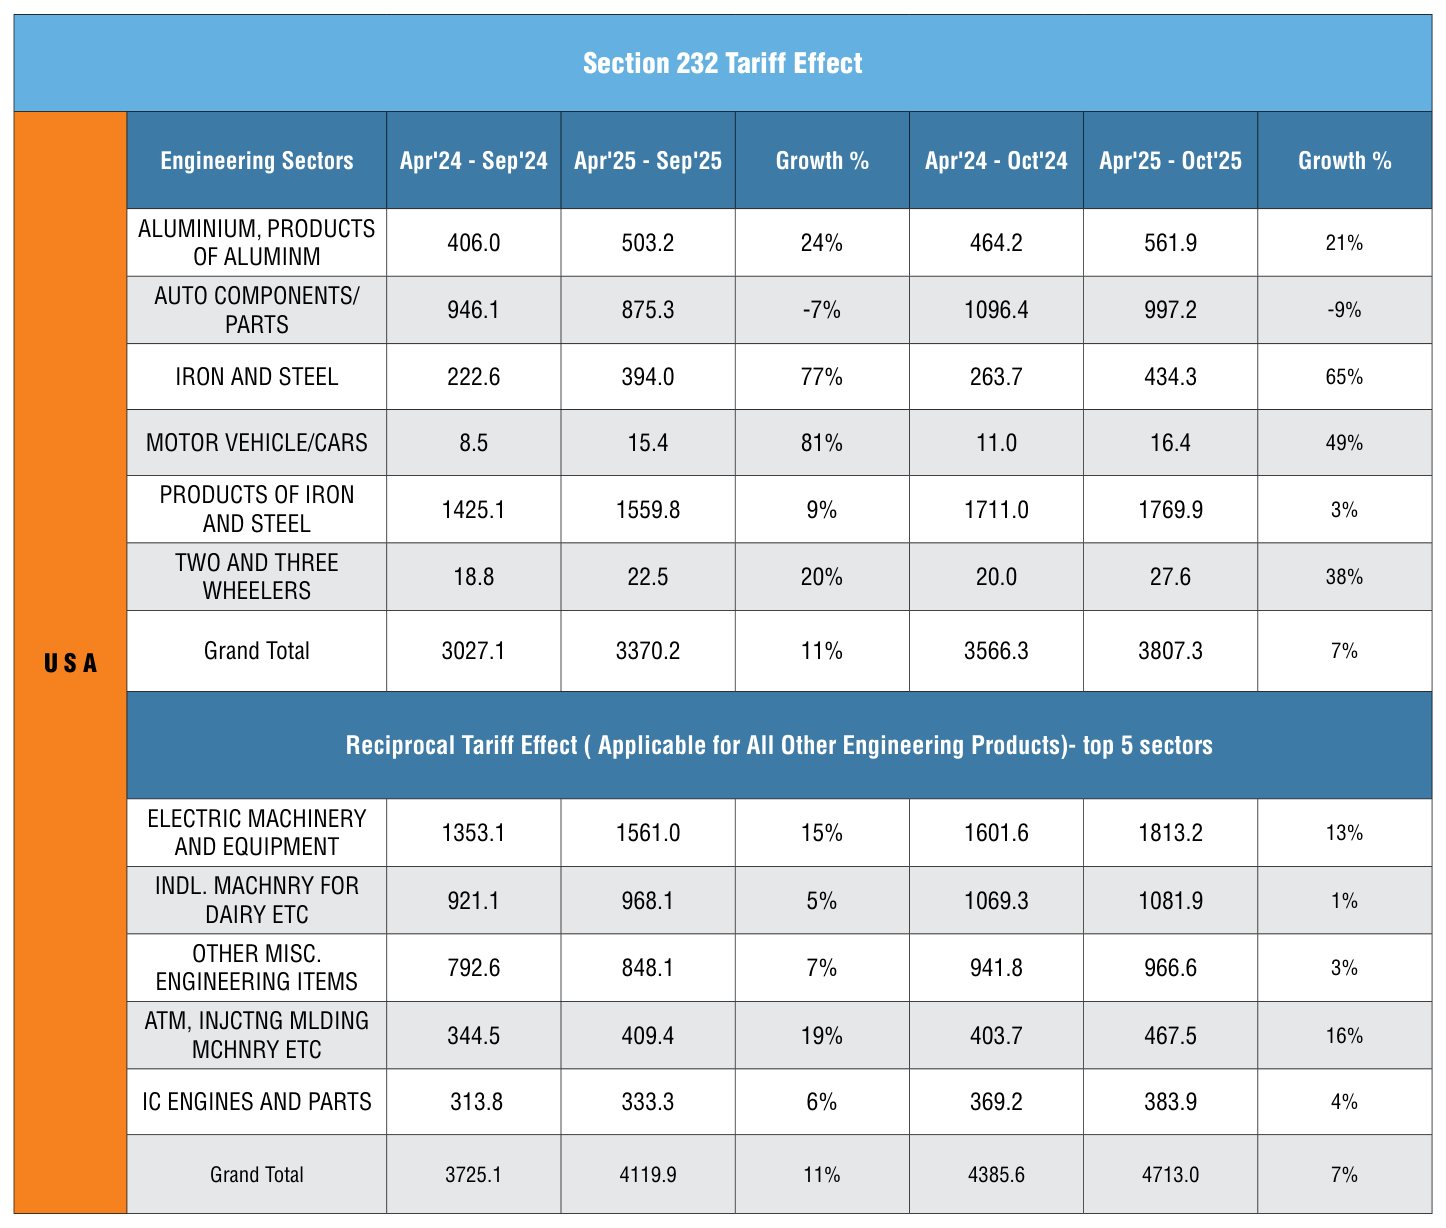
Source: DGCI&S
India’s engineering exports to the USA demonstrate contrasting patterns under Section 232 tariffs and reciprocal tariffs during AprilOctober 2025-26. Under Section 232 tariffs (primarily affecting steel, aluminum, and automotive sectors), total exports grew 7% to $3,807.3 million, though growth decelerated from 11% in April-September to 7% by October due to increased tariff burdens from 25% to 50% on these metals. Iron and steel exports surged 65%, reflecting strong demand despite tariff pressures, while auto components declined 7-9% as higher duties eroded competitiveness.
Under reciprocal tariffs affecting other engineering products, exports reached $4,713.0 million with 7% growth, led by electric machinery (13%) and injection molding machinery (16%), showing resilience in high-value manufacturing segments. However, growth slowed from 11% (April-September) to 7% (April-October), indicating mounting pressure as the USA imposed broader 25-27% reciprocal tariffs on approximately $12.5 billion worth of Indian engineering goods from August 2025.
Overall, India’s engineering exports to the USA total approximately $8.5 billion (April-October 2025), with products of iron and steel ($1,769.9 million) and electric machinery ($1,813.2 million) leading. While sectors like aluminum products (21% growth) and two/threewheelers (38% growth) thrived, auto components faced challenges due to tight margins under elevated tariffs.
EU SAFEGUARD IMPACT
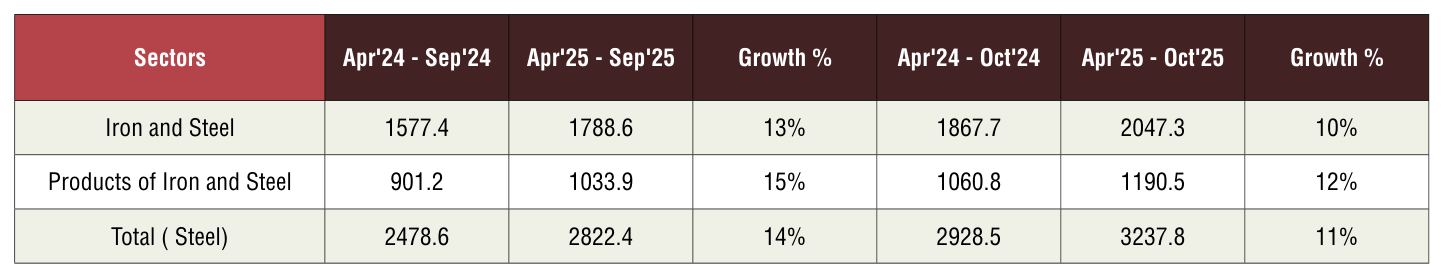
The EU steel safeguard measures continue to impact Indian exporters significantly.Under the tariffrate quota system, Indian steel shipments to the EU are subject to strict product-specific and countryspecific quotas. Once these quotas are exhausted, any additional exports attract a 25% duty, making them commercially unviable. This has led to increased competition among Indian mills. Furthermore, the safeguard extension until June 2026 adds uncertainty for longterm contracts. The recent impact on India’s exports of steel and products of Steel to EU highlighted below:
Table 6: EU Safeguard Impact (Value in US$ million)
Source: DGCI&S
India’s iron and steel exports to the EU continue to grow in value despite mounting pressure from safeguard measures.Between April–September 2024 and 2025,exports of iron and steel rose 13% (US$1,577.4 mn to 1,788.6 mn) and products of iron and steel grew 15% (US$901.2 mn to 1,033.9 mn), giving an overall increase of 14%. For growth moderates to 10–12%, signaling early effects of quota limits and duties.
ENGINEERING EXPORTS – STATE-WISE ANALYSIS
State wise engineering export performance- Data as on 2025-26
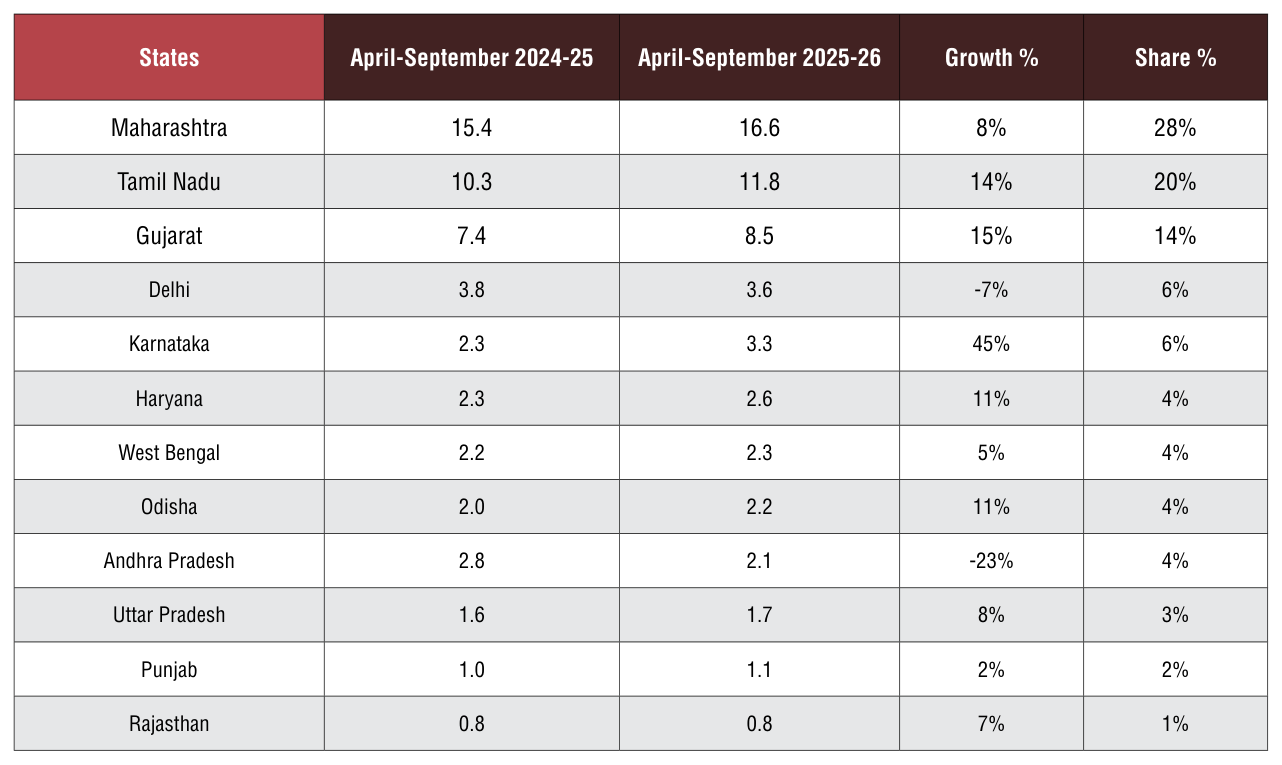
The table below indicates the exports from top Indian states.It is evident from the table that almost 91.5% of India’s exports is contributed by the listed 12 states.Within this almost 50 percent of exports is done by Maharashtra, Tamil Nadu and Gujarat together.
Table 7: Top state wise engineering export performance – April-September 2025-26 (Value in US$ million)
DGCIS Portal
The top 12 Indian states account for approximately 95% of India’s engineering exports, with Maharashtra, Tamil Nadu, and Gujarat dominating at a combined 62% share during April-September 2025-26. Maharashtra leads with 16.6 billion USD in engineering exports (AprilSep 2025-26), up 8% from 15.4
billion USD, securing a 28% national share through its robust ecosystem in engineering goods. West Bengal recorded steady 5% growth from 2.2 to 2.3 billion USD, holding a 4% share. Odisha achieved 11% growth to 2.2 billion USD (4% share) during April-September 2025-26.
From April-September 2024-25 to the same period in 2025-26, these states showed varied growth: strong performers like Karnataka (45%), Gujarat (15%), and Tamil Nadu (14%) drove overall expansion, while declines in Delhi (-7%) and Andhra Pradesh (-23%) has been highlighted. This concentration underscores the industrial hubs’ pivotal role in sustaining India’s engineering export momentum amid global demand.
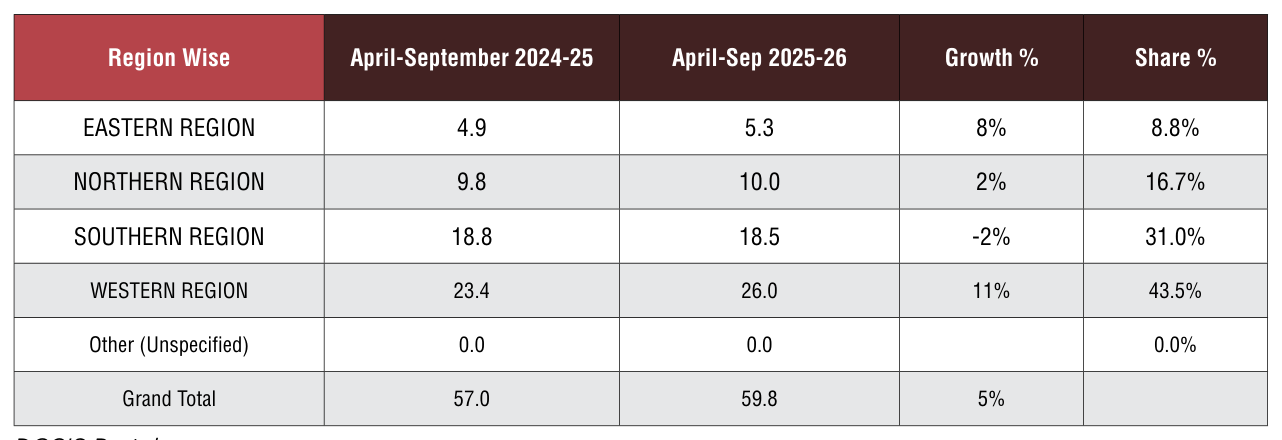
Table 8: India’s Region wise engineering exports (Value in US$ million)
DGCIS Portal
India’s engineering exports reached $59.8 billion in April-September 2025-26, up 5% from $57.0 billion the previous year, with the Western Region dominating at 43.5% share ($26.0 billion). The Western Region leads with $26.0 billion in exports (April-Sep 2025-26), reflecting 11%
growth from $23.4 billion and a 43.5% share, fueled by Maharashtra and Gujarat’s manufacturing hubs. Eastern Region exports rose 8% to $5.3 billion (8.8% share), driven by states like West Bengal and Odisha leveraging ports and industry for consistent gains. Southern Region
saw a slight 2% decline to $18.5 billion (31.0% share) from $18.8 billion, despite strong bases in Tamil Nadu and Karnataka. Northern Region grew modestly 2% to $10.0 billion (16.7% share), with Delhi and Haryana contributing majorly.

CORRELATION BETWEEN MANUFACTURING OUTPUT AND ENGINEERING EXPOR
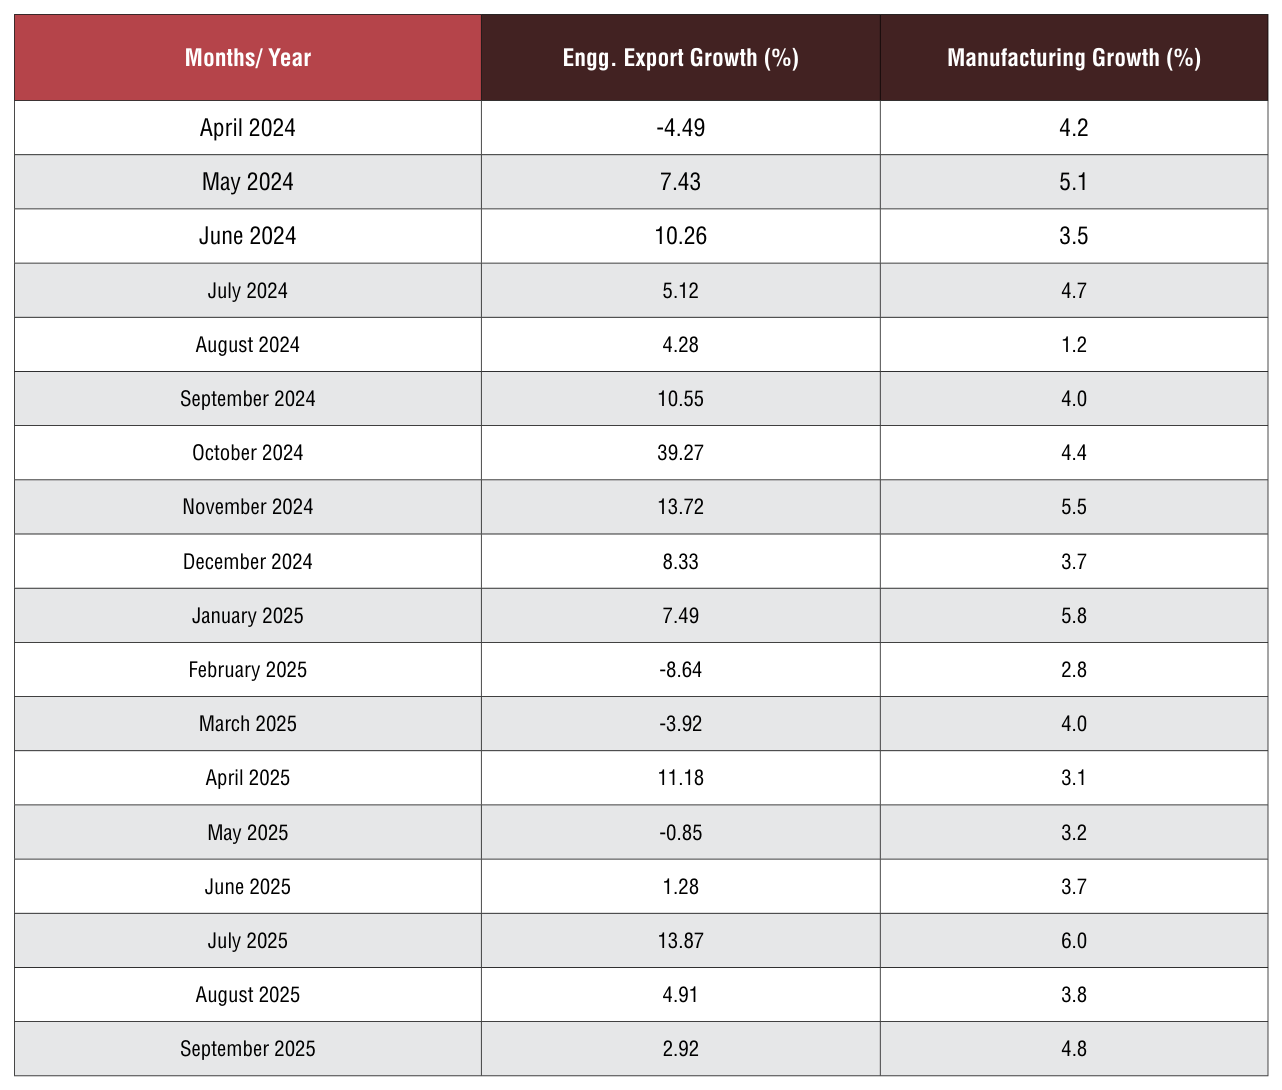
Engineering forms a considerable part of the broader manufacturing sector and the share of engineering production in overall manufacturing output is quite significant. As exports generally come from what is produced within a country, some correlation between manufacturing production growth and engineering export growth should exist. We briefly look at the trend in manufacturing growth as also engineering export growth to see if they move in tandem. It may be mentioned that manufacturing has 77.63% weightage in India’s industrial production.
Engineering export growth and manufacturing output growth moved in the same direction in as many as nine out of twelve months in each of the fiscal years 2019-20 and 2020-21. During fiscal 202122, engineering export growth and manufacturing growth moved in the same direction in seven out of twelve monthswhile in each of fiscal 2022-23 and 2023-24, as many as 10 out of 12 months saw engineering exports and manufacturing output moved in the same direction. In 2024-25, both moved in the same direction in eight out of 12 months.
The first two month of fiscal 202526 saw engineering export growth and manufacturing output growth moved in the opposite direction. In April, engineering export growth surged to double digit and manufacturing growth decelerated, while in May engineering export declined and manufacturing output growth inched up over the month. Then, In June, July and August 2025 however, both moved on the same direction. In June and July, both witnessed improvement in growth while in Aug 2025, both conceded moderation in growth. In September 2025 however, engineering growth continued to slowdown but manufacturing growth accelerated.
The link between these two may not be established in one or two months, but a positive correlation may be seen if medium to long term trend is considered.
Table 9: Engineering exports growth vis-à-vis manufacturing growth from April 2024
(Source: Department of Commerce and CSO )
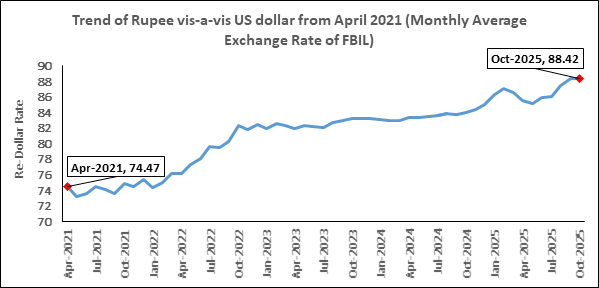
How did the exchange rate fare during October 2025 and what was the recent trend in Re-Dollar movement? In order to get a clearer picture of the recent Re-Dollar trend,
not only we took the exchange rate of October 2025, but also considered monthly average exchange rate of Rupee vis-à-vis the US Dollar for each month of fiscal 2023-24,
2024-25 and fiscal 2025-26 as per the latest data published, as mere one-month figure does not reflect any trend. The following two tables clearly depicts the short-term trend.
Table 10: USD-INR monthly average exchange rate in 2025-26 vis-à-vis 2024-25 (As per latest data released by FBIL)
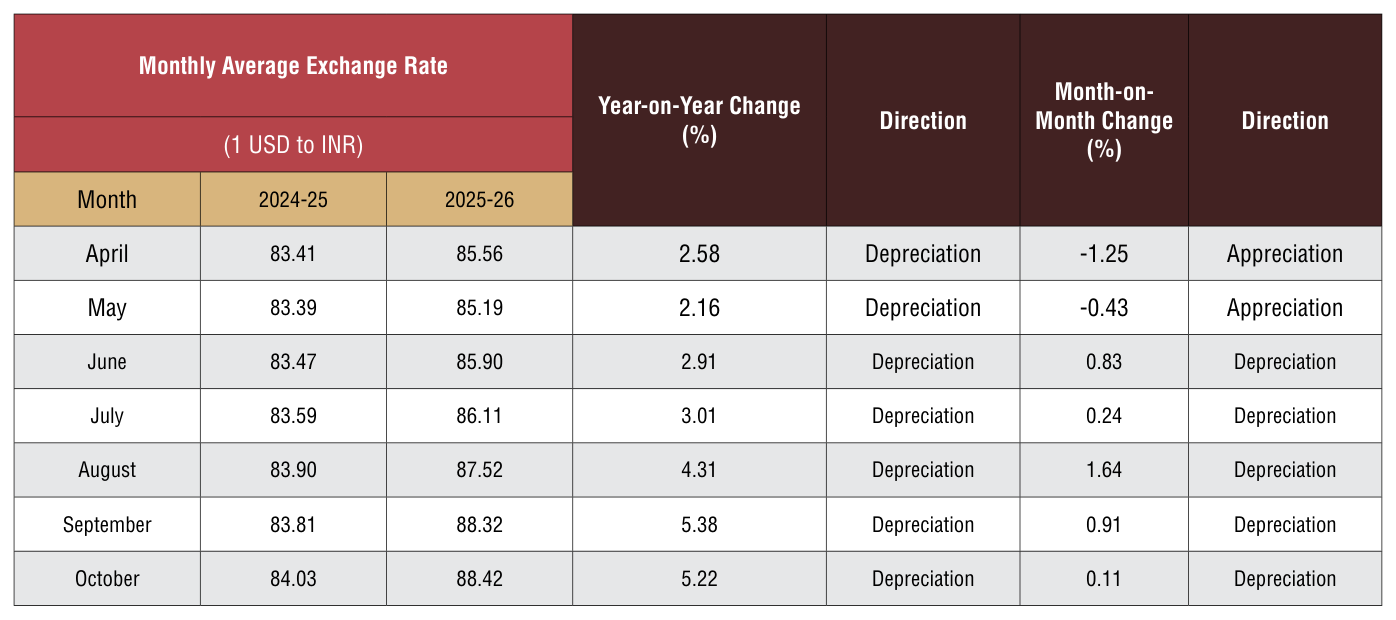
Rupee continued to depriciate vis-à-vis the US Dollar for the fifth straight month to October 2025 both on a monthly as well as yearly basis: INR depreciated vis-à-vis the US Dollar by a marginal 0.11 percent in October 2025 over the previous month but the year-on-year depreciation was much higher 5.22 percent. Rupee closed the month at slightly higher than its all-time low, Capital outflow from Indian markets due to uncertainty over US pressure on India in the form of higher tariff and warning on oil purchase from Russia continue to weigh on rupee.
Outlook: Rupee is not expected to see any further sharp fall in the near term. It is expected to remain rangebound as dollar remains under pressure against some major currencies. However, global uncertainty will keep the currency market volatile.
Table 11: USD-INR monthly average exchange rate in 2024-25 vis-à-vis 2023-24 (As per latest data released by FBIL)
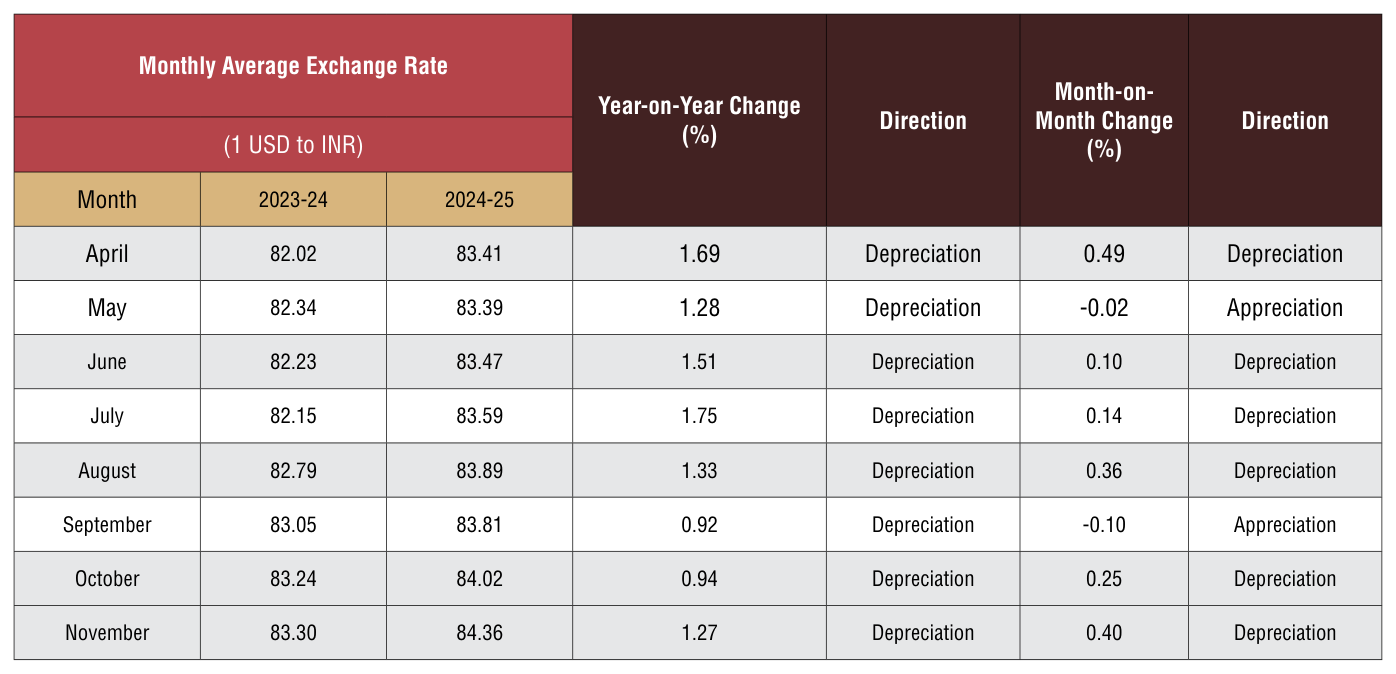
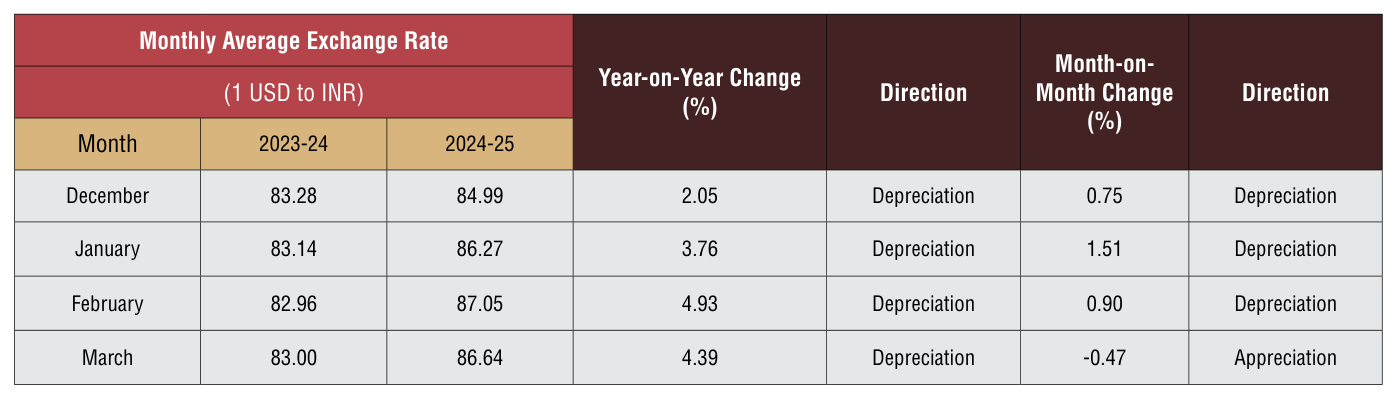
Fig 2: Trend of Rupee vis-a-vis US dollar from April 2021 (Monthly Average Rate of FBIL has been considered)
(Source: Department of Commerce and CSO )
ANALYSIS OF INDIA’S ENGINEERING IMPORTS
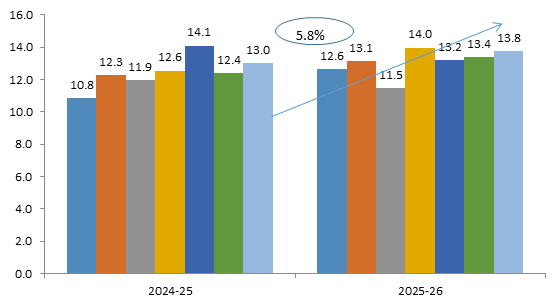
- India’s Engineering imports during October 2025 were valued at US$ 13.8 billion compared to US$ 13.0 billion in October 2024 registering a positive growth of 5.8 percent in dollar terms. In cumulative terms (Apr-Oct 2025), India’s imports increased by 7.5 percent.
- In October 2025, imports increased sharply for two and three wheelers, along with increase in motor vehicles & cars, project goods, tin and its products , auto tyres & tubes, aluminium and its products, electric machinery & equipments, other rubber products except footware,machine tools, cranes, etc.
- In October 2025, import increase was mainly noted from SSA( Sub Saharan Africa) NE Asia,South Asia, CIS, EU and Oceania. In cumulative terms import increased from all regions barring North America and Latin America.
- The share of engineering imports in India’s total merchandise imports in Apr-Oct 2025 was estimated at 20.8 percent.
- 41.9 % of India’s engineering imports come from N E Asia and 20.6 % from the EU. The next major suppliers are ASEAN (12.2%), North America (7.8%) and WANA (7.0%) during Apr-Oct 2025.
Fig 3: Monthly Engineering Imports for April-October 2025-26 vis-a-vis April-October 2024-25
Source: DGCI&S
TREND IN ENGINEERING TRADE BALANCE
We now present the trend in two-way yearly trade for the engineering sector for the 2025-26 depicted in the table below:
Table 12: Monthly Trend in Engineering Trade Balance for the current FY 2025-26 (US$ Billions)
Source: DGCI&S, EEPC India Analysis
CONCLUSION
After conceding significant growth for the last four consecutive months, engineering exports took a hit for the second time in the current fiscal. While high base effect was one of the reasons of the drop, it was also result of the US administered reciprocal tariffs which took effect from August
2025. India’s engineering exports to the US declined by 14.5%. Decline was also noted in other prominent export destinations including UAE, EU countries, ASEAN countries, etc.The industry believes that trade diversion due to US tariffs is one of the reasons behind the declining exports. In this diffiuclt time, we are
thankful that the DGFT allocated more than INR 25000 crores for Export Promotion Mission. Exporters are eagerly anticipating its implementation. Additionally, the allocation of INR 20000 for credit guarantee is also expected to boost the morale of the engineering industry.
ENGINEERING PRODUCT PANELS – COUNTRY-WISE ANALYSIS
We now analyze the performance of some of the important products for the fiscal April-October 2025-26 vis-àvis April-October 2024-25. We have taken the major panels and computed the top importers to get an idea of the current trade pattern.
Engineering Product Panel - Country matrix
Engineering Product Panel - Country matrix
Source: DGCI&S
- In April-October 2025, Italy, USA and Belgium ranked as the top three importers of Indian Iron and Steel, while the USA, UAE and Germany lead in import of products of Iron & Steel.
- The USA stood out as the primary importer of Indian ‘Industrial machinery,’ making up 20% of India’s global exports in this category, followed by UAE and Germany with 6% ad 4% shares, respectively during April-October 2025.
- South Africa, Saudi Arabia, Mexico, Japan and UAE were top importers of India’s Automobiles during April-October 2025 in India’s global exports respectively over the same period previous fiscal.
- USA, Saudi Arab, South Korea, China and Vietnam were the top importers of India’s Non-ferrous metals and products during April-October 2025.
- USA, UK, Singapore and Germany were the top importers of Indian Electrical Machinery & Components during the same period with 20%, 10%, 10% and 7% shares respectively.
- USA, France,UK, Germany and Singapore were the top importers of India’s Aircrafts and Spacecraft during April-October 2025, making up to 70% of India’s total export of Aircrafts and Spacecraft.

- Singapore, UAE and Sri Lanka became the largest importer of ships, boats and floating structures followed by Indonesia and Oman during April-October 2025.
- For the auto components’ product group, USA remained the top importer in April-October 2025 followed by Germany, Brazil, UAE and Bangladesh, making up to 41% of India’s total export under this category.
© Copyright , All rights reserved. Design by Andreal