


VOL. 18, ISSUE NO. 8 | November 2025
Oversight


| Trade Flow | Export figures (in $ billion) | % Growth | ||||
|---|---|---|---|---|---|---|
| Sep-2024 | Sep-2025 | Apr - Sep 2024-25 |
Apr - Sep 2025-26 |
Sep 2025 over Sep 2024 |
Apr-Sep 2025 over Apr-Sep 2024 |
|
| Engineering exports | 9.83 | 10.11 | 56.34 | 59.36 | 2.93% | 5.35% |
| Overall merchandise exports | 34.08 | 36.38 | 213.68 | 220.12 | 6.76% | 3.02% |
| Share of engineering (%) | 28.83% | 27.80% | 26.37% | 26.97% | --- | --- |
| Service Exports | 32.60 | 30.82 | 182.03 | 193.18 | -5.46% | 6.13% |
Source: Compiled from data by DGCI&S and Quick Estimates published by the Government of India.
Engineering exports continued its growth run for the fourth straight month to September 2025 but with a moderated growth of 2.93 percent as against 4.90 percent in August 2025 and a high double digit growth of 13.86 percent in July 2025. Engineering exports in September 2025 was recorded at USD 10.11 billion as against USD 9.83 billion in the same month last year. Engineering exports recorded increase on a monthon- month basis too as it crossed USD 10 billion for the second month in this fiscal after July 2025 but higher base of September 2024resulted in a slower growth rate on a year-on-year basis. It is definitely a good sign that despite of 9.4 percent decline in engineering exports to USA due to the tariff escalation by the USA from end of August 2025, engineering exports from India is still growing. On a cumulative basis, engineering exports recorded 5.35 percent year-on-year growth during the first half of fiscal 2025-26 as it went up to USD 59.36 billion in Apr – Sep 2025-26 from USD 56.34 billion during the same period last fiscal. The share of engineering in total merchandise exports was recorded at 27.8 percent in September 2025 while it was recorded at around 27 percent on a cumulative basis during April – September 2025-26. This growth in September 2025 was basically attributed to growth in shipment of Lead and products of Lead, Motor vehicles/ Cars, Two and three wheelers, Iron and steel,and Electric Machinery among others. Region wise, decent growth in exports to ASEAN, North-East Asia, Sub-Saharan Africa, Latin America and South Asia helped engineering exports to improve over the year.
HIGHLIGHTS:
- Engineering exports continued its growth run for the fourth straight month to September 2025 but with a moderated growth of 2.93 percent as against 4.90 percent in August 2025 and a high double digit growth of 13.86 percent in July 2025.
- Engineering exports in September 2025 was recorded at USD 10.11 billion as against USD 9.83 billion in the same month last year.
- Engineering exports recorded increase on a month-on-month basis too as it crossed USD 10 billion for the second month in this fiscal after July 2025 but higher base of September 2024 resulted in a slower growth rate on a year-on-year basis.
- On a cumulative basis, engineering exports recorded 5.35 percent year-on-year growth during the first half of fiscal 2025-26 as it went up to USD 59.36 billion in Apr – Sep 2025-26 from USD 56.34 billion during the same period last fiscal.
- The share of engineering in total merchandise exports was recorded at 27.80 percent in September 2025. The share was recorded at around 27 percent on a cumulative basis during April – September 2025-26.
- In September 2025, 23 out of 34 engineering panels witnessed positive year-on-year growth. While 11 engineering panels including mainly Industrial Boilers, Pumps and Valves, Air-condition and Refrigeration Machinery, Aircrafts and Spacecrafts, Ship and Boats, Medical and Scientific Instruments, Hand Tools and Cutting Tools and Cranes, Lifts and Winches, etc. witnessed decline in exports during September 2025 vis-à-vis September 2024.
- On a cumulative basis, 28 out of 34 engineering panels recorded positive growth and remaining 6 engineering panels including Non-ferrous sectors including Aluminium products and Zinc products, Aircraft and Spacecrafts and Ships, boats and floating products and Cranes, Lifts and Winches etc. recorded negative growth during April-September 2025-26.
- Region wise, North America and EU remained the top two exporting regions for Indian engineering but exports to both the regions declined in September 2025 on a year-on-year basis. Decent growth in exports was observed in ASEAN, North-East Asia, Sub-Saharan Africa, Latin America and South Asia. On a cumulative basis however, engineering exports to North America and EU are still growing.
- Country-wise, USA remained the top destination followed by UAE but exports to these two countries declined year-on-year in September 2025 while for the other top destinations vizGermany, UK and Saudi Arabia, exports recorded double digit growth in September 2025 over the same month last fiscal. On a cumulative basis, exports to USA grew over the years but shipments to UAE and Saudi Arabia declined.
ENGINEERING EXPORTS: MONTHLY TREND:
The monthly engineering export figures for 2025-26 vis-à-vis 2024-25 are shown below as per the latest DGCI&S estimates:
Table 1: Engineering Exports: Monthly Trend in 2025-26 (Values in USD Million)
| Month | 2024-25 | 2025-26 | Growth (%) |
|---|---|---|---|
| April | 8557.11 | 9512.81 | 11.17 |
| May | 9974.13 | 9889.10 | -0.85 |
| June | 9386.21 | 9506.66 | 1.28 |
| April-June | 27917.46 | 28908.56 | 3.55 |
| July | 9162.17 | 10433.11 | 13.87 |
| Month | 2024-25 | 2025-26 | Growth (%) |
|---|---|---|---|
| August | 9437.14 | 9899.94 | 4.90 |
| September | 9826.24 | 10114.57 | 2.93 |
| July-September | 28425.55 | 30447.62 | 7.11 |
| April- September | 56343.01 | 59356.18 | 5.35 |
TOP 25 ENGINEERING EXPORT DESTINATIONS IN SEPTEMBER 2025
We now look at the export scenario of the top 25 nations that had highest demand for Indian engineering products during September 2025 over September 2024 as well as in cumulative terms during April-September 2025-26 vis-à-vis April-September 2024-25. The data clearly shows that top 25 countries contribute almost 75 % of total engineering exports.
Table 2: Engineering exports country-wisein April-September 2025-26 vis-à-vis April-September 2024-25 (Values in USD Million)
| Countries | Sep-24 | Sep-25 | Growth (%) | Apr'24 – Sep'24 | Apr'25 - Sep'25 | Growth (%) |
|---|---|---|---|---|---|---|
| U S A | 1553.48 | 1407.42 | -9.4% | 9294.85 | 10041.75 | 8.0% |
| UAE | 672.39 | 636.86 | -5.3% | 3909.22 | 3713.28 | -5.0% |
| GERMANY | 362.56 | 429.89 | 18.6% | 2093.53 | 2460.11 | 17.5% |
| U K | 325.05 | 390.38 | 20.1% | 1944.52 | 2312.95 | 18.9% |
| SAUDI ARABIA | 388.34 | 441.37 | 13.7% | 2612.96 | 2278.30 | -12.8% |
| SINGAPORE | 287.85 | 299.14 | 3.9% | 1960.54 | 2079.60 | 6.1% |
| ITALY | 202.88 | 295.56 | 45.7% | 1490.41 | 1674.82 | 12.4% |
| MEXICO | 300.86 | 274.45 | -8.8% | 1893.58 | 1659.96 | -12.3% |
| KOREA RP | 192.72 | 276.91 | 43.7% | 1286.63 | 1449.57 | 12.7% |
| SOUTH AFRICA | 277.86 | 269.69 | -2.9% | 1173.30 | 1426.66 | 21.6% |
| CHINA | 264.15 | 302.21 | 14.4% | 1343.06 | 1389.96 | 3.5% |
| JAPAN | 256.99 | 249.37 | -3.0% | 1166.58 | 1307.31 | 12.1% |
| BRAZIL | 192.58 | 202.60 | 5.2% | 1106.03 | 1277.60 | 15.5% |
| NEPAL | 200.83 | 177.90 | -11.4% | 1104.51 | 1186.18 | 7.4% |
| NETHERLAND | 151.32 | 172.27 | 13.8% | 952.51 | 1100.17 | 15.5% |
| FRANCE | 386.01 | 169.34 | -56.1% | 1159.14 | 1099.61 | -5.1% |
| THAILAND | 179.26 | 187.61 | 4.7% | 1001.27 | 1091.71 | 9.0% |
| BANGLADESH | 175.95 | 152.72 | -13.2% | 1024.89 | 1014.91 | -1.0% |
| TURKEY | 199.85 | 131.04 | -34.4% | 1709.87 | 993.16 | -41.9% |
| BELGIUM | 138.35 | 148.30 | 7.2% | 716.22 | 913.08 | 27.5% |
| SPAIN | 150.29 | 200.45 | 33.4% | 696.39 | 830.04 | 19.2% |
| INDONESIA | 142.93 | 134.62 | -5.8% | 1087.71 | 810.20 | -25.5% |
| VIETNAM | 121.06 | 165.44 | 36.7% | 703.81 | 780.35 | 10.9% |
| MALAYSIA | 114.61 | 203.70 | 77.7% | 725.62 | 749.18 | 3.2% |
| Australia | 105.12 | 119.24 | 13.4% | 601.88 | 731.31 | 21.5% |
| Total engineering exports to top 25 countries | 7343.28 | 7438.47 | 1.3% | 42759.03 | 44371.77 | 3.8% |
| Total engineering exports | 9826.24 | 10114.57 | 2.9% | 56343.01 | 59356.18 | 5.3% |
Source: DGCI&S, Govt. of India
REGION WISE INDIA’S ENGINEERING EXPORTS
The following table depicts region wise India’s engineering exports for April-September 2025 as compared to April-September 2024
Table 3: Region wise engineering exports in April-September 2025-26 vis-à-vis April-September 2024-25 (Values in USD Million)
| Region | Sep-24 | Sep-25 | Growth (%) | Apr'24 – Sep'24 | Apr'25 - Sep'25 | Growth (%) |
|---|---|---|---|---|---|---|
| NORTH AMERICA | 1951.6 | 1796.6 | -7.9% | 11796.5 | 12373.9 | 4.9% |
| EUROPEAN UNION | 1914.2 | 1874.4 | -2.1% | 9729.8 | 10719.1 | 10.2% |
| WANA | 1614.3 | 1586.2 | -1.7% | 9119.3 | 8674.9 | -4.9% |
| ASEAN | 906.3 | 1081.7 | 19.4% | 5994.7 | 6079.3 | 1.4% |
| SSA( Sub Saharan Africa) | 794.9 | 869.1 | 9.3% | 3948.2 | 4751.2 | 20.3% |
| N E ASIA | 770.4 | 915.5 | 18.8% | 4285.3 | 4722.9 | 10.2% |
| LATIN AMERICA | 510.1 | 577.3 | 13.2% | 2936.8 | 3543.9 | 20.7% |
| OTHER EUROPE | 556.9 | 564.7 | 1.4% | 3892.8 | 3543.6 | -9.0% |
| SOUTH ASIA | 523.1 | 559.4 | 6.9% | 3051.9 | 3252.0 | 6.6% |
| OCEANIA | 118.9 | 134.4 | 13.0% | 691.0 | 807.5 | 16.9% |
| CIS | 160.1 | 143.3 | -10.5% | 880.6 | 802.8 | -8.8% |
| OTHERS | 5.6 | 11.9 | 114.8% | 16.0 | 84.9 | 431.9% |
| Grand Total | 9826.2 | 10114.6 | 2.9% | 56343.0 | 59356.2 | 5.3% |
Source: DGCI&S
Note: Myanmar has been included in ASEAN and not in South Asia, since ASEAN is a formal economic grouping.
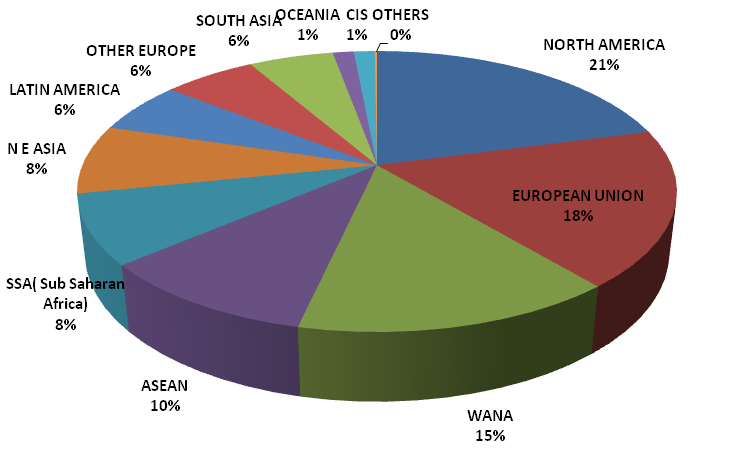
Figure 1: Region-wise shares of India’s engineering exports during April-September 2025-26
PANEL WISE INDIA’S ENGINEERING EXPORTS
In this section we look at the Engineering Panel wise exports for the month of September 2025 vis-à-vis September 2024 as well as the cumulative exports for April-September 2025-26 vis-à-vis April-September 2024-25. These are indicated in the tables below.
Table 4: Panel-wise Export Analysis for April-September 2025-26 vis-à-vis April-September 2024-25 (Value in US$ million)
| S. No | Product panels | Sep-24 | Sep-25 | Growth % | Apr'24 - Sep'24 | Apr'25 - Sep'25 | Growth % |
|---|---|---|---|---|---|---|---|
| 1. Iron and Steel and Products made of Iron and Steel | |||||||
| A | Iron and steel | 739.3 | 868.7 | 17% | 4613.4 | 4905.3 | 6.3% |
| B | Products of Iron and Steel | 827.7 | 829.6 | 0% | 4808.3 | 5204.9 | 8% |
| Sub Total | 1567.0 | 1698.3 | 8% | 9421.6 | 10110.2 | 7% | |
| 2. Non-Ferrous Metals and Products made of Non-Ferrous Metals | |||||||
| A | Copper and products | 246.7 | 271.3 | 10% | 1052.5 | 1296.2 | 23% |
| B | Aluminium and products | 526.2 | 551.1 | 5% | 3310.8 | 3122.8 | -6% |
| C | Zinc and products | 58.1 | 71.8 | 24% | 347.4 | 329.7 | -5% |
| D | Nickel and products | 15.2 | 18.2 | 20% | 87.7 | 89.1 | 2% |
| E | Lead and products | 64.4 | 121.8 | 89% | 421.5 | 563.9 | 34% |
| F | Tin and products | 3.0 | 3.9 | 31% | 11.3 | 16.4 | 45% |
| G | Other Non-Ferrous Metals | 77.7 | 80.6 | 4% | 424.7 | 517.6 | 22% |
| Sub Total | 991.2 | 1118.8 | 13% | 5655.9 | 5935.7 | 4.9% | |
| 3. Industrial Machinery | |||||||
| A | Industrial Machinery like Boilers, parts, etc | 90.4 | 74.3 | -18% | 409.8 | 468.5 | 14% |
| B | IC Engines and Parts | 324.6 | 354.2 | 9% | 1846.9 | 2121.8 | 15% |
| C | Pumps of all types | 136.0 | 134.2 | -1% | 759.6 | 791.6 | 4% |
| D | Air condition and Refrigerators | 175.9 | 169.3 | -4% | 915.1 | 1094.0 | 20% |
| E | Industrial Machinery for dairy, food processing, etc | 701.3 | 733.6 | 5% | 4067.8 | 4447.5 | 9% |
| F | Machine Tools | 61.1 | 81.6 | 34% | 393.0 | 471.4 | 20% |
| G | Machinery for Injecting moulding, valves and ATMs | 241.4 | 263.0 | 9% | 1363.2 | 1549.1 | 14% |
| Sub Total | 1730.7 | 1810.2 | 5% | 9755.5 | 10943.9 | 12% | |
| 4. Electrical Machinery | |||||||
| A | Electrical Machinery | 1273.5 | 1349.7 | 6% | 6973.7 | 7731.4 | 11% |
| 5. Automobiles | |||||||
| A | Motor Vehicle/cars | 788.7 | 1045.2 | 33% | 4397.7 | 5399.2 | 23% |
| B | Two and Three Wheelers | 265.5 | 329.4 | 24% | 1544.7 | 1891.3 | 22% |
| C | Auto Components/Part | 688.9 | 741.0 | 7.6% | 4093.1 | 4387.8 | 7% |
| D | Auto Tyres and Tubes | 257.0 | 245.5 | -4% | 1513.7 | 1573.7 | 4% |
| Sub Total | 2000.0 | 2361.1 | 18% | 11549.2 | 13252.0 | 14.7% | |
| 6. Aircrafts and Spacecraft parts and products | |||||||
| A | Aircrafts and Spacecraft parts and products | 716.2 | 129.3 | -82% | 2989.4 | 798.2 | -73% |
| 7. Ships Boats and Floating products and parts | |||||||
| A | Ships Boats and Floating products and parts | 169.6 | 164.5 | -3% | 2171.0 | 1871.5 | -14% |
| 8. Other engineering products | |||||||
| A | Medical and Scientific instruments | 260.6 | 237.9 | -9% | 1345.0 | 1429.0 | 6% |
| B | Railway Transport | 22.2 | 62.0 | 179% | 153.7 | 252.8 | 64% |
| C | Hand Tools & Cutting Tools | 89.2 | 81.3 | -9% | 503.9 | 526.1 | 4% |
| D | Bicycle & Parts | 34.7 | 41.6 | 20% | 188.9 | 237.4 | 26% |
| E | Cranes Lifts & Winches | 107.3 | 86.0 | -20% | 562.2 | 555.4 | -1% |
| F | Office Equipment | 22.3 | 38.7 | 73% | 140.8 | 198.2 | 41% |
| G | Other Construction Machinery | 268.8 | 293.5 | 9% | 1526.9 | 1711.0 | 12% |
| H | Prime Mica & Mica Products | 2.6 | 2.5 | -2% | 15.0 | 16.2 | 8% |
| I | Other Misc. Items | 427.6 | 490.2 | 15% | 2513.2 | 2840.1 | 13% |
| 9. Project Goods | |||||||
| Project Goods | 0.3 | 0.2 | -39% | 1.1 | 0.7 | -37% | |
| 10. Other Rubber Product Except Footwear | |||||||
| Other Rubber Product Except Footwear | 142.6 | 149.0 | 4% | 875.9 | 946.3 | 8% | |
| Sub total | 1235.2 | 1333.7 | 8% | 6949.7 | 7766.3 | 12% | |
| Total engineering exports | 9826.2 | 10114.6 | 2.9% | 56343.0 | 59356.2 | 5.35% | |
Source: DGCI&S
Reasons for Decline (As per April-September 2025-26)
Aluminium
- While cumulative aluminium exports have remained negative, it recorded growth in both August and September which is a positive trend
- Massive decline noted in Turkey (80%) mainly due to ongoing geo-political tensions. Decline was also noted in Mexico, Netherlands, Bangladesh, Canada and Spain
- Increase in exports to US by more than 20% despite the Section 232 tariff
- Increase in domestic demand is also a reason behind declining exports
Zinc
- As per the London Metal Exchange the global zinc market is facing significant downturn due to international trade tensions and weak macroeconomic conditions
Table 5: Panel-wise shares in India’s total engineering exports during April-September 2025-26
| SI. No | Product Panels | Apr'24 - September'24 (Share%) | Apr'25 - September'25 (Share %) |
|---|---|---|---|
| 1. Iron and Steel and Products made of Iron and Steel | |||
| A | Iron and Steel | 8.2% | 8.3% |
| B | Products of Iron and Steel | 8.5% | 8.8% |
| Sub Total | 16.7% | 17% | |
| 2. Non-Ferrous Metals and Products made of Non-Ferrous Metals | |||
| A | Copper and products | 1.9% | 2% |
| B | Aluminium and products | 5.9% | 5% |
| C | Zinc and products | 0.6% | 1% |
| D | Nickel and products | 0.2% | 0% |
| E | Lead and products | 0.7% | 1% |
| F | Tin and products | 0% | 0% |
| G | Other Non-Ferrous Metals | 0.8% | 1% |
| Sub Total | 10.0% | 10% | |
| 3. Industrial Machinery | |||
| A | Industrial Machinery like Boilers, parts, etc | 1% | 1% |
| B | IC Engines and Parts | 3.3% | 3.6% |
| C | Pumps of all types | 1% | 1% |
| D | Air condition and Refrigerators | 1.6% | 1.9% |
| E | Industrial Machinery for dairy, food processing , textiles etc | 7% | 8% |
| F | Machine Tools | 0.7% | 0.8% |
| G | Machinery for Injecting moulding, valves and ATMs | 2% | 3% |
| Sub Total | 17.3% | 18.4% | |
| 4. Electrical Machinery | |||
| Electrical Machinery | 12.4% | 13% | |
| 5. Automobiles | |||
| A | Motor Vehicle/cars | 7.8% | 9.1% |
| B | Two and Three Wheelers | 2.7% | 3.2% |
| C | Auto Components/Part | 7.3% | 7.4% |
| D | Auto Tyres and Tubes | 2.7% | 2.7% |
| Sub Total | 20.5% | 22.3% | |
| 6. Aircrafts and Spacecraft parts and products | |||
| Aircrafts and Spacecraft parts and products | 5.3% | 1.3% | |
| 7. Ships Boats and Floating products and parts | |||
| Ships Boats and Floating products and parts | 3.9% | 3.2% | |
| 8. Other engineering products | |||
| A | Medical and Scientific instruments | 2.4% | 2.4% |
| B | Railway Transport | 0.3% | 0.4% |
| C | Hand Tools & Cutting Tools | 0.9% | 0.9% |
| D | Bicycle & Parts | 0.3% | 0.4% |
| E | Cranes Lifts & Winches | 1.0% | 0.9% |
| F | Office Equipment | 0.3% | 0.3% |
| G | Other Construction Machinery | 2.7% | 2.9% |
| H | Prime Mica & Mica Products | 0.0% | 0.0% |
| I | Other Misc. Items | 4.5% | 4.8% |
| Sub Total | 12.3% | 13.1% | |
| 9. Project Goods | |||
| Project Goods | 0.0% | 0.0% | |
| 10. Other Rubber Product Except Footwear | |||
| Other Rubber Product Except Footwear | 1.6% | 1.6% | |
| Total engineering exports | 100% | 100% | |

ENGINEERING EXPORTS – STATE-WISE ANALYSIS State wise engineering export performance- Data as on 2024-25
(Note: Current fiscal 2025-26 data not yet updated inNiryat Portal)
The table below indicates the exports from top Indian states. It is evident from the table that almost 91.5% of India’s exports is contributed by the listed 12 states. Within this almost 50 percent of exports is done by Maharashtra, Tamil Nadu and Gujarat together.
Table 6: Top state wise engineering export performance – April-March 2024-25
| Top States | 2023-24 | 2024-25 | Growth% | %Share in India's Eng Export | Remark |
|---|---|---|---|---|---|
| Maharashtra | 22992.9 | 22546.4 | -1.9% | 19.7% | 91.5% share covered by top 12 states |
| Tamil Nadu | 16844.6 | 18108.6 | 7.5% | 15.8% | |
| Gujarat | 14753.3 | 16590.5 | 12.5% | 14.5% | |
| Telangana | 3458.0 | 7536.2 | 117.9% | 6.6% | |
| Karnataka | 6709.1 | 7277.3 | 8.5% | 6.3% | |
| Haryana | 6753.8 | 6764.5 | 0.2% | 5.9% | |
| Odisha | 7125.2 | 5910.1 | -17.1% | 5.2% | |
| Delhi | 4599.7 | 4684.5 | 1.8% | 4.1% | |
| Uttar Pradesh | 4117.9 | 4348.7 | 5.6% | 3.8% | |
| Andhra Pradesh | 4885.6 | 4319.4 | -11.6% | 3.8% | |
| West Bengal | 3134.8 | 3523.7 | 12.4% | 3.1% | |
| Rajasthan | 3405.3 | 3375.7 | -0.9% | 2.9% |
Source: NIRYAT portal
- Top 12 states constitute over 91.5 % of India’s engineering Exports. Once again, Karnataka maintained its 5th position, Telengana retained its 4th position, Odisha coming down to 7thposition, West Bengal coming down to 11th position, while Rajasthan moving up to 12th position and Haryana remarkably moved up to 6th position during the fiscal April-March 2024-25 compared to the same period last fiscal.( as per estimates of Niryat Portal)
- Major negative growth witnessed in states like Maharashtra ( decline by 1.9%), Odisha, ( decline by 17.1%), Andhra Pradesh (decline by 11.6%) and Rajasthan (decline by 0.9%) during April-March 2024-25 compared to the same period last fiscal.
- Maharashtra being the highest state in terms of Engineering Goods exports ( constituting a share of 19.7%) is leading by US$ 4.44 billion from Tamil Nadu(Second Highest State) for the period of April-March 2024-25
India’s Region Wise Engineering Exports
In terms of region, western region which includes industrial states like Maharashtra and Gujarat is the front runner in terms of exports with 34.1 percent share. Tamil Nadu from the Southern Region has retained its export performance and it ranked second after Maharashtra, while Gujarat and Telengana ranked third and fourth during April-March 2024-25.
| Region | 2023-24 | 2024-25 | Growth% |
|---|---|---|---|
| EASTERN REGION | 12236.7 | 11089.7 | -9.4% |
| NORTHERN REGION | 22651.0 | 22571.4 | -0.4% |
| SOUTHERN REGION | 33012.2 | 38262.6 | 15.9% |
| WESTERN REGION | 41415.4 | 42797.8 | 3.3% |
Note: The total engineering exports given in the above table is taken from NIRYAT as per the latest available data and may not tally with the total engineering exports as given by DGCI&S
CORRELATION BETWEEN MANUFACTURING OUTPUT AND ENGINEERING EXPORTS
Engineering forms a considerable part of the broader manufacturing sector and the share of engineering production in overall manufacturing output is quite significant. As exports generally come from what is produced within a country, some correlation between manufacturing production growth and engineering export growth should exist. We briefly look at the trend in manufacturing growth as also engineering export growth to see if they move in tandem. It may be mentioned that manufacturing has 77.63% weightage in India’s industrial production.
Engineering export growth and manufacturing output growth moved in the same direction in as many as nine out of twelve months in each of the fiscal years 2019-20 and 2020-21. During fiscal 2021-22, engineering export growth and manufacturing growth moved in the same direction in seven out of twelve monthswhile in each of fiscal 2022-23 and 2023-24, as many as 10 out of 12 months saw engineering exports and manufacturing output moved in the same direction. In 2024-25, both moved in the same direction in eight out of 12 months.
The first two month of fiscal 2025-26 saw engineering export growth and manufacturing output growth moved in the opposite direction. In April, engineering export growth surged to double digit and manufacturing growth decelerated, while in May engineering export declined and manufacturing output growth inched up over the month. Then, In June, July and August 2025 however, both moved on the same direction.In June and July, both witnessed improvement in growth while in Aug 2025, both conceded moderation in growth. In September 2025 however, engineering growth continued to slowdown but manufacturing growth accelerated.
The link between these two may not be established in one or two months, but a positive correlation may be seen if medium to long term trend is considered.
Table 8: Engineering exports growth vis-à-vis manufacturing growth from April 2024
| Months/ Year | Engg. Export Growth (%) | Manufacturing Growth (%) |
|---|---|---|
| April 2024 | -4.49 | 4.2 |
| May 2024 | 7.43 | 5.1 |
| June 2024 | 10.26 | 3.5 |
| July 2024 | 5.12 | 4.7 |
| August 2024 | 4.28 | 1.2 |
| September 2024 | 10.55 | 4.0 |
| October 2024 | 39.27 | 4.4 |
| November 2024 | 13.72 | 5.5 |
| December 2024 | 8.33 | 3.7 |
| Months/ Year | Engg. Export Growth (%) | Manufacturing Growth (%) |
|---|---|---|
| January 2025 | 7.49 | 5.8 |
| February 2025 | -8.64 | 2.8 |
| March 2025 | -3.92 | 4.0 |
| April 2025 | 11.17 | 3.1 |
| May 2025 | -0.85 | 3.2 |
| June 2025 | 1.28 | 3.7 |
| July 2025 | 13.87 | 6.0 |
| August 2025 | 4.90 | 3.8 |
| September 2025 | 2.93 | 4.8 |
IMPACT OF EXCHANGE RATE ON INDIA’S EXPORTS
How did the exchange rate fare during September 2025 and what was the recent trend in Re-Dollar movement? In order to get a clearer picture of the recent Re-Dollar trend, not only we took the exchange rate of September 2025, but also considered monthly average exchange rate of Rupee vis-à-vis the US Dollar for each month of fiscal2023-24, 2024-25 and fiscal 2025-26 as per the latest data published, as mere one-month figure does not reflect any trend. The following two tables clearly depicts the short-term trend.
Table 9: USD-INR monthly average exchange rate in 2025-26 vis-à-vis 2024-25 (As per latest data released by FBIL)
© Copyright , All rights reserved. Design by Andreal