


VOL. 17, ISSUE NO. 12 | March 2025
Oversight


India’s engineering exports continues to grow for the ninth straight month to January 2025
| Trade Flow | Export figures (in US$ billion) | Growth (%) | ||||
|---|---|---|---|---|---|---|
| Jan-2024 | Jan-2025 | Apr - Jan 2023-24 | Apr - Jan 2024-25 | Jan-2025 over Jan-2024 | Apr-Jan 2024-25 over Apr-Jan 2023-24 | |
| Engineering exports | 8.77 | 9.42 | 88.10 | 96.75 | 7.44% | 9.82% |
| Overall merchandise exports | 37.32 | 36.43 | 353.97 | 358.91 | -2.41% | 1.39% |
| Share of engineering (%) | 23.49% | 25.86% | 24.89% | 26.96% | --- | --- |
| Service Exports | 31.01 | 38.55 | 282.71 | 323.68 | 24.31% | 14.49% |
Source: Compiled from data by DGCI&S and Quick Estimates published by the Government of India.
Indian engineering exports continued its year-on-year growth run for the ninth straight month to January 2025but growth rate moderated slightly to 7.44 percent from 8.32 percent in December 2024 on a year-on-year basis.On a month-on-month basis, exports also declined to USD 9,418.06 million from USD 10,840.55 million in December 2024. Theyear-on-year growth in January 2025 was mainly driven by noticeable growth in exports of Aircraft, spacecraft and parts, Electric Machinery and Equipment, Automobile and auto Components, Industrial Machinery, Prodcuts of Iron and Steel, and Medical and Scientific Instruments. On the other hand,-exports of ‘Ships, Boats and Floating Structures’ conceded sharp fall in year-on-year shipment while ‘Iron and Steel’ also recorded noticeable decline in year-on-year exports during January 2025 like previous month.Among the destination regions, export growth was noted in Sub-Saharan Africa, Latin America, CIS, North America and WANA during January 2025 while exports to South Asia, EU and ASEAN region dropped on a year-on-year basis.
HIGHLIGHTS
- Indian engineering exports continued its growth run for the ninth straight month to January 2025 with marginal deceleration in growth to 7.74 percent as against 8.32 percent in December 2024.
- Engineering exports from India in January 2025 was recorded at USD 9,418.06 million as against USD 8,765.87 million in the same month last year. However, engineering exports was higher at USD 10,840.55 million in December 2024.
- On a cumulative basis also growth in engineering exports continues. Engineering exports during April-January 2024-25 is recorded at USD 96,745.72 million as against USD 88,095.36 million during the same period of the last fiscal, registering an increase of 9.82 percent.
- According to the Quick Estimates of Department of Commerce, Government of India, share of engineering in India’s total merchandise exports was recorded at25.86 percent in January 2025. On a cumulative basis, the sharewas recorded at 26.96 percent during April-January 2024-25.
- In Janaury 2025, 29 out of 34 engineering panels witnessed positive year-on-year growth. While 5 engineering panels including Iron and Steel, Zinc and products, Ships and Boats, and Railway and Transport equipments and parts witness decline in exports during Janaury 2025 vis-à-vis Janaury 2024.
- On a cumulative basis, 27 out of 34 engineering panels recorded positive growth and remaining 7 engineering panels including Iron and Steel, some non-ferrous sectors including Copper, Aluminium and Zinc products, Office Equipment and Mica Products recorded negative growth during April-Janaury 2024-25.
- Region wise, for the first time, North America returned as the number one export destination with a share of 20.2% followed by EU (17.1%) and WANA (16.8%) in January 2025. Significant export growth was noted in South Asia (54%), Other Europe (18.7%), SSA (66.4%), LAC (30.7%) and CIS (34.7%) in January 2025. In cumulative terms, all regions experienced growth barring Oceania (-11.3%)
- Country-wise, USA remained the top destinations followed by UAE and Saudi Arabia in January 2025 while maximum increase was noted in UAE (56%) and South Africa (76%).
- In cumulative terms too USA remained the number one destination. Significant export growth was noted in UAE, Sinagpore, Saudi Arabia, Japan and France.
Overall Engineering Exports vs Engineering Exports Excluding Steel Segment
| Trade Flow | Exports in Jan 2024 / Jan 2025 | Growth (%) | Exports in Apr-Jan 2023-24 / 2024-25 | Growth (%) | ||
|---|---|---|---|---|---|---|
| Jan 2024 | Jan 2025 | Apr-Jan 2023-24 | Apr-Jan 2024-25 | |||
| Overall engineering exports | 8765.87 | 9418.06 | 7.44 | 88095.36 | 96745.72 | 9.82 |
| Engineering exports excluding Iron and Steel | 7730.36 | 8672.37 | 12.19 | 78548.87 | 88993.53 | 13.30 |
OBSERVATIONS: Excluding the export of Iron and Steel, engineering exports recorded a higher year-on-yeargrowth both on a monthly as well as on a cumulative basis as exports of Iron and Steel declined on both estimates. In January 2025,exports of Iron and Steel declined by 28 percent while on a cumulative basis, the decline was 18.8 percent during April-January 2024-25.
ENGINEERING EXPORTS: MONTHLY TREND
The monthly engineering figures for 2024-25 vis-à-vis 2023-24 are shown as per the latest DGCI&S estimates:

| Month | 2023-24 | 2024-25 | Growth (%) |
|---|---|---|---|
| April | 8949.36 | 8547.86 | -4.49 |
| May | 9300.62 | 9991.25 | 7.43 |
| June | 8515.72 | 9389.75 | 10.26 |
| April–June | 26765.71 | 27928.87 | 4.35 |
| July | 8720.30 | 9155.34 | 4.99 |
| August | 9024.65 | 9434.09 | 4.26 |
| September | 8886.54 | 9822.44 | 10.53 |
| July–September | 26655.49 | 28411.87 | 6.59 |
| October | 8078.48 | 11250.85 | 39.27 |
| November | 7822.25 | 8895.52 | 13.72 |
| December | 10007.56 | 10840.55 | 8.32 |
| October–December | 25908.29 | 30986.92 | 19.60 |
| January | 8765.87 | 9418.06 | 7.44 |
| April–January | 88095.36 | 96745.72 | 9.82 |
TOP 25 ENGINEERING EXPORT DESTINATIONS IN JANUARY 2025
We now look at the export scenario of the top 25 nations that had highest demand for Indian engineering products during January 2025 over January 2024 as well as in cumulative terms during April-January 2024-25 vis-à-vis April-January 2023-24. The data clearly shows that top 25 countries contribute 75.2% of total engineering exports.
Table 2: Engineering exports country-wise (Values in US$ million)
| Country | Jan-24 | Jan-25 | Growth (%) | Apr'23 - Jan'24 | Apr'24 - Jan'25 | Growth (%) |
|---|---|---|---|---|---|---|
| U S A | 1375.4 | 1620.5 | 18% | 14382.9 | 15605.6 | 9% |
| UAE | 390.9 | 610.5 | 56% | 4727.4 | 6869.9 | 45% |
| SAUDI ARABIA | 456.1 | 389.6 | -15% | 4036.4 | 4316.0 | 7% |
| SINGAPORE | 179.5 | 169.7 | -5% | 2645.0 | 3935.9 | 49% |
| GERMANY | 333.5 | 358.6 | 8% | 3373.3 | 3492.5 | 4% |
| U K | 371.9 | 347.6 | -7% | 3023.0 | 3258.6 | 8% |
| MEXICO | 226.0 | 272.5 | 21% | 2637.7 | 2945.5 | 12% |
| TURKEY | 185.9 | 215.2 | 16% | 2274.1 | 2664.7 | 17% |
| ITALY | 356.1 | 210.4 | -41% | 3041.4 | 2486.2 | -18% |
| CHINA | 244.4 | 240.8 | -1% | 3141.1 | 2747.0 | -13% |
| KOREA RP | 201.5 | 189.5 | -6% | 2205.3 | 2108.9 | -4% |
| SOUTH AFRICA | 139.9 | 246.0 | 76% | 1793.3 | 2108.4 | 18% |
| FRANCE | 150.4 | 203.0 | 35% | 1680.9 | 2017.2 | 20% |
| JAPAN | 166.6 | 230.9 | 39% | 1548.0 | 1987.0 | 28% |
| NEPAL | 146.5 | 185.5 | 27% | 1733.9 | 1966.4 | 13% |
| BRAZIL | 164.2 | 169.9 | 3% | 1682.4 | 1844.8 | 10% |
| BANGLADESH | 154.9 | 189.7 | 22% | 1805.5 | 2075.6 | 15% |
| INDONESIA | 131.2 | 130.9 | 0% | 2079.3 | 1685.8 | -19% |
| THAILAND | 153.5 | 170.2 | 11% | 1548.9 | 1655.0 | 7% |
| NETHERLAND | 126.0 | 163.4 | 30% | 1403.0 | 1580.5 | 13% |
| MALAYSIA | 159.4 | 94.0 | -41% | 1629.0 | 1250.5 | -23% |
| VIETNAM SOC REP | 126.0 | 104.5 | -17% | 1010.1 | 1197.0 | 19% |
| SPAIN | 125.5 | 120.5 | -4% | 1239.7 | 1190.9 | -4% |
| BELGIUM | 185.7 | 95.8 | -48% | 1372.4 | 1155.4 | -16% |
| RUSSIA | 88.8 | 81.7 | -8% | 1104.0 | 1040.9 | -6% |
| Total engineering exports to the top 25 countries | 6369.4 | 6795.8 | 6.70% | 66303.1 | 72785.9 | 9.78% |
| India’s total engineering exports | 8765.9 | 9418.1 | 7.44% | 88095.4 | 96745.7 | 9.82% |
| Share % of Top 25 destinations | 72.7% | 72.2% | 75.3% | 75.2% |
Source: DGCI&S
REGION WISE INDIA’S ENGINEERING EXPORTS
The following table depicts region wise India’s engineering exports for April-January 2025 as compared to April-January 2024
Table 3: Region wise engineering exports in April-January 2024-25 vis-à-vis April-January 2023-24
| Region | Jan-24 | Jan-25 | Growth (%) | Apr'23 - Jan'24 | Apr'24 - Jan'25 | Growth (%) |
|---|---|---|---|---|---|---|
| NORTH AMERICA | 1703.4 | 1994.5 | 17.1% | 17994.7 | 19567.1 | 8.7% |
| EUROPEAN UNION | 1787.4 | 1583.2 | -11.4% | 16216.8 | 16561.9 | 2.1% |
| WANA | 1272.6 | 1472.3 | 15.7% | 13038.1 | 16269.2 | 24.8% |
| ASEAN | 802.4 | 735.8 | -8.3% | 9583.1 | 10518.1 | 9.8% |
| SSA (Sub Saharan Africa) | 564.4 | 939.0 | 66.4% | 6564.0 | 7203.6 | 9.7% |
| N E ASIA | 683.8 | 735.8 | 7.6% | 6645.4 | 7153.1 | 7.6% |
| OTHER EUROPE | 592.9 | 594.4 | 0.3% | 5590.5 | 6295.6 | 12.6% |
| SOUTH ASIA | 717.1 | 541.9 | -24.4% | 5082.5 | 5338.0 | 5.0% |
| LATIN AMERICA | 420.5 | 549.5 | 30.7% | 4741.8 | 5118.2 | 7.9% |
| CIS | 113.7 | 153.2 | 34.7% | 1340.2 | 1533.5 | 14.4% |
| OCEANIA | 106.7 | 107.7 | 0.9% | 1277.9 | 1136.4 | -11.3% |
| OTHERS | 1.0 | 10.8 | 987.1% | 20.5 | 52.2 | 154.7% |
| Grand Total | 8765.9 | 9418.1 | 7.4% | 88095.4 | 96745.7 | 9.8% |
Source: DGCI&S
Note: Myanmar has been included in ASEAN and not in South Asia, since ASEAN is a formal economic grouping.
Figure 1: Region-wise shares of India’s engineering exports during April-January 2024-25
PANEL WISE INDIA’S ENGINEERING EXPORTS
In this section we look at the Engineering Panel wise exports for the month of January 2025 vis-à-vis January 2024 as well as the cumulative exports for April-January 2024-25 vis-à-vis April-January 2023-24. These are indicated in the tables below.
Table 4: Panel-wise Export Analysis for April-January 2024-25 vis-à-vis April-January2023-24
| Product Panels | January 2024 | January 2025 | Growth (%) | Apr-Jan 2023-24 | Apr-Jan 2024-25 | Growth (%) |
|---|---|---|---|---|---|---|
| Ferrous | ||||||
| Iron and Steel | 1035.5 | 745.7 | -28% | 9516.5 | 7752.2 | -19% |
| Products of Iron and Steel | 760.7 | 836.1 | 10% | 8230.2 | 8902.7 | 8% |
| Sub Total | 1796.2 | 1581.8 | -12% | 17756.7 | 16654.9 | -6% |
| Non-Ferrous | ||||||
| Copper and products | 187.2 | 227.9 | 22% | 2058.0 | 1943.7 | -6% |
| Aluminium and products | 574.2 | 556.6 | -3% | 5928.5 | 5740.0 | -3% |
| Zinc and products | 62.0 | 48.2 | -22% | 638.0 | 472.2 | -26% |
| Nickel and products | 2.4 | 2.4 | 0% | 21.3 | 20.5 | -4% |
| Lead and products | 20.3 | 14.8 | -27% | 161.7 | 142.1 | -12% |
| Tin and products | 1.5 | 1.3 | -13% | 10.7 | 13.5 | 26% |
| Other Non-Ferrous Metals | 106.3 | 188.5 | 77% | 1165.4 | 1636.1 | 40% |
| Sub Total | 953.5 | 1039.1 | 9% | 9984.7 | 9930.1 | -1% |
| Industrial Machinery | ||||||
| Industrial Machinery like Boilers, parts etc. | 49.9 | 63.8 | 28% | 833.0 | 678.3 | -19% |
| IC Engines and Parts | 278.5 | 325.1 | 17% | 2945.7 | 3095.2 | 5% |
| Air Conditioners and Parts | 74.4 | 82.3 | 11% | 811.4 | 865.2 | 7% |
| Industrial Machinery for dairy, food processing, textiles etc. | 246.6 | 262.5 | 6% | 2676.4 | 2855.7 | 7% |
| Machine Tools | 65.8 | 65.3 | -1% | 688.2 | 712.4 | 4% |
| Machinery for injecting moulding, valves and ATMs | 200.8 | 251.5 | 25% | 2101.4 | 2310.1 | 10% |
| Sub Total | 1342.3 | 1450.4 | 8% | 11056.1 | 11516.9 | 4% |
| Electrical Machinery | ||||||
| Electrical Machinery | 1034.8 | 1183.1 | 14% | 10198.4 | 11787.2 | 16% |
| Automobile and Auto Components | ||||||
| Motor Vehicles | 577.9 | 689.3 | 19% | 6923.8 | 7383.8 | 7% |
| Two and Three Wheelers | 110.4 | 122.7 | 11% | 1101.2 | 1324.1 | 20% |
| Auto Components/Parts | 360.6 | 424.3 | 18% | 3744.5 | 3963.7 | 6% |
| Auto Tyres and Tubes | 14.4 | 25.7 | 79% | 121.5 | 146.1 | 20% |
| Sub Total | 1063.3 | 1262.0 | 19% | 9890.9 | 10817.7 | 9% |
| Aircrafts and Related Products | ||||||
| Aircrafts and Spacecraft parts and products | 395.8 | 611.8 | 55% | 1146.0 | 6370.4 | 456% |
| Ships Boats and Floating products and parts | ||||||
| Ships Boats and Floating products and parts | 3.4 | 955 | 27505% | 345.0 | 3820.1 | 1007% |
| Miscellaneous Engineering Products | ||||||
| Medical and Scientific Instruments | 185.9 | 224.5 | 21% | 1994.9 | 2291.0 | 15% |
| Railway Transport | 29.8 | 24.3 | -18% | 272.8 | 306.3 | 12% |
| Hand Tools & Cutting Tools | 78.9 | 88.4 | 12% | 884.0 | 983.3 | 11% |
| Bicycle & Parts | 26.5 | 37.0 | 39% | 306.2 | 342.7 | 11% |
| Cranes Lifts & Winches | 13.2 | 17.7 | 34% | 266.6 | 239.6 | -10% |
| Office Equipment | 3.2 | 5.4 | 69% | 35.3 | 47.2 | 34% |
| Other Construction Machinery | 123.3 | 137.9 | 12% | 1205.7 | 1323.6 | 10% |
| Prime Mica & Mica Products | 2.3 | 3.0 | 28% | 31.1 | 25.9 | -17% |
| Project Goods | 0.0 | 0.0 | 0% | 0.0 | 0.0 | 0% |
| Other Rubber Products Except Footwear | 135.1 | 152.2 | 13% | 1374.3 | 1568.3 | 14% |
| Other Misc. Items | 346.5 | 422.1 | 22% | 3784.1 | 4096.2 | 8% |
| Total Engineering Exports | 8765.9 | 9418.1 | 7.44% | 88095.4 | 96745.7 | 9.82% |
Reasons for Decline (As per April-January 2024-25):
1. Iron and Steel : Insights
- During April-January 2024-25, India’s exports of Iron and Steel deteriorated by 19% vis-à-vis same period last fiscal, while Products of Iron and Steel saw growth for the fourth consecutive month to the extent of 3% during the same period, after continuous decline for many months.
- Market expectations suggest increased buyer activity in the final fiscal month due to budget utilization, while distributors are likely to keep inventories lean. Consequently, prices are expected to still be stable.
- In the HRC trade segment, HRC prices in India were stable. Weak demand hindered transactions, the market resisted higher values, and ample supply was available. HRC prices remained stable week-on-week at INR 47,400-49,500/t ($547-571/t), with Mumbai’s tags at INR 48,500/t ($560/t). An ongoing anti-dumping investigation into Vietnamese steel imports has failed to rouse market participants, with traders noting this as the slowest Q4 they have ever seen.
- Indian HRC export offers to the Middle East remained range-bound at $525-530/t CFR UAE, while Chinese offers dropped to $500-505/t CFR UAE, leading to limited trading activities for Indian mills. Exports to Europe remained slow due to ongoing anti-dumping investigations, with offers stuck at $590-595/t CFR Antwerp. However, there is hope that momentum may pick up after the investigation outcomes are announced in mid March.HRC prices in USA showed slight upward movement, with recovery expected from new trade protection measures.
- Overall, uncertainty prevails in the market, with no significant easing of the downtrend in sight. Concerns are growing over the impact of a 25% US steel import tariff and the potential redirection of surplus material. India’s export opportunities may shrink due to increased competition, and the nation has turned a net importer for the first time since 2015, driven by mounting Chinese steel exports. The market is eagerly awaiting news related to the proposed safeguard duty and assessing the impact of the US tariff on the domestic market, with stainless steel producers particularly apprehensive. (Source: BigMint).
2. Non- Ferrous Sector (Zinc and its products)
The decline has been mainly triggered by decline in exports to UAE (-16.3%)Taiwan (-31.3%). As per latest reports, there is a global oversupply of Zinc which has also affected its global prices.
3. Ships, boats and floating strcutures
The decline in India’s exports of ships, boats and floating structure is due to the decline in exports to Sinagpore (-30.4%) and UAE (-64.8%) and Sri Lanka (-100%). Given that both Singapore and UAE are used excetnsively as transit hubs, many ships and boats from these countries come to India and avail the services of Indian shipbreaking and servicing industry. These may lead to significant re-export which may add to actual export figures from India. Therefore there is volatility in this data and the declining trend may reverse in the next month depending on the ships from those countries availing India’s shipbreaking or maintenance services. In terms of Sri Lanka, there has been a decline in overall imports in this category.
ENGINEERING EXPORTS STATE-WISE ANALYSIS
State wise engineering export performance
The table below indicates the exports from top Indian states. It is clear from the table that almost 94.7 % of India’s exports is contributed by the listed 12 states. Within this, almost 56.5 percent of exports is done by Maharashtra, Tamil Nadu and Gujarat together.
Table 5:Top state wise engineering export performance – April-December 2024-25(Values in USD Million)
| Top States | April–December 2023–24 | April–December 2024–25 | Growth % | % Share in India’s Eng Export | Remarks |
|---|---|---|---|---|---|
| Maharashtra | 16907.0 | 16570.0 | -2.0% | 22.1% | 94.7% share covered by top 12 states |
| Tamil Nadu | 12586.9 | 13340.9 | 6.0% | 17.8% | |
| Gujarat | 10703.9 | 12472.9 | 16.5% | 16.6% | |
| Telangana | 1703.7 | 6191.6 | 263.4% | 8.3% | |
| Karnataka | 4958.1 | 5270.7 | 6.3% | 7.0% | |
| Odisha | 4910.7 | 4407.2 | -10.3% | 5.9% | |
| Andhra Pradesh | 3671.9 | 3510.7 | -4.4% | 4.7% | |
| Uttar Pradesh | 3102.2 | 3211.1 | 3.5% | 4.3% | |
| West Bengal | 2349.3 | 2592.5 | 10.4% | 3.5% | |
| Madhya Pradesh | 1368.8 | 1448.2 | 5.8% | 1.9% | |
| Rajasthan | 2414.2 | 1046.5 | -56.7% | 1.4% | |
| Daman & Diu And Dadra & Nagar Haveli | 1108.1 | 938.5 | -15.3% | 1.3% |
Source: NIRYAT portal
- Top 12 states constitute over 94.7 % of India’s engineering Exports. Once again, Karnataka maintained its 5th position, Telengana retained its 4th position, Odisha maintaining its 6th position,while Daman and Diu moved up to 12th position and Haryana moved further down to 13th position during the fiscal April-December 2024-25 compared to the same period last fiscal.
- Major negative growth witnessed in states like Maharashtra, Odisha, Andhra Pradesh, Rajasthan and Daman and Diu during April-Dec 2024-25 compared to the same period last fiscal.
- Maharashtra being the highest state in terms of Engineering Goods exports ( constituting a share of 22.1%) is leading by US$ 3229.1 million from Tamil Nadu(Second Highest State) for the period of April
INDIA’S REGION WISE ENGINEERING EXPORTS
In terms of region, western region which includes industrial states like Maharashtra and Gujarat is the front runner in terms of exports with 38.7 percent share. Tamil Nadu from the Southern Region has retained its export performance and it ranked second after Maharashtra, while Gujarat and Telengana ranked third and fourth during April-December 2024-25.
Note: The total engineering exports given in the above table is taken from NIRYAT as per the latest available data and may not tally with the total engineering exports as given by DGCI&S.(Data sourced from Niryat portal. It is to be noted that state figures for January 2025 not yet updated)
| Region | April-Dec 2023-24 |
April-Dec 2024-25 |
Growth% |
|---|---|---|---|
| EASTERN REGION | 8651.2 | 8282.5 | -4.3% |
| NORTHERN REGION | 16713.3 | 5920.1 | -64.6% |
| SOUTHERN REGION | 23784.5 | 29053.9 | 22.2% |
| WESTERN REGION | 30350.6 | 31734.5 | 4.6% |
CORRELATION BETWEEN MANUFACTURING PRODUCTION AND ENGINEERING EXPORTS
Engineering forms a considerable part of the broader manufacturing sector and the share of engineering production in overall manufacturing output is quite significant. As exports generally come from what is produced within a country, some correlation between manufacturing production growth and engineering export growth should exist. We briefly look at the trend in manufacturing growth as also engineering export growth to see if they move in tandem. It may be mentioned that manufacturing has 77.63% weightage in India’s industrial production.
Engineering export growth and manufacturing output growth moved in the same direction in as many as nine out of twelve months in each of the fiscal years 2019-20 and 2020-21. During fiscal 2021- 22, engineering export growth and manufacturing growth moved in the same direction in seven out of twelve monthswhile in each of fiscal 2022-23 and 2023-24, as many as10 out of 12 months saw engineering exports and manufacturing output moved in the same direction.
The first two months of fiscal 2024-25 also saw manufacturing output growth and engineering exports growth moving in the same direction. April 2024 saw engineering exports declined from a growth in Mar 2024 and manufacturing output growth decelerated. The month of May 2024 witnessed just the opposite. Engineering exports bounced back to growth path and manufacturing output growth accelerated. Then June, July and August2024 however saw both moved in the opposite direction. June and August 2024 saw higher engineering export growth but lower manufacturing growth in comparison to the previous month while July 2024 just witnessed the reverse. September and October 2024 again saw both moving in the same direction by securing acceleration in growth. November 2024 however saw slowdown in engineering export growth but faster manufacturing growth vis-à-vis October 2024 while growth in both engineering exoports and manufacturing output moderated in December 2024.
The link between these two may not be established monthly, but a positive correlation may be seen if medium to long term trend is considered.
Table 7: Engineering exports growth vis-à-vis manufacturing growth from April 2022
| Months/Year | Engg. Export Growth (%) | Manufacturing Growth (%) |
|---|---|---|
| April 2023 | -7.52 | 5.5 |
| May 2023 | -4.25 | 6.3 |
| June 2023 | -11.12 | 3.5 |
| July 2023 | -6.91 | 5.3 |
| August 2023 | 7.66 | 10.0 |
| September 2023 | 6.50 | 5.1 |
| October 2023 | 6.99 | 10.6 |
| November 2023 | -3.48 | 1.3 |
| December 2023 | 9.82 | 3.6 |
| January 2024 | 4.20 | 3.6 |
| February 2024 | 15.90 | 4.9 |
| March 2024 | 10.66 | 5.9 |
| April 2024 | -4.49 | 4.2 |
| May 2024 | 7.43 | 5.1 |
| June 2024 | 10.26 | 3.5 |
| July 2024 | 4.99 | 4.7 |
| August 2024 | 4.26 | 1.2 |
| September 2024 | 10.53 | 4.0 |
| October 2024 | 39.27 | 4.4 |
| November 2024 | 13.72 | 5.5 |
| December 2024 | 8.32 | 3.0 |
(Source: Department of Commerce and CSO)

How did the exchange rate fare during December 2024 and what was the recent trend in Re-Dollar movement? In order to get a clearer picture of the recent Re-Dollar trend, not only we took the exchange rate of December 2024, but also considered monthly average exchange rate of Rupee vis-à-vis the US Dollar for each month of fiscal 2023-24 and 2024-25 till October 2024 as per the latest data published, as mere one-month figure does not reflect any trend. The following two tables clearly depicts the short-term trend:
Table 8: USD-INR monthly average exchange rate in 2024-25 vis-à-vis 2023-24(As per latest data released by FBIL)
| Monthly Average Exchange Rate (1 USD to INR) |
Year-on-Year Change (%) |
Month-on-Month Change (%) |
||||
|---|---|---|---|---|---|---|
| Month | 2023-24 | 2024-25 | Change (%) | Direction | Change (%) | Direction |
| April | 82.02 | 83.41 | 1.69 | Depreciation | 0.49 | Depreciation |
| May | 82.34 | 83.39 | 1.28 | Depreciation | -0.02 | Appreciation |
| June | 82.23 | 83.47 | 1.51 | Depreciation | 0.10 | Depreciation |
| July | 82.15 | 83.59 | 1.75 | Depreciation | -0.36 | Depreciation |
| August | 82.79 | 83.89 | 1.33 | Depreciation | 0.36 | Depreciation |
| September | 83.03 | 83.81 | 0.92 | Depreciation | -0.10 | Appreciation |
| October | 83.24 | 84.02 | 0.94 | Depreciation | 0.25 | Depreciation |
| November | 83.80 | 84.36 | 1.27 | Depreciation | 0.40 | Depreciation |
| December | 83.28 | 84.99 | 2.05 | Depreciation | 0.75 | Depreciation |
| January | 83.14 | 86.27 | 3.76 | Depreciation | 1.51 | Depreciation |
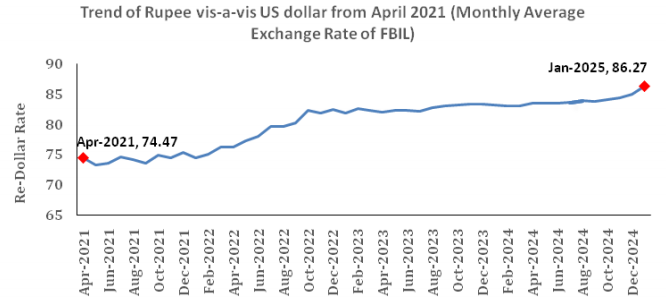
Indian Rupee depreciated further in January 2025: INR depreciated by 3.76 percent year-on-year in January 2025 over the US Dollar. On a month-on-month basis, the depreciation was 1.51 percent. The reasons were manifold including rising crude oil prices, a surge in the dollar index after the US Federal Reserve hinted at fewer rate cuts in 2025, India’s sluggish growth rate of late, and foreign investor outflows from equities. RBI intervention in the spot market however arrested further fall of rupee.
Rupee in 2024: The Indian Rupee faced continuous depreciation vis-a-vis the US dollar and eached its lifetime low below 85 level in 2024. As per Reuters, Rupee has conceded seventh straight year of depreciation against the greenback in as it ended the year 2024 with a 2.8% drop. While the reasons behind strengthening of US Dollar in 2024 were manifold including US Fed’s measured approach on rate cuts and victory of Donald Trump as US President in the last quarter of 2024, the Indian currency fared better than many of its Asian peers that declined between 3% and 12% vis-à-vis the US Dollar.
Outlook: The weakening of rupee vis-à-vis the US Dollar is apprehended to persist at least in the first few months of 2025 in absence of any new turn in global economic direction.

Table 9: USD-INR monthly average exchange rate in 2023-24 vis-à-vis 2022-23(As per latest data released by FBIL)
| Monthly Average Exchange Rate (1 USD to INR) |
Year-on-Year Change (%) |
Month-on-Month Change (%) |
||||
|---|---|---|---|---|---|---|
| Month | 2022-23 | 2023-24 | Change (%) | Direction | Change (%) | Direction |
| April | 76.17 | 82.02 | 7.68 | Depreciation | -0.33 | Appreciation |
| May | 77.32 | 82.34 | 6.49 | Depreciation | 0.39 | Depreciation |
| June | 78.04 | 82.23 | 5.37 | Depreciation | -0.13 | Depreciation |
| July | 79.60 | 82.15 | 3.20 | Depreciation | -0.10 | Appreciation |
| August | 79.56 | 82.79 | 4.06 | Depreciation | 0.78 | Depreciation |
| September | 80.23 | 83.04 | 3.50 | Depreciation | 0.30 | Depreciation |
| October | 82.34 | 83.24 | 1.09 | Depreciation | 0.24 | Depreciation |
| November | 81.81 | 83.30 | 1.82 | Depreciation | 0.07 | Depreciation |
| December | 82.46 | 83.28 | 0.99 | Depreciation | -0.02 | Appreciation |
| January | 81.90 | 83.12 | 1.49 | Depreciation | -0.19 | Appreciation |
| February | 82.61 | 83.69 | 1.30 | Depreciation | 0.69 | Depreciation |
| March | 82.29 | 83.00 | 0.86 | Depreciation | 0.05 | Depreciation |
Fig 2: Trend of Rupee vis-a-vis US dollar from April 2020(Monthly Average Rate of FBIL has been considered)

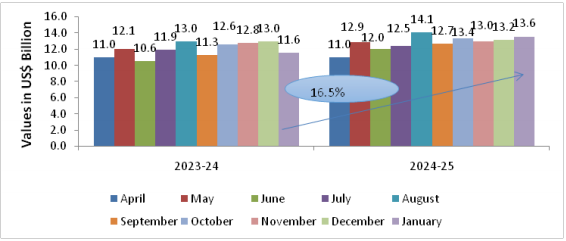
India’s Engineering imports during January 2025 were valued at US$13551.80million compared to US$ 11629.08 million in January 2024 registering a positive growth of 16.5 percent in dollar terms. All the sectors witnessed a rise in import during January 2025 compared to January 2024 registering positive growth over the same period.
The share of engineering imports in India’s total merchandise imports in January 2025 was estimated at 22.8 percent, higher than that of January 2024 which was estimated at 21.6 %. The figure below depicts engineering imports for January 2025 compared to January 2024.
Table 10: India’s engineering imports in April-January 2024-25 vis-à-vis April-January 2023-24
| Values in US$ MN | January '23 | January '24 | Growth (%) | April–December 2023 | April–December 2024 | Growth (%) |
|---|---|---|---|---|---|---|
| India's Engineering Imports | 11629.08 | 13551.80 | 16.5% | 119989.5 | 128321.3 | 6.9% |
Fig 3: Monthly Engineering Imports for April-January 2024-25 vis-a-vis April-January 2023-24
TREND IN ENGINEERING TRADE BALANCE
We now present the trend in two-way yearly trade for the engineering sector for the 2024-25 depicted in the table below:
Table 11: Monthly Trend in Engineering Trade Balance for the current FY 2024-25(US$ Billions)
| Trade Flow | Apr | May | June | July | August | September | October | November | December | January |
|---|---|---|---|---|---|---|---|---|---|---|
| Engineering Export | 8.7 | 10.0 | 9.4 | 9.0 | 9.4 | 9.8 | 11.2 | 8.9 | 10.8 | 9.4 |
| Engineering Import | 11.0 | 12.9 | 12.0 | 12.5 | 14.1 | 12.7 | 13.4 | 13.0 | 13.2 | 13.6 |
| Trade Balance | -2.3 | -2.9 | -2.6 | -3.5 | -4.7 | -2.9 | -2.2 | -4.1 | -2.4 | -4.2 |
Source: DGCI&S, EEPC India Analysis
CONCLUSION
Indian engineering industry continued its growth run for last nine months clocking around 10% growth in cumulative terms that is in April-January 2025. The growth in engineering exports surpassed that of the total mercahandise exports which clocked on 1.39% between April-January 2025. Infact in January 2025, India’s engineering exports grew by more than 7% while India’s merchandise exports fell down by more than 2%. This achievement by the industry was possible at a time when the exporting community is facing a significant global turmoil in the form of continuing conflicts and increasing protectionism by some of our major export destinations. The growth has been led by significant increase in exports of Aircraft, spacecraft and parts, Electric Machinery and Equipment, Automobile and auto Components, Industrial Machinery, Products of Iron and Steel, and Medical and Scientific Instruments. In terms of destinations apart from the traditional ones including North America and EU, WANA is also significant. Additonally SSA and LAC regions are also gaining significance in terms of export destination.
Global exports is also at the cross road of major changes – with new geopolitical challenges, trade policies worldwide are evolving to address national concerns but they are putting unprecedented pressure on businesses. In 2024 alone, over 3,000 trade restrictions were implemented globally. While the challenges to the multilateral trading system are not new, they are intensifying, with a significant risk of further erosion as per the Global Trade Outlook 2025 published by the International Chamber of Commerce (ICC).
Given the above scenario, the engineering industry is going to face significant challenges in the coming days – the latest US tariffs are case in point. In this situation, the industry would need continuous government support in the fields of export credit and technology to remain competitive in the global market.

ANNEXURE-I
ENGINEERING PRODUCT PANELS – COUNTRY-WISE ANALYSIS
We now analyze the performance of some of the important products for the fiscal April-January 2024-25 vis-à-vis April-January 2023-24. We have taken the major panels and computed the top importers to get an idea of the current trade pattern
Engineering Product Panel - Country matrix(US$ Billions)
| Product panels | Top 5 nations | April- January 2023-24 | April- January 2024-25 | Growth |
|---|---|---|---|---|
| Iron and Steel | ITALY | 1461.1 | 903.5 | -38% |
| NEPAL | 668.9 | 647.6 | -3% | |
| UAE | 53.7 | 81.5 | 52% | |
| USA | 422.1 | 458.7 | 9% | |
| UK | 317.0 | 449.3 | 42% | |
| Products of Iron and Steel | USA | 2290.6 | 2290.3 | 0% |
| UAE | 473.9 | 678.5 | 43% | |
| SAUDI ARAB | 53.6 | 77.0 | 44% | |
| GERMANY | 386.3 | 381.4 | -1% | |
| UK | 289.3 | 283.4 | -2% | |
| Industrial Machinery | USA | 920.9 | 1116.6 | 21% |
| UAE | 558.7 | 677.8 | 21% | |
| GERMANY | 840.5 | 728.2 | -13% | |
| CHINA | 574.6 | 717.4 | 25% | |
| THAILAND | 663.2 | 518.1 | -22% | |
| Automobiles (Motor Vehicles/Cars and Two and Three Wheelers) |
SAUDI ARAB | 1399.1 | 1286.6 | -8% |
| SOUTH AFRICA | 1120.3 | 1351.0 | 21% | |
| MEXICO | 975.7 | 1221.7 | 25% | |
| JAPAN | 180.6 | 651.1 | 261% | |
| UAE | 448.9 | 598.4 | 33% | |
| Non-Ferrous metals | USA | 1205.0 | 1225.4 | 2% |
| KOREA RP | 979.2 | 806.9 | -18% | |
| TURKEY | 157.5 | 686.5 | 323% | |
| SAUDI ARAB | 965.3 | 637.1 | -34% | |
| CHINA | 500.6 | 511.3 | 2% | |
| Electrical Machinery and Components | USA | 1906.2 | 2225.9 | 17% |
| SINGAPORE | 823.6 | 1297.2 | 57% | |
| UK | 861.5 | 923.9 | 7% | |
| GERMANY | 609.3 | 800.8 | 31% | |
| KOREA RP | 382.0 | 528.3 | 38% | |
| Aircrafts and Space crafts | UAE | 225.0 | 1562.8 | 590% |
| SAUDI ARAB | 111.6 | 1113.7 | 898% | |
| FRANCE | 165.5 | 671.5 | 300% | |
| USA | 400.9 | 369.6 | -8% | |
| CZECH REPUBLIC | 3.7 | 310.0 | 8174% | |
| Ships, Boats and Floating Structures and parts | SINGAPORE | 780.5 | 1695.2 | 117% |
| UAE | 830.2 | 882.2 | 6% | |
| INDONESIA | 559.5 | 306.4 | -45% | |
| USA | 52.9 | 251.5 | 376% | |
| SRI LANKA | 327.0 | 233.6 | -29% | |
| Auto Components (including Auto Parts and Auto Tyre) | USA | 1949.7 | 1950.6 | 0% |
| BRAZIL | 409.8 | 506.8 | 23% | |
| GERMANY | 476.0 | 502.6 | 6% | |
| TURKEY | 473.8 | 407.8 | -14% | |
| MEXICO | 364.4 | 408.6 | 11% |
- In April-January 2024-25, Italy, Nepal and UAE ranked as the top importers of Indian Iron and Steel, while the USA, UAE and Saudi Arabia lead in import of ‘Products of Iron & Steel.’
- The USA stood out as the primary importer of Indian Industrial machinery,’ making up 21% of India’s global exports in this category, followed by UAE 5% and Germany with 4% shares, respectively.
- Saudi Arabia, South Africa, Mexico and Japan were top import ers of India’s Automobiles during April-January 2024-25 in India’s global exports respectively over April- January 2023-24.
- USA, South Korea and Turkey were the top three importers of India’s Non-ferrous metals and products’ during April- January 2024-25 whereas USA, Singapore, UK and Germany were the top importers of Indian Electrical Machinery & Components during the same period
- UAE, Saudi Arabia and France were the top three importers of India’s Aircrafts and Spacecraft during April-January 2024-25 in India’s total global exports of the product followed by USA and Czech Republic.
- Singapore, UAE and Indonesia became the largest importer of ships, boats and floating structures followed by USA and Sri Lanka. While for the auto components’ product group, USA remained the top importer in April-January 2024-25 followed by Brazil, Germany, Turkey and Mexico.
Disclaimer: The analysis in this write-up is prepared by the team at EEPC India. The data used in this write-up is primarily sourced from the DGCI&S database and pertains to products under the purview of EEPC India. Sources are cited where relevant. While every effort has been made to ensure the accuracy and reliability of the data and analysis, EEPC India assumes no responsibility for any errors or decisions based on this information.


© Copyright , All rights reserved. Design by Andreal