


VOL. 17, ISSUE NO. 12 | March 2025
Focus


[Changes in 2025 Proclamations vs. Previous Section 232 Measures Way Forward]
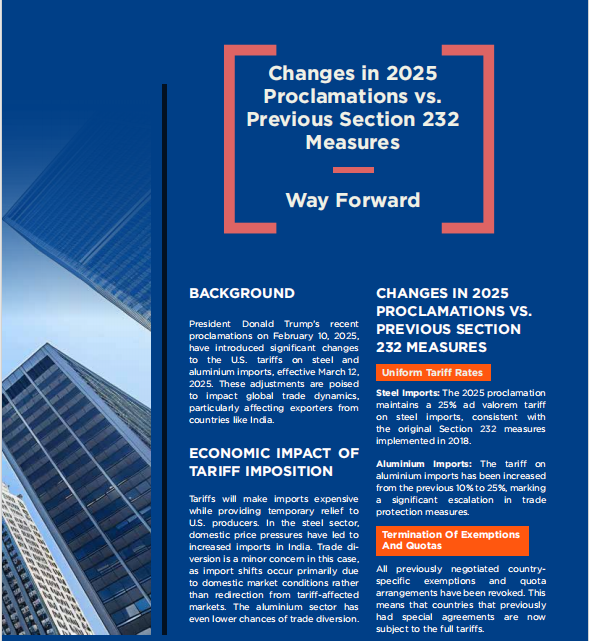
BACKGROUND
President Donald Trump’s recent proclamations on February 10, 2025, have introduced significant changes to the U.S. tariffs on steel and aluminium imports, effective March 12, 2025. These adjustments are poised to impact global trade dynamics, particularly affecting exporters from countries like India.
ECONOMIC IMPACT OF TARIFF IMPOSITION
Tariffs will make imports expensive while providing temporary relief to U.S. producers. In the steel sector, domestic price pressures have led to increased imports in India. Trade diversion is a minor concern in this case, as import shifts occur primarily due to domestic market conditions rather than redirection from tariff-affected markets. The aluminium sector has even lower chances of trade diversion.
CHANGES IN 2025 PROCLAMATIONS VS. PREVIOUS SECTION 232 MEASURES
Expansion to Downstream Products
The scope of the tariffs has been broadened to include derivative steel and aluminium products. This aims to prevent circumvention of tariffs by importing downstream products that contain these metals.
Elimination Of Product Exclusions
The proclamations have terminated all existing General Approved Exclusions (GAEs) and have phased out the specific product exclusion process. This indicates a move towards a more comprehensive application of tariffs without exceptions.

PRODUCT CATEGORIES AFFECTED
The proclamations cover a wide range of steel and aluminium products. Below is a table summarizing the affected product categories along with their descriptions:
| Product Category | Description |
|---|---|
| Steel Articles | Flat-rolled products |
| Long products (bars, rods, and beams) | |
| Pipe and tube products | |
| Stainless steel products | |
| Derivative products such as nails, tacks, and certain fabricated structural components | |
| Aluminium Articles | - Unwrought aluminium (primary aluminium) |
| - Semi-finished products (plates, sheets, strips, and foils) | |
| - Finished products (cans, wires, and cables) | |
| - Derivative products including certain stranded wires, cables, and automotive parts |
These categories encompass a broad spectrum of products, indicating that the tariffs are designed to cover both raw materials and a variety of manufactured goods containing steel and aluminium.
List of Tariff Lines under existing Section 232
| 722300 | 722240 | 722020 | 722220 | 721590 | 721933 | 721934 | 721932 | 721935 | 721129 |
| 722850 | 722211 | 721990 | 722699 | 722611 | 721730 | 721041 | 722830 | 721270 | 721931 |
| 722219 | 722490 | 722990 | 722230 | 722011 | 721699 | 721012 | 721912 | 721012 | 721912 |
| 722810 | 721499 | 721921 | 721650 | 720852 | 721049 | 721100 | 722519 | 721550 | 722860 |
| 721240 | 721230 | 720210 | 721710 | 720851 | 720719 | 721123 | 721889 | 722540 | 722540 |
| 720915 | 720690 | 720825 | 720890 | 721220 | 720720 | 721922 | 722692 | 721391 |
List of New Tariff Lines as per Proclamation on Adjusting Imports of Steel into the United States (Published in Presidential Document dated 18th Feb 2025)
| 730120 | 730230 | 730721 | 730722 | 730723 | 730729 | 730791 | 730792 | 730793 | 730799 |
| 730810 | 730820 | 730830 | 730840 | 730890 | 730900 | 731010 | 731021 | 731029 | 731100 |
| 731210 | 731290 | 731300 | 731412 | 731411 | 731419 | 731420 | 731431 | 731439 | 731441 |
| 731442 | 731449 | 731450 | 731511 | 731512 | 731519 | 731520 | 731581 | 731582 | 731589 |
| 731590 | 731600 | 731700 | 731811 | 731812 | 731813 | 731814 | 731815 | 731816 | 731819 |
| 731821 | 731822 | 731823 | 731824 | 731829 | 731940 | 731990 | 732020 | 732090 | 732090 |
| 732111 | 732112 | 732119 | 732181 | 732182 | 732189 | 732190 | 732219 | 732290 | 732310 |
| 732393 | 732394 |
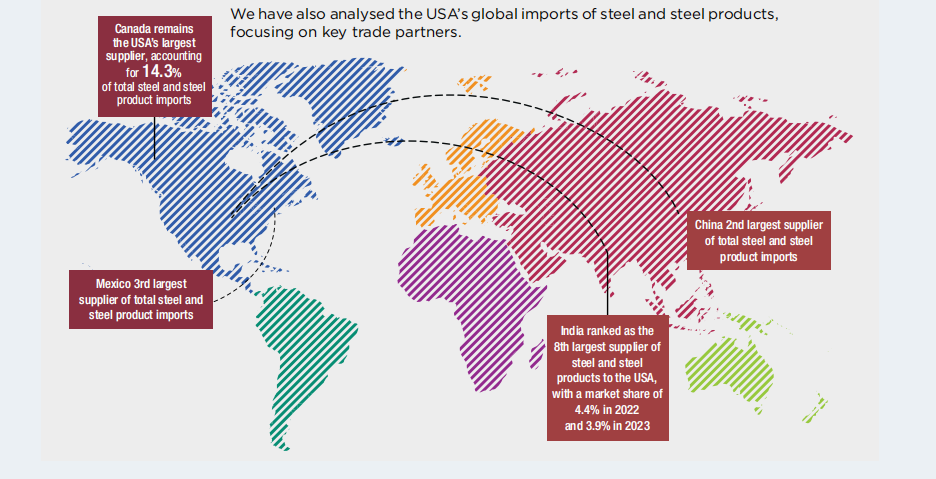
The following table provides a detailed overview of the USA’s global imports of steel and steel products from key trade partners, including India.
| Exporters | 2021 | 2022 | 2023 | Growth% | Share % in 2022 | Share % in 2023 |
|---|---|---|---|---|---|---|
| World | 86.8 | 106.1 | 86.4 | -19% | ||
| Canada | 14.0 | 15.7 | 14.3 | -9% | 14.8% | 16.6% |
| China | 16.0 | 17.6 | 12.3 | -30% | 16.6% | 14.3% |
| Mexico | 11.2 | 13.9 | 11.6 | -16% | 13.1% | 13.4% |
| Korea, Republic of | 4.4 | 6.6 | 5.4 | -18% | 6.2% | 6.2% |
| Brazil | 4.4 | 4.7 | 5.0 | 6% | 4.4% | 5.7% |
| Taipei, Chinese | 5.0 | 6.9 | 4.4 | -36% | 6.5% | 5.1% |
| Germany | 2.7 | 3.7 | 4.1 | 10% | 3.5% | 4.7% |
| India | 2.8 | 4.6 | 3.4 | -27% | 4.4% | 3.9% |
| Japan | 2.8 | 3.4 | 3.3 | -4% | 3.2% | 3.8% |
| Italy | 1.4 | 2.2 | 2.5 | 14% | 2.0% | 2.8% |
| Viet Nam | 2.0 | 2.6 | 1.7 | -33% | 2.5% | 2.0% |
| Thailand | 1.4 | 2.0 | 1.6 | -20% | 1.9% | 1.8% |
| United Kingdom | 1.2 | 1.6 | 1.1 | -31% | 1.5% | 1.3% |
| Spain | 0.7 | 1.1 | 1.1 | 3% | 1.0% | 1.3% |
The following table provides a detailed overview of the USA’s global imports of steel and steel products from key trade partners, including India.
| Exporters | 2021 | 2022 | 2023 | Growth% | Share % in 2022 | Share % in 2023 |
|---|---|---|---|---|---|---|
| Netherlands | 1.0 | 1.2 | 1.1 | -12% | 1.2% | 1.3% |
| Austria | 0.7 | 1.1 | 1.1 | -7% | 1.1% | 1.2% |
| France | 0.7 | 1.0 | 1.0 | 4% | 0.9% | 1.2% |
| Sweden | 0.7 | 1.0 | 0.9 | -9% | 1.0% | 1.1% |
| Türkiye | 1.3 | 1.7 | 0.8 | -54% | 1.6% | 0.9% |
| Ukraine | 1.2 | 0.7 | 0.7 | 7% | 0.6% | 0.8% |
| Malaysia | 0.6 | 1.0 | 0.6 | -39% | 1.0% | 0.7% |
POTENTIAL IMPACT OF A 25% TARIFF ON STEEL AND STEEL PRODUCTS EXPORTS TO THE USA
The extension of Section 232 tariffs to Chapter 73 steel products at 25% with no exclusions will severely impact India’s steel product exports. It will lead to higher costs, loss of competitiveness, and reduced market access in the U.S. Value in US$ million
| Product Categories under Section 232 (A) | Tariff | India’s Exports to USA | USA’s Import from World | India’s Share % | ||||||||
|---|---|---|---|---|---|---|---|---|---|---|---|---|
| 2019 | 2020 | 2021 | 2022 | CAGR | 2019 | 2020 | 2021 | 2022 | CAGR | |||
| Steel Tariff lines under Ch 72 | ||||||||||||
| Flat-Rolled Products | 25% | 20.2 | 18.8 | 118.6 | 203.9 | 40.5% | 6184.7 | 5142.2 | 10071.8 | 12950.8 | 10.4% | 1.0% |
| Ingots/ Semi-Finished Products | 25% | 11.7 | 0.2 | 0.0 | 0.4 | -56.1% | 68.7 | 41.1 | 31.5 | 233.0 | 23.3% | 33.6% |
| Long Prod. Bars, Rods, Wire, Angles Etc. | 25% | 119.0 | 99.4 | 230.3 | 291.4 | 10.5% | 4080.4 | 3162.5 | 5230.7 | 7457.2 | 8.7% | 3.6% |
| Primary Forms; Semi-Finished Products | 25% | 0.4 | 0.4 | 0.7 | 0.9 | 21.8% | 1604.7 | 886.9 | 1580.2 | 1773.6 | 4.2% | 0.0% |
| Products of Steel - Tariff lines under Ch 73 | ||||||||||||
| Steel And Steel Products | 25% | 122.3 | 77.0 | 252.0 | 504.6 | 23.9% | 6127.7 | 3717.8 | 6258.3 | 11075.0 | 14.5% | 3.3% |
| Fabricated Steel Structures & Transmission Line Towers | 25% | 0.0 | 0.2 | 0.2 | 0.4 | 72.7% | 83.3 | 66.0 | 74.0 | 135.6 | 14.4% | 0.2% |
| All Types Of Fasteners And Builders Hardware Including Hinges, Door Fittings, Locks, Etc | 2.5% | 0.8 | 0.9 | 3.0 | 1.7 | -21.7% | 47.5 | 48.7 | 41.0 | 45.9 | -1.2% | 4.1% |
| Steel Pipes Tubes And Fittings | 25% | 72.5 | 19.2 | 181.3 | 102.0 | -6.3% | 1099.8 | 296.3 | 303.8 | 564.2 | -1.4% | 7.5% |
| Total | 348.9 | 215.9 | 739.4 | 1154.0 | 12.0% | 19296.8 | 13361.5 | 23591.2 | 34235.4 | 8.0% | 2.5% | |
Source: TradeMap
Observations:
- The recent US proclamation dated February 18, 2025, did not introduce new tariff lines under Chapter 72. Only new tariff lines were added under Chapter 73.
- Earlier under Section 232 the tariff lines included products from both Chapter 72 and Chapter 73.
As per the above table: we have seen the following observations under Section 232 tariff lines:
- Export Growth in Chapter 72: Primary forms, long products, bars, and flat-rolled products experienced export growth to the USA.
- Export Surge in Chapter 73: Fabricated steel structures and other steel products saw a significant increase in exports to the USA.
- Higher Growth Rate: The growth rate of these exports from India surpassed the overall growth in the USA’s global demand for these products.
| Product Categories under Proclamation on adjusting imports of steel published 18th Feb 2025 (B) | Tariff | India’s Exports to USA | USA’s Import from World | India’s Share % | ||||||||
|---|---|---|---|---|---|---|---|---|---|---|---|---|
| 2019 | 2020 | 2021 | 2022 | CAGR | 2019 | 2020 | 2021 | 2022 | CAGR | |||
| All Types Of Fasteners And Builders Hardware Including Hinges, Door Fittings, Locks, etc | 25% | 130.5 | 112.8 | 176.1 | 230.3 | 11.7% | 5852.2 | 5089.5 | 6602.2 | 8571.5 | 6.3% | 2.6% |
| Automobile Parts & Components | 25% | 10.5 | 10.9 | 19.3 | 19.9 | 14.8% | 1189.2 | 992.0 | 1336.0 | 1438.5 | 3.2% | 1.3% |
| Bright Bars And Other Miscellaneous Products | 25% | 137.9 | 143.5 | 190.5 | 175.2 | 3.0% | 3451.5 | 3434.7 | 4578.6 | 4627.1 | 8.0% | 4.0% |
| Fabricated Steel Structures & Transmission Line Towers | 25% | 153.7 | 157.1 | 345.2 | 572.7 | 20.6% | 5430.8 | 5802.7 | 6722.4 | 8960.0 | 14.4% | 6.4% |
| Office Equipment And Similar Products | 25% | 6.6 | 8.3 | 39.1 | 55.4 | 63.8% | 3017.8 | 3196.2 | 4164.2 | 6711.6 | 29.1% | 0.8% |
| Renewable Energy Equipment | 25% | 2.5 | 5.1 | 13.1 | 17.7 | 72.5% | 3995.5 | 4547.6 | 5455.7 | 4016.2 | 0.2% | 0.4% |
| Steel Pipes Tubes And Fittings | 25% | 261.2 | 144.5 | 390.0 | 326.0 | 6.3% | 2224.3 | 1304.2 | 1824.3 | 2618.0 | 4.3% | 12.5% |
| Steel Wire, Wire Products And Cables | 25% | 45.3 | 34.1 | 65.9 | 103.3 | 24.1% | 2553.1 | 2369.1 | 3261.1 | 4327.1 | 8.9% | 2.4% |
| Total | 750.6 | 615.2 | 1098.6 | 1588.4 | 20.6% | 24998.2 | 23922.9 | 31033.2 | 36965.0 | 8.1% | 3.8% | |
Source: TradeMap
Observations: New Tariff Lines (Proclamation dated February 18, 2025)
Export Growth Analysis:
- Growth: India’s exports to the USA have shown growth across all these product categories.
- India’s Share in USA’s Global Imports: Ranges from approximately 2% to 12%.
- Overall, the data indicates a strong performance of Indian exports in these categories, with significant growth in market share in the USA.
- This positive trend suggests that India is effectively navigating its market presence in the USA.
This reflects the competitiveness and resilience of Indian products in the face of new tariff lines.
USA’S DEPENDENCE ON ALUMINIUM IMPORTS
The US depends heavily on aluminium imports. Data from the USGS shows the net import reliance as a percentage of apparent consumption, indicating the proportion of domestic demand met through imports. The data highlights significant dependence on aluminium imports.
| Particulars | 2020 | 2021 | 2022 | 2023 | 2024 |
|---|---|---|---|---|---|
| Net import reliance as a percentage of apparent consumption in the USA | 38% | 40% | 52% | 44% | 47% |
Source: https://pubs.usgs.gov/periodicals/mcs2025/mcs2025-aluminum.pdf
INCREASING INVESTMENT IN RECYCLING OF SCRAPS
The USGS report shows rising investment in recycling scrap in the USA. While primary aluminium production fell, secondary production from new and old scrap increased by 5% compared to 2023. The Indian aluminium industry believes this will not threaten their position in the US market, as domestic production won’t meet demand, ensuring continued imports.
WHO ARE THE END-USERS?
This brings us to the critical question as to who the end-user of aluminium in the USA are. The table indicates the major end-users of aluminium in the US market.
As per a recent report by the International Aluminium Institute, global aluminium demand will increase by almost 40 per cent by 2030 and almost 90% of this demand will come from Asia, North America and Europe. The demand in North America will be driven by the Electric Vehicle sector, renewable energy sector and popularity if canned drinks (packaging). Increasing use of sustainable material in the construction industry will also drive the demand for aluminium.
| End-user category | Share of US Aluminium Consumption |
|---|---|
| Transportation application | 36% |
| Packaging | 23% |
| Building | 14% |
| Electrical | 9% |
| Consumer durables | 8% |
| Others | 2% |
Source: https://pubs.usgs.gov/periodicals/mcs2025/mcs2025-aluminum.pdf
INDIA’S ALUMINIUM EXPORTS TO THE US: BEFORE AND AFTER THE SECTION 232 TARIFFS
India features among the top 10 suppliers of aluminium to the USA as indicated in the table below:
Table 6: USA’s Global Imports of Ch 76 (value in US$ billion and share %)
| Exporter | 2022 | 2023 | Growth (%) | Share % in 2022 | Share % in 2023 |
|---|---|---|---|---|---|
| World | 36.66 | 28.30 | -22.8% | - | - |
| Canada | 12.94 | 11.22 | -13.3% | 35.3% | 39.7% |
| China | 4.04 | 2.74 | -32.1% | 11.0% | 9.7% |
| Mexico | 2.27 | 1.96 | -13.9% | 6.2% | 6.9% |
| United Arab Emirates | 1.99 | 1.62 | -18.9% | 5.4% | 5.7% |
| India | 1.22 | 0.91 | -25.6% | 3.3% | 3.2% |
| Bahrain | 1.34 | 0.67 | -49.8% | 3.6% | 2.4% |
| Korea, Republic of | 1.03 | 0.64 | -37.6% | 2.8% | 2.3% |
| Germany | 0.80 | 0.64 | -19.5% | 2.2% | 2.3% |
| Colombia | 0.57 | 0.64 | 12.6% | 1.5% | 2.3% |
| Australia | 0.76 | 0.62 | -18.0% | 2.1% | 2.2% |
Source: ITC Trade Map
To understand the impact of Section 232 on India’s exports of aluminium to the USA, we investigated the export trend before and after the imposition of Section 232 in 2018.
Fig1: India’s aluminium exports to the US: Before and after the Section 232 tariffs
The figure above clearly indicates that while after the imposition of the tariff, there was some decline in India’s exports to the US, it revived again during the post-COVID times. This can be partially attributed to the exclusion process and USA’s China+1 strategy.
PROBABLE IMPACT OF FLAT 25% TARIFF ON ALUMINIUM AND ITS DERIVATIVES EXPORTS TO THE USA
We investigated the lines pertaining to aluminium and its products and some derivatives to understand the impact of the flat 25% tariff on exports to the US. Our initial analysis revealed that, India has more than 5% share in USA’s long products imports (that is bars, rods, wires, tubes and pipes). Maximum impact will therefore be expected in aluminium long products followed by products of aluminium and aluminium ingots.
| Product category | India’s five years avg. exports to the US (2019 to 2023) |
USA’s 5-year average import from the world (2019 to 2023) |
India’s share in USA’s import basket (2019 to 2023) |
|---|---|---|---|
| Aluminium ingots | 264.42 | 10944.12 | 2.4% |
| Aluminium Long products | 133.13 | 2397.9 | 5.6% |
| Derivatives of aluminium | 1157.83 | 69659.87 | 1.7% |
| Flat rolled products of aluminium | 47.02 | 3765.3 | 1.2% |
| Products of aluminium | 151.06 | 6071.35 | 2.5% |
| Grand Total | 1753.463 | 92388.55 | 1.9% |
The above table highlights that India’s total exports of aluminium, and its derivatives amounted to approximately US$ 1.75 billion. However, under the latest U.S. Section 232 proclamation, all these products will now be subject to a 25% tariff, marking a significant setback for Indian exporters.
Previously, only 31 aluminium products at the 8-digit HS code level were covered under Section 232 and faced a 10% tariff, with certain exclusions in place. The new proclamation eliminates all exclusions and raises the tariff to 25%, drastically increasing the cost burden on Indian exporters.
This sharp rise in tariffs is expected to erode the price competitiveness of Indian aluminium products in the U.S. market. Without exemptions, Indian exporters will struggle to compete against domestic U.S. manufacturers and suppliers from countries that may secure preferential treatment before the March 12 implementation date.
Aluminium Association of India has identified significant demand-supply gap in USA’s aluminium industry which is also indicated in the table below:
Table7: USA Demand-Supply Deficit of CY-23 (Quantity in KT)
| Details | Aluminium | Billet | Wire Rod |
|---|---|---|---|
| Production | 784 | 333 | 32 |
| Remelt production | 0 | 1240 | 112 |
| Total | 784 | 1573 | 144 |
| Consumption | 4774 | 2456 | 404 |
| Balance | -3990 | -883 | -260 |
Aluminium Association has further cited the example of two specific products for which there is significant demand-supply gap in the USA.

HS 76051100: Aluminium Wire of which the maximum cross-sectional dimension exceeds 7 mm.
We have seen that for HS 760511, India’s share in USA’s import basket is 13.2% which is quite significant.

For HS 760120, India’s share in the USA’s import basket is 3.1% which is also significant.
For HS 760120, India’s share in the USA’s import basket is 3.1% which is also significant.
Table 8: Segregation of codes as per notification
on Aluminium
| 76011010 | 76011040 | 76011090 | 76012010 | 76012020 | 76012090 | 76041010 | 76041020 |
| 76041031 | 76041039 | 76042010 | 76042910 | 76042930 | 76042990 | 76051100 | 76051910 |
| 76051999 | 76052990 | 76061190 | 76061200 | 76069110 | 76069190 | 76069290 | 76081000 |
| 76082000 | 76090000 | 76169910 | 76169920 | 76169930 | 76169990 |
New Tariff lines published on 18th Feb
and Products
| 76101000 | 76109000 | 7615102015 | 7615102025 | 7615103015 | 7615103025 | 7615105020 |
| 7615105040 | 7615107125 | 7615107130 | 7615107155 | 7615107180 | 7615107190 | 7615109100 |
| 7615200000 | 7616109090 | 7616991000 | 7616995130 | 7616995140 | 7616995190 |
Products
| 6603908100 | 8302103000 | 8302106300 | 8302106600 | 8302106900 | 8302200000 | 8302230100 |
| 8302303060 | 8302413000 | 8302416015 | 8302416050 | 8302416065 | 8302416080 | 8302423010 |
| 8302423015 | 8302423065 | 8302496035 | 8302496050 | 8302496055 | 8302496065 | 8302500000 |
| 8302603000 | 8306290000 | 8301500050 | 8414596590 | 8414596595 | 8419500000 | 8419500050 |
| 8419500085 | 8419898095 | 8419898500 | 8419898505 | 8419898510 | 8419898515 | 8422909060 |
| 8424909080 | 8473302000 | 8481109000 | 8481900000 | 8505300050 | 8487900080 | 8516902000 |
| 8516905000 | 8516908000 | 8517700000 | 8517700005 | 8529907300 | 8538908185 | 8529909700 |
| 8538100000 | 8541100000 | 8543908580 | 8543706000 | 8543708800 | 8708101600 | 9013908000 |
| 8708106100 | 8708295160 | 8708806590 | 8708899608 | 8716805010 | 9013908000 | 9013908060 |
| 9031909115 | 9401999040 | 9403100000 | 9403200000 | 9403901090 | 9403909010 | 9403909090 |
| 9504500000 | 9504909050 | 9506110000 | 9506190000 | 9506911000 | 9506910030 | 9506910090 |
| 9506991000 | 9506992000 | 9506992500 | 9506992800 | 9506995000 | 9506995500 | 9506999500 |
| 9507302000 | 9507304000 | 9507306000 | 9507308000 | 9507906000 | 9603908050 |
IMPACT ON INDIAN STEEL AND ALUMINIUM EXPORTERS
The expanded tariffs are expected to have notable implications for Indian exporters:
- With the removal of country-specific exemptions, Indian exporters will now face a 25% tariff on both steel and aluminium products, potentially increasing the cost of exporting these goods to the U.S. market.
- The higher tariffs may render Indian products less competitive compared to domestic U.S. products or imports from countries that may negotiate new exemptions before the March 12 implementation date.
HOW DID INDIA RESPOND TO THE US TARIFFS ON STEEL AND ALUMINIUM INTRODUCED IN 2018?
- The U.S. imposed additional tariffs of 25% on steel and 10% on aluminium under section 232 of the Trade Expansion Act, 1962 in March 2018 on a global basis. India’s steel export to the U.S. in the affected categories declined by 35% during FY 2018-19 compared to FY 2017-18, whereas aluminium exports in the affected categ
- India requested the U.S. to reconsider and remove these duties, but the U.S. did not agree. In response, the Government of India imposed retaliatory tariffs on 28 products, including almonds, walnuts, apples, chickpeas, and other items originating from or exported by the U.S., effective from 16th June 2019.
Way forward
The proposed U.S. tariffs on steel and aluminium could significantly impact Indian exports, making it essential for the Indian government to proactively seek exemptions through highlevel diplomatic channels. The diplomatic efforts should emphasize India’s strategic role in the U.S. supply chain, the impact on American industries relying on Indian inputs, and the need for a mutually beneficial trade framework.
We remain hopeful that the U.S. will continue the existing exclusion mechanism, preventing the need for any retaliatory measures. India must leverage its strong trade relations with the U.S. and highlight the mutual benefits of continued access to American markets.


© Copyright , All rights reserved. Design by Andreal