


VOL. 17, ISSUE NO. 8 | November 2024
Oversight


ENGINEERING EXPORTS
The monthly engineering figures for 2024-25 vis-à-vis 2023-24 are shown in Table1 as per the latest DGCI&S estimates.
Top 25 engineering export destinations
We now look at the export scenario of the top 25 nations that had highest demand for Indian engineering products during August 2024 over August 2023 as well as in cumulative terms during April-August 2024-25 vis-à-vis April-August 2023-24. The data (Table2) shows that the top 25 countries contribute 76.1 percent of total engineering exports.
| Table1: Engineering exports: Monthly trend in 2024-25 ($ million) | |||
| Month | 2023-24 | 2024-25 | Growth % |
| April | 8949.36 | 8547.86 | -4.49 |
| May | 9300.62 | 9991.26 | 7.43 |
| June | 8515.72 | 9389.74 | 10.26 |
| April-June | 26765.71 | 27928.86 | 4.35 |
| July | 8720.30 | 9039.06 | 3.66 |
| August | 9048.65 | 9442.89 | 4.36 |
| April-August | 44534.66 | 46410.82 | 4.21 |
India’s engineering exports recorded y-o-y growth for the fourth straight month to August 2024
| Trade flow | Export figures ($ billion) | Growth %w | ||||
| Aug-2023 | Aug-2024 | Apr-Aug 23-24 | Apr-Aug 24-25 | Aug-24 over Aug-23 | Apr-Aug 24-25 over Apr-Aug 2023-24 | |
| Engineering exports | 9.05 | 9.44 | 44.53 | 46.41 | 4.36 | 4.21 |
| Overall merchandise exports | 38.28 | 34.71 | 176.67 | 178.68 | -9.33 | 1.14 |
| Share of engineering % | 23.64 | 27.20 | 25.21 | 25.97 | --- | --- |
| Service exports | 28.71 | 30.69 | 135.50 | 150.18 | 6.90 | 10.83 |
Source: Compiled from data by DGCI&S and Quick Estimates published by the Government of India
Indian engineering exports continued its growth run for the fourth month in a row to August 2024 and this time the growth was higher than July 2024 at 4.36 percent. Cumulative exports during April-August 2024-25 also recorded 4.21 percent growth over the same period last fiscal. Share of engineering in overall merchandise exports was at an impressive 27.2 percent in August 2024 and 25.97 percent on a cumulative basis. Growth in engineering exports in August 2024 was attributed to decent rise in shipments of aircraft, spacecraft and parts; ships, boats and floating structures; automobile and auto components/parts; electrical machinery; and medical and scientific instruments.
Overall engineering exports vs engineering exports excluding steel segment ($ million)
| Trade flow | Aug 2023 | Aug 2024 | Growth % | Apr-Aug 23-24 | Apr-Aug 24-25 | Growth % |
| Overall engineering exports | 9048.65 | 9442.89 | 4.36 | 44534.66 | 46410.82 | 4.21 |
| Engineering exports excluding iron and steel | 8070.80 | 8649.81 | 7.17 | 39058.79 | 42543.57 | 8.92 |
Source: DGCI&S, Govt of India
Observation: Excluding exports of iron and steel, engineering exports recorded a much higher growth, both on a monthly as well as cumulative basis as shown in the table. Exports of iron and steel conceded nearly 19 percent y-o-y decline in August 2024 and 29.4 percent y-o-y decline during April-August 2024-25.
HIGHLIGHTS
- After a decline in April 2024, engineering exports from India started showing an increasing trend and registered y-o-y growth in all four subsequent months to August 2024. In August 2024, engineering exports went up to $9442.89 million from $9048.65 million in the same month last fiscal, securing 4.36 percent growth.
- Cumulative engineering exports during April-August 2024-25 recorded at $46,410.82 million as against $44,534.66 million during the same period of the last fiscal, registering an increase of 4.21 percent.
- According to the Quick Estimates of Department of Commerce, Government of India, share of engineering in India’s total merchandise exports increased to 27.2 percent from 26.6 percent in July 2024. Cumulative share stood at 25.97 percent during April-August 2024-25.
- In August 2024, 20 out of 34 engineering panels witnessed positive y-o-y growth, while the 14 remaining engineering panels showed decline. Exports of iron and steel; products of iron and steel; non-ferrous products including copper aluminium, zinc, lead, and tin and products; other products including IC engines and parts; industrial machinery for dairy; electrical machinery and equipment; cranes, lifts and winches; and office equipment, dropped.
- On a cumulative basis, 24 out of 34 engineering panels recorded positive growth and remaining 10 engineering panels including iron and steel; products of iron and steel; some non-ferrous sectors including copper, aluminium, zinc, nickel, and products, IC engines; office equipment; and prima mica products recorded negative growth during April-August 2024-25.
- Region-wise, North America and the European Union remained India’s topmost destinations for engineering exports with shares of around 21 and 19 percent respectively, in India’s total engineering exports. West Asia and North Africa (WANA) with a share of 14 percent registered the highest growth of 23.5 percent during April-August 2024-25 vis-à-vis the same period last year followed by Other Europe (13.8), CIS (10.8), North America (7.3) and Northeast Asia (6.1) percent, respectively.
- Among top exporting destinations, USA, UAE, Saudi Arabia, Turkey, Singapore, UK, and Mexico experienced positive growth in April-August 2024-25.
| Table2: Engineering exports country-wise ($ million) | ||||||
|---|---|---|---|---|---|---|
| Country | Aug 2023 | Aug 2024 | Growth % | Apr-Aug 23-24 | Apr-Aug 24-25 | Growth % |
| USA | 1551.3 | 1567.4 | 1.0 | 7298.3 | 7726.7 | 5.9 |
| UAE | 428.0 | 613.0 | 43.2 | 2247.0 | 3230.6 | 43.8 |
| Saudi Arabia | 386.7 | 405.4 | 4.8 | 1752.2 | 2224.9 | 27.0 |
| Germany | 371.1 | 385.4 | 3.9 | 1753.6 | 1725.1 | -1.6 |
| Singapore | 221.7 | 305.8 | 37.9 | 1357.6 | 1672.3 | 23.2 |
| UK | 335.4 | 331.8 | -1.1 | 1550.6 | 1617.2 | 4.3 |
| Mexico | 267.7 | 322.9 | 20.6 | 1368.7 | 1591.2 | 16.3 |
| Turkey | 255.8 | 280.6 | 9.7 | 1180.7 | 1463.3 | 23.9 |
| Italy | 287.0 | 217.7 | -24.1 | 1738.1 | 1285.2 | -26.1 |
| South Korea | 208.9 | 245.4 | 17.4 | 1225.6 | 1093.7 | -10.8 |
| China | 209.8 | 261.9 | 24.9 | 968.4 | 1078.6 | 11.4 |
| Indonesia | 177.9 | 301.7 | 69.5 | 1291.9 | 944.8 | -26.9 |
| Japan | 128.9 | 201.6 | 56.4 | 718.3 | 907.9 | 26.4 |
| Brazil | 185.0 | 186.6 | 0.8 | 855.3 | 905.0 | 5.8 |
| Nepal | 185.9 | 182.5 | -1.8 | 999.9 | 896.7 | -10.3 |
| South Africa | 195.4 | 177.9 | -9.0 | 949.1 | 894.5 | -5.8 |
| Bangladesh | 201.7 | 152.4 | -24.4 | 966.5 | 848.3 | -12.2 |
| Thailand | 160.8 | 184.0 | 14.4 | 751.6 | 818.7 | 8.9 |
| Netherland | 161.5 | 148.1 | -8.3 | 874.3 | 794.8 | -9.1 |
| France | 207.2 | 159.3 | -23.1 | 888.7 | 770.5 | -13.3 |
| Malaysia | 195.9 | 118.0 | -39.7 | 733.1 | 610.1 | -16.8 |
| Vietnam | 93.4 | 112.9 | 20.9 | 469.8 | 576.8 | 22.8 |
| Belgium | 139.9 | 114.2 | -18.4 | 699.1 | 575.8 | -17.6 |
| Russia | 106.4 | 111.9 | 5.2 | 565.7 | 544.0 | -3.8 |
| Spain | 125.6 | 102.6 | -18.3 | 693.7 | 543.8 | -21.6 |
| Total engineering exports to top 25 countries | 6788.9 | 7191.2 | 5.9 | 33897.8 | 35340.5 | 4.3 |
| Total engineering exports | 9048.7 | 9442.9 | 4.4 | 44534.7 | 46410.8 | 4.2 |
| Share % of top 25 destinations | 75.0 | 76.2 | 76.1 | 76.1 | ||
| Table3: Region-wise engineering exports in Apr-Aug 24-25 vs Apr-Aug 23-24 ($ million) | ||||||
|---|---|---|---|---|---|---|
| Region | Aug 2023 | Aug 2024 | Growth % | Apr-Aug 23-24 | Apr-Aug 24-25 | Growth % |
| North America | 1916.5 | 1985.5 | 3.6 | 9160.8 | 9828.4 | 7.3 |
| European Union | 1670.7 | 1455.2 | -12.9 | 8593.2 | 7789.0 | -9.4 |
| WANA | 1286.4 | 1493.4 | 16.1 | 6067.9 | 7493.6 | 23.5 |
| ASEAN | 912.4 | 1099.6 | 20.5 | 4957.9 | 5071.6 | 2.3 |
| NE Asia | 638.4 | 778.6 | 22.0 | 3304.6 | 3506.8 | 6.1 |
| Other Europe | 627.0 | 638.1 | 1.8 | 2887.4 | 3287.0 | 13.8 |
| SSA | 723.7 | 680.3 | -6.0 | 3341.1 | 3152.4 | -5.6 |
| South Asia | 481.8 | 504.5 | 4.7 | 2456.5 | 2518.9 | 2.5 |
| Latin America | 508.2 | 495.8 | -2.5 | 2424.3 | 2416.8 | -0.3 |
| CIS | 131.0 | 179.2 | 36.7 | 690.8 | 765.4 | 10.8 |
| Oceania | 150.6 | 129.7 | -13.9 | 639.3 | 570.5 | -10.8 |
| Others | 1.9 | 3.0 | 58.2 | 10.8 | 10.5 | -2.7 |
| Grand total | 9048.7 | 9442.9 | 4.4 | 44534.7 | 46410.8 | 4.2 |
Note: Myanmar has been included in ASEAN and not in South Asia, since ASEAN is a formal economic grouping
Region-wise India’s engineering exports
Table3 and Figure1 depict region-wise India’s engineering exports for April-July 2024 as opposed to April-July 2023.
Panel-wise India’s engineering exports
In this section we look at the engineering panel-wise exports for August 2024 vis-à-vis August 2023 as well as the cumulative exports for April-August 2024-25 vis-à-vis April-August 2023-24. These are indicated in Table4.
PANEL-WISE ANALYSIS: REASONS FOR DECLINE
Iron and steel and products of iron and steel
a) During April-August 2024-25, India’s exports of iron and steel deteriorated by 29 percent vis-à-vis the same period the previous fiscal, while products of iron and steel deteriorated by 1 percent during the same period.
b) The ferrous sector continued to record decline in exports mainly due to slackened domestic and global demand pressuring down prices. Plus, China’s aggressive export policy is also likely to sustain its negative impact on steel mills across he globe, including India.
c) Chinese steel prices continued to down-trend in September. Even Indian steel prices are grovelling at near-four year lows. Flat steel prices, especially of hot rolled coil (HRC) remained in a bear grip amid lacklustre demand despite the fact that the festive season is round the corner.
| Table4: Panel-wise export analysis, April-August 2024-25 vs April-August 2023-24 | ||||||
|---|---|---|---|---|---|---|
| Product panel | August 23 | August 24 | Growth % | Apr-Aug 23-24 | Apr-Aug 24-25 | Growth % |
| FERROUS | ||||||
| Iron and steel | 977.9 | 793.1 | -19 | 5475.9 | 3867.2 | -29 |
| Products of iron and steel | 867.4 | 865.6 | 0 | 4035.9 | 3979.9 | -1 |
| Subtotal | 1845.3 | 1658.7 | -10 | 9511.8 | 7847.2 | -18 |
| NON-FERROUS | ||||||
| Copper and products | 202.3 | 182.2 | -10 | 916.0 | 806.5 | -12 |
| Aluminium and products | 599.1 | 519.8 | -13 | 3053.2 | 2723.0 | -11 |
| Zinc and products | 55.2 | 40.8 | -26 | 348.7 | 289.3 | -17 |
| Nickel and products | 14.5 | 16.4 | 14 | 73.2 | 72.5 | -1 |
| Lead and products | 60.9 | 58.1 | -5 | 231.9 | 357.1 | 54 |
| Tin and products | 2.5 | 1.5 | -39 | 6.5 | 8.3 | 28 |
| Other non-ferrous metals | 66.3 | 75.6 | 14 | 305.5 | 345.7 | 13 |
| Subtotal | 1000.8 | 894.6 | -11 | 4935.1 | 4602.6 | -7 |
| INDUSTRIAL MACHINERY | ||||||
| Industrial machinery like boilers, parts, etc. | 55.9 | 71.2 | 27 | 303.1 | 317.4 | 5 |
| IC engines and parts | 343.7 | 314.1 | -9 | 1535.7 | 1517.8 | -1 |
| Pumps of all types | 114.9 | 130.6 | 14 | 594.4 | 624.3 | 5 |
| Air condition and refrigerators | 145.4 | 163.7 | 13 | 686.2 | 739.3 | 8 |
| Industrial machinery for dairy, foodprocessing, textiles etc. | 698.6 | 678.4 | -3 | 3304.0 | 3365.6 | 2 |
| Machine tools | 65.0 | 68.5 | 5 | 306.5 | 331.8 | 8 |
| Machinery for injecting moulding, valvesand ATMs | 213.4 | 231.0 | 8 | 1029.7 | 1119.6 | 9 |
| Subtotal | 1636.7 | 1657.5 | 1 | 7759.6 | 8015.9 | 3 |
| ELECTRICAL MACHINERY | ||||||
| Electrical machinery | 1184.7 | 1158.5 | -2 | 5148.3 | 5696.1 | 11 |
| AUTOMOBILE AND AUTO COMPONENTS | ||||||
| Motor vehicle/cars | 736.8 | 776.0 | 5 | 3508.4 | 3609.1 | 3 |
| Two and three wheelers | 228.2 | 261.1 | 14 | 1110.0 | 1276.7 | 15 |
| Auto components/part | 662.6 | 700.5 | 6 | 3126.5 | 3400.4 | 9 |
| Auto tyres and tubes | 237.8 | 242.0 | 2 | 1139.8 | 1254.8 | 10 |
| Subtotal | 1865.4 | 1979.6 | 6 | 8884.7 | 9540.9 | 7.4 |
| AIRCRAFT AND RELATED PRODUCTS | ||||||
| Aircraft, spacecraft parts and products | 114.6 | 436.9 | 281 | 572.1 | 2257.5 | 295 |
| SHIPS BOATS AND FLOATING PRODUCTS AND PARTS | ||||||
| Ships, boats, floating products and parts | 93.8 | 275.1 | 193 | 1698.6 | 2001.3 | 18 |
| MISCELLANEOUS ENGINEERING PRODUCTS | ||||||
| Medical and scientific instruments | 196.6 | 241.7 | 23 | 1000.4 | 1078.8 | 8 |
| Railway transport | 24.7 | 28.6 | 16 | 125.4 | 131.4 | 5 |
| Hand tools and cutting tools | 80.4 | 90.3 | 12 | 384.1 | 413.9 | 8 |
| Bicycle and parts | 33.4 | 33.8 | 1 | 152.5 | 153.7 | 1 |
| Cranes lifts and winches | 96.8 | 88.3 | -9 | 380.1 | 454.8 | 20 |
| Office equipment | 35.7 | 29.1 | -18 | 146.5 | 118.3 | -19 |
| Other construction machinery | 260.2 | 265.1 | 2 | 1193.3 | 1258.3 | 5 |
| Prime mica and mica products | 3.0 | 2.0 | -33 | 16.0 | 11.6 | -28 |
| Project goods | 0.5 | 0.2 | -56 | 1.8 | 0.9 | -49 |
| Other rubber product except footwear | 144.4 | 155.9 | 8 | 686.5 | 732.5 | 7 |
| Other misc. items | 431.5 | 446.9 | 4 | 1937.8 | 2095.1 | 8 |
| Total engineering exports | 9048.7 | 9442.9 | 4.4 | 44534.66 | 46410.82 | 4.2 |
d) Several factors are weighing on flats. One, with the fiscal half-year closure approaching buyers reined in procurements amid a liquidity strain and resorted to need-based procurement. Retailers, in turn, nursing inventories, also stocked up less, leading to a pile-up across the value chain. Two, the import pressure continues to exist. Cumulative imports touched 0.51 million tonne till mid-September 2024 against August’s 0.63 mt and 0.64 mt in July. However, an additional 0.29 mt are expected by end-September. India will remain a net steel importer in the July-September quarter as well as in the first half of the current fiscal. Lastly, exports remain a no-show, exerting downward pressure on domestic prices.
e) Export offers to Southeast Asia and the Middle East continued to be on hold while those to Europe remained stable w-o-w. However, global sentiments are dull and ongoing anti-dumping investigations from the European Commission have made buyers from there wary of Indian imports. Indian steel prices may remain range-bound or see marginal dips in the short term as demand is likely to stay lacklustre for some more time yet. Moreover, global prices are subdued too. The auto sector usually revs up ahead of the festive season and spurs the flats segment. However, this year, automakers are sitting on inventories. An extended monsoon is keeping construction dampened.

f) Top markets affected: India’s exports to the USA and EU markets are getting affected due to several factors. List of various NTMs, including the Carbon Border Adjustment Mechanism (CBAM) and Deforestation-free Regulation (EUDR), impact Indian exports. The economic slowdown in key markets like the USA and EU has reduced demand for imported goods, including those from India.
Non-ferrous sector (copper, aluminium, zinc and nickel)
Copper (decline of ~12 percent)
a) The global copper market has seen significant volatility in recent months, with prices experiencing a sharp decline due to various factors.
b) Falling international prices: As of July 2024, international copper prices have fallen to a two-week low amidst uncertainty over supply and demand in China, as well as broader weakness in the equity markets. Since hitting a record high in May 2024, copper prices have dropped by 14 percent, according to the London Metal Exchange (LME). Experts predict that prices may continue to decline in the near term, reflecting a softer demand outlook in China, the world’s largest consumer of copper.
c) Increased Chinese exports: Compounding the challenges for India, China’s refined copper exports surged to an all-time high in June 2024, driven by weak domestic demand. This influx of Chinese copper into the global market has intensified competition, leading to a reduction in India’s copper exports. The increased availability of cheaper Chinese copper has made it more difficult for Indian exporters to maintain their market share.
| Table5:Top state-wise engineering export performance – April-June 2024-25 ($ million) | ||||||
|---|---|---|---|---|---|---|
| Top state | Apr-Jun 23- 24 | Apr-Jun 24- 25 | Growth % | % share in India’s engineering exports | Remark | |
| Maharashtra | 5845.3 | 5721.7 | -2.1 | 23.2 | 92.7% share covered by top 12 states | |
| TamilNadu | 3969.7 | 4185.9 | 5.4 | 17.0 | ||
| Gujarat | 3361.8 | 3567.1 | 6.1 | 14.5 | ||
| Karnataka | 1690.7 | 1676.9 | -0.8 | 6.8 | ||
| Odisha | 1821.4 | 1493.4 | -18.0 | 6.1 | ||
| Telangana | 412.2 | 1412.0 | 242.6 | 5.7 | ||
| AndhraPradesh | 1542.4 | 1261.0 | -18.2 | 5.1 | ||
| UttarPradesh | 1049.4 | 1057.5 | 0.8 | 4.3 | ||
| WestBengal | 830.5 | 816.4 | -1.7 | 3.3 | ||
| Haryana | 1690.2 | 667.4 | -60.5 | 2.7 | ||
| MadhyaPradesh | 471.4 | 484.5 | 2.8 | 2.0 | ||
| Delhi | 936.6 | 480.2 | -48.7 | 1.9 | ||
Source: NIRYAT portal
| Table6: Region-wise exports from India ($ million) | ||||||
|---|---|---|---|---|---|---|
| Region | April-June 2023-24 | April-June 2024-25 | Growth % | |||
| Eastern | 3221.1 | 2743.1 | -14.8 | |||
| Northern | 5531.7 | 2967.5 | -46.4 | |||
| Southern | 7934.0 | 8777.5 | 10.6 | |||
| Western | 10125.2 | 10140.7 | 0.2 | |||
Note: The total engineering exports given in the table is taken from NIRYAT as per the latest available data and may not tally with the total engineering exports as given by DGCI&SSource: NIRYAT portal
| Table7: Engineering exports growth vis-à-vis manufacturing growth from April 2022 | ||
|---|---|---|
| Month/Year | Engineering exports growth % | Manufacturing growth % |
| April 2023 | -7.52 | 5.5 |
| May 2023 | -4.25 | 6.3 |
| June 2023 | -11.12 | 3.5 |
| July 2023 | -6.91 | 5.3 |
| August 2023 | 7.66 | 10.0 |
| September 2023 | 6.50 | 5.1 |
| October 2023 | 6.99 | 10.6 |
| November 2023 | -3.48 | 1.3 |
| December 2023 | 9.82 | 4.6 |
| January 2024 | 4.20 | 3.6 |
| February 2024 | 15.90 | 4.9 |
| March 2024 | 10.66 | 5.9 |
| April 2024 | -4.49 | 4.2 |
| May 2024 | 7.43 | 5.0 |
| June 2024 | 10.26 | 3.2 |
| July 2024 | 3.66 | 4.6 |
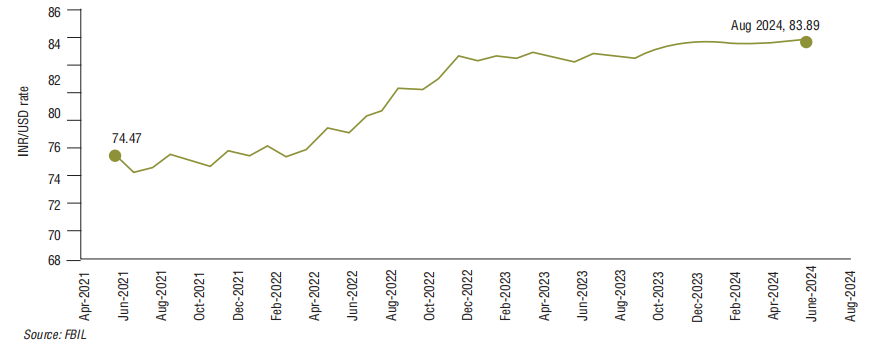
| Table8: USD-INR monthly average exchange rate in 2024-25 vs 2023-24 (1 USD to INR) | ||||||
|---|---|---|---|---|---|---|
| Month | 2023-24 | 2024-25 | Change y-o-y % | Direction | Change m-o-m % | Direction |
| April | 82.02 | 83.41 | 1.69 | Depreciation | 0.49 | Depreciation |
| May | 82.34 | 83.39 | 1.28 | Depreciation | -0.02 | Appreciation |
| June | 82.23 | 83.47 | 1.51 | Depreciation | 0.10 | Depreciation |
| July | 82.15 | 83.59 | 1.75 | Depreciation | 0.14 | Depreciation |
| August | 82.79 | 83.89 | 1.33 | Depreciation | 0.36 | Depreciation |
| Table9: USD-INR monthly average exchange rate, 2023-24 vs 2022-23 (1 USD to INR) | ||||||
|---|---|---|---|---|---|---|
| Month | 2022-23 | 2023-24 | Change y-o-y % | Direction | Change m-o-m % | Direction |
| April | 76.17 | 82.02 | 7.68 | Depreciation | -0.33 | Appreciation |
| May | 77.32 | 82.34 | 6.49 | Depreciation | 0.39 | Depreciation |
| June | 78.04 | 82.23 | 5.37 | Depreciation | -0.13 | Appreciation |
| July | 79.60 | 82.15 | 3.20 | Depreciation | -0.10 | Appreciation |
| August | 79.56 | 82.79 | 4.06 | Depreciation | 0.78 | Depreciation |
| September | 80.23 | 83.04 | 3.50 | Depreciation | 0.30 | Depreciation |
| October | 82.34 | 83.24 | 1.09 | Depreciation | 0.24 | Depreciation |
| November | 81.81 | 83.30 | 1.82 | Depreciation | 0.07 | Depreciation |
| December | 82.46 | 83.28 | 0.99 | Depreciation | -0.02 | Appreciation |
| January | 81.90 | 83.12 | 1.49 | Depreciation | -0.19 | Appreciation |
| February | 82.61 | 82.96 | 0.42 | Depreciation | -0.19 | Appreciation |
| March | 82.29 | 83.00 | 0.86 | Depreciation | 0.05 | Depreciation |
d) Red Sea crisis: The ongoing geopolitical crisis in the Red Sea region has disrupted trade routes, adversely affecting India’s copper exports. The instability in this critical maritime corridor has slowed down the movement of goods, creating bottlenecks that have hit the export of various products, including copper. This disruption has contributed to the overall decline in export volumes and delayed shipments.
e) Rising domestic demand: On the domestic front, there has been a significant surge in demand for copper, driven by the rapid expansion of the electric vehicle (EV) industry and other emerging sectors. The Ministry of Mines projects that the demand for copper in India, particularly from the EV sector, will increase by 1.7 million tonne by 2027. The per capita copper consumption in India is also expected to rise from the current level of 0.6 kg to 1 kg in the coming years. This growing domestic demand is diverting supply away from export markets, further contributing to the decline in exports.
f) Closure of Vedanta’s Sterlite copper plant: India’s copper production capabilities have been significantly impacted by the closure of Vedanta’s Sterlite Copper plant in 2018. According to the International Copper Association, the closure has led to an estimated annual loss of $1 billion in net foreign exchange inflows due to reduced copper exports. Additionally, India has been forced to spend approximately $1.2 billion annually on copper imports to fill the supply gap, further straining the country’s trade balance. The loss of this key production facility has reduced India’s ability to compete in the global copper market.
Aluminium (decline of ~11 percent)
India’s aluminium exports have faced significant challenges in recent times due to a combination of global market dynamics, restrictive trade policies, and domestic factors. The key reasons contributing to the decline in aluminium exports are listed here.:
a) Restrictive trade policies and geopolitical tensions
Section 232 and US tariffs: The US Section 232 tariffs have adversely affected aluminium exports to the US, one of India’s key markets. Between April and July 2024, India’s aluminium exports to the US declined by 5 percent. These tariffs are part of broader protectionist measures that have hampered the competitiveness of Indian aluminium products in the US market.
ASEAN trade barriers: In the ASEAN region, countries like Malaysia have imposed high most favoured nation (MFN) duties ranging from 25 to 30 percent on tariff lines between 7604 to 7608, severely limiting exports from India’s downstream aluminium industry, which predominantly comprises MSMEs. Similarly, Indonesia has placed downstream aluminium products under the Sensitive Track, further restricting market access.
Discrimination in neighbouring markets: India’s aluminium exports also face discriminatory practices in neighbouring countries such as Bangladesh. In April 2023, Bangladesh reclassified aluminium billets under HS code 76012090 to 76012000, removing them from the South Asian Free Trade Area (SAFTA) agreement and imposing a 5 percent basic customs duty (BCD) on imports from India. This change has increased the cost of exporting aluminium billets to Bangladesh, affecting trade volumes.
b) Increased exports from China
Competitive pressure from China: China’s exports of aluminium products have surged, with a 14.1 percent increase in quantity and an 8.9 percent increase in value between January and July 2024, according to Chinese Customs data. This surge has intensified competition in the global aluminium market, making it challenging for Indian exporters to maintain their market share.
c) Decline in global aluminium prices
Price trends: Global aluminium prices have been on a downward trend, driven by higher production levels and weaker demand, particularly in China. The decline in prices has further eroded the profitability of Indian aluminium exports, making them less competitive on the international stage.
d) Rising domestic demand
Infrastructure development: The government’s focus on infrastructure development has led to a significant increase in domestic demand for aluminium. According to ICRA, domestic aluminium demand is expected to grow by around 9 percent annually over the next two fiscal years. This rising demand has diverted more aluminium towards domestic consumption, reducing the availability of aluminium for exports.
e) Impact of the Red Sea crisis
Supply chain disruptions: The Red Sea crisis has caused delays in the shipment of aluminium scrap to India, as many of these grades originate from the Middle East and the UK. This region accounts for approximately 40-45 percent of India’s total scrap volumes. The reduction in scrap imports has disrupted the supply chain, affecting production and trade dynamics.
f) US antidumping duties on aluminium extrusion products:
On 1 May 2024, the US Department of Commerce announced preliminary antidumping duties on aluminium extrusion products from 14 countries, including India. Indian exporters now face a prohibitive dumping duty rate of 39.05 percent on products classified under HSN 7604 and HSN 7608. This steep duty rate significantly undermines the competitiveness of Indian aluminium exports to the US market. In response, Indian exporters have submitted detailed representations to the US Department of Commerce, highlighting the potential adverse effects on their businesses.
Zinc (decline of ~17 percent) The global zinc demand has been affected by rising zinc prices. Global zinc prices rose over 14 percent since the beginning of 2024.
Internal combustion engines (decline of ~1 percent
The global economic environment plays a significant role in influencing trade volumes impacting the demand for internal combustion engines. Slowdown in key markets such as the EU and USA further impacted demand. Moreover rising raw material costs, currency fluctuations and disruptions in the supply chain (such as raw material shortages, transportation delays, or production bottlenecks) can affect export volumes.
Office equipment (decline of ~19 percent)
Changes in remote work practices, hybrid work models, and office space utilisation might have affected the demand for office equipment.
The increasing adoption of digital tools and virtual collaboration platforms may have reduced the demand for traditional office equipment.
Engineering exports – state-wise analysis
Table5 indicates the exports from top Indian states. It is evident from the table that almost 93 percent of India’s exports is contributed by the listed 12 states. Within this ~54.7 percent of exports is done by Maharashtra, Tamil Nadu and Gujarat together.
State-wise engineering exports – some observations
- The top 12 states constitute over 92.7 percent of India’s engineering exports. Karnataka performed extremely well and moved up to 4th position, Odisha moved further up to 5th position while Telangana dropping down to 6th position and Haryana down to 10th position during April-June 2024-25 compared to the same period last fiscal.
- Major negative growth witnessed in states like Maharashtra, Karnataka, Odisha, Andhra Pradesh, West Bengal, Haryana, Delhi, and Rajasthan during April-June 2024-25 compared to the same period last fiscal.
- Telangana had the most positive growth in the current fiscal.
- Maharashtra being the highest state in terms of engineering goods exports is leading by $1535.8 million from Tamil Nadu (second-highest state) during April-June 2024-25.

India’s region-wise engineering exports
In terms of region, Western region, which includes industrial states like Maharashtra and Gujarat, is the frontrunner in terms of exports with 37.7 percent share. Tamil Nadu from the Southern region has improved its export performance and ranked second after Maharashtra, while Gujarat and Karnataka ranked third and fourth during April-June 2024-25.
Correlation between manufacturing production and engineering exports
Engineering forms a considerable part of the broader manufacturing sector and the share of engineering production in overall manufacturing output is quite significant. As exports generally come from what is produced within a country, some correlation between manufacturing production growth and engineering export growth should exist. We briefly look at the trend in manufacturing growth as also engineering exports growth to see if they move in tandem. It may be mentioned that manufacturing has 77.63 percent weightage in India’s industrial production.
Engineering exports growth and manufacturing output growth moved in the same direction in as many as nine out of 12 months in each of the fiscal years 2019-20 and 2020-21. During fiscal 2021-22, engineering export growth and manufacturing growth moved in the same direction in seven out of 12 months while in each of fiscal 2022-23 and 2023-24, as many as 10 out of 12 months saw engineering exports and manufacturing output moving in the same direction.
The first two months of fiscal 2024-25 also saw manufacturing output growth and engineering exports growth moving in the same direction. April 2024 saw engineering exports declining from a growth in March 2024 and manufacturing output growth decelerating. May 2024 witnessed just the opposite. Engineering exports bounced back to the growth path and manufacturing output growth accelerated. June and July 2024, however, saw both moving in opposite directions. June 2024 saw higher engineering exports growth but lower manufacturing growth while July 2024 just witnessed the reverse.
The link between these two may not be established on a monthly basis, but a positive correlation may be seen if the medium- to long-term trend is considered.
Impact of exchange rate on India’s exports
How did the exchange rate fare during August 2024 and what was the recent trend in rupee-dollar movement? In order to get a clearer picture of the recent trend, we not only took the exchange rate of August 2024, but also considered monthly average exchange rate of the rupee vis-à-vis the dollar for each month of fiscal 2023-24 and 2024-25 till August 2024 as per the latest data published, as mere one-month figure does not reflect any trend. Tables8&9 clearly depicts the short-term trend:
Rupee depreciation vis-à-vis the dollar continued in the new fiscal 2024-25 both on a y-o-y basis and on a month-on-month basis. Rupee dropped below 84 and once again hit record low of 84.09 on 5 August 2024. Despite a weakening dollar and appreciation of many Asian currencies, rupee remained under pressure through most of the month due to unwinding of yuan-funded long bets on the rupee, tepid equity inflows, and strong dollar demand from local importers. Geopolitical tensions in the Middle East, worries over recession in the US, and carryover trade in Japanese yen also pulled down the rupee.
ENGINEERING IMPORTS
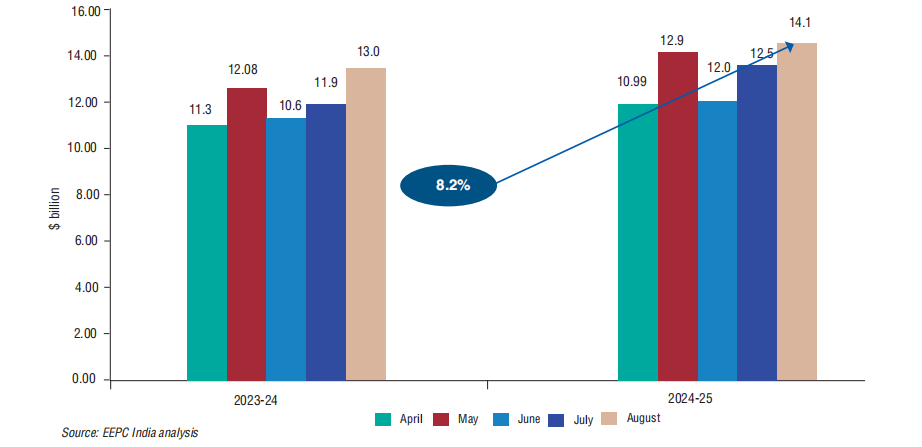
| Table10: India’s engineering imports, Apr-Aug 2024-25 vs Apr-Aug 2023-24 ($ million) | |||||||
|---|---|---|---|---|---|---|---|
| August 23 | August 24 | Growth % | Apr-Aug 23-24 | Apr-Aug 24-25 | Growth % | ||
| India’s engineering imports | 13041.6 | 14116.4 | 8.2 | 58655.4 | 63728.8 | 8.6 | |
India’s engineering imports during August 2024 were valued at $14,116.4 million compared to $13,041.6 million in August 2023, registering positive growth of 8.2 percent in dollar terms. All the engineering panels barring iron and steel and medicinal and pharmaceutical products witnessed increase in imports during August 2024 compared to August 2023.
The share of engineering imports in India’s total merchandise imports in August 2024 was estimated at 21.9 percent, higher than that of August 2023, which was estimated at 20.9 percent. Table10 and Figure3 depict engineering imports for August 2024 compared to August 2023.
Figure3: Monthly engineering imports, April-August 2024-25 vs April-August 2023-24
TREND IN ENGINEERING TRADE BALANCE
| Table11: Monthly trend in engineering trade balance for FY2024-25 ($ billion) | ||||
|---|---|---|---|---|
| Trade flow | April | May | June | July |
| Engineering exports | 8.7 | 10.0 | 9.4 | 9.0 |
| Engineering imports | 11.0 | 12.9 | 12.0 | 12.5 |
| Trade balance | -2.3 | -2.9 | -2.6 | -3.5 |
We now present the trend in two-way yearly trade for the engineering sector for 2024-25 depicted in Table11.
Conclusion
India’s engineering exports continued to grow in the month of August. The growth also continued to be higher than the overall merchandise exports. Therefore, we can say that engineering sector led the growth of India’s merchandise exports in the first five months of the current fiscal. The growth was majorly led by increase in shipments from the machinery sector, especially electrical machinery. However, the metal sector continued to perform below par due to reasons such as pricing, logistics issues, protective measures in key export destinations, and some domestic factors.
The global trade data has been positive for Indian exports – as per latest UN data, India, China, and the USA are driving the global trade recovery. Globally trade within the developing countries or South-South trade is also on the rise. However, the major trade institutions across the world caution that the outlook for 2024 is tempered by potential geopolitical issues and industrial policy impacts. Geopolitical tensions, rising shipping costs, and emerging industrial policies could reshape global trade patterns. India has to make the most of the gains it has accrued in the first half of 2024 and engineering would be a key sector in this initiative.
EEPC India has also been gearing up to provide further assistance to our exporters in expanding their markets and product offerings. As we approach the completion of our 70 years, we look back at the challenges that we faced and won with the support from the Ministry of Commerce and Industry. With such experiences we continue to move forward in our endeavour to reach the milestone of $300 billion by 2030 and $1.5 trillion by 2047.
ANNEXURE I
Engineering product panels – country-wise analysis
We now analyse the performance of some of the important products for fiscal April-August 2024-25 vis-à-vis April-August 2023-24. We have taken the major panels and computed the top importers to get an idea of the current trade pattern.
Engineering product panels – some observations
- In April-August 2024-25, Italy, Nepal, and UAE ranked as the top importers of Indian iron and steel, while the USA, Saudi Arabia, and UAE led in import of products of iron and steel.
- The USA stood out as the primary importer of Indian industrial machinery, making up 21 percent of India’s global exports in this category, followed by Germany and UAE with 5 percent shares each.
- Mexico, Saudi Arabia, and South Africa were the top three importers of India’s automobiles during April-August 2024-25.
- USA, South Korea, and Turkey were the top three importers of India’s non-ferrous metals and products during April-August 2024-25 while USA, Singapore, and UK were the three top importers of Indian electrical machinery and components during the same period.
- UAE, Saudi Arabia, and Turkey were the top three importers of India’s aircraft and spacecraft during April-August 2024-25 in India’s total global exports of the product followed by USA and Romania.
- UAE, Singapore, and USA became the largest importers of ships, boats and floating structures followed by Indonesia and Sri Lanka. While for the auto components’ product group, USA remained the top importer in April-August 2024-25 followed by Brazil, Germany, Turkey, and Mexico.
| Table11: Monthly trend in engineering trade balance for FY2024-25 ($ billion) | ||||
|---|---|---|---|---|
| Product panel | Top 5 nations | Apr-Aug 23-24 | Apr-Aug 24-25 | Growth % |
| Iron and steel | Italy | 844.3 | 516.1 | -39 |
| Nepal | 425.9 | 287.1 | -33 | |
| UAE | 303.0 | 240.4 | -21 | |
| Belgium | 287.3 | 219.2 | -24 | |
| UK | 193.0 | 209.9 | 9 | |
| Products of iron and steel | USA | 1161.8 | 1182.6 | 2 |
| Saudi Arabia | 184.7 | 298.5 | 62 | |
| UAE | 233.8 | 291.7 | 25 | |
| Germany | 191.1 | 186.4 | -2 | |
| UK | 142.8 | 146.7 | 3 | |
| Industrial machinery | USA | 1536.7 | 1686.2 | 10 |
| Germany | 435.4 | 389.3 | -11 | |
| UAE | 318.8 | 366.4 | 15 | |
| China | 294.1 | 363.3 | 24 | |
| Thailand | 331.3 | 317.6 | -4 | |
| Automobiles (motor vehicles/cars and two and three wheelers) | Mexico | 502.3 | 659.3 | 31 |
| Saudi Arabia | 603.3 | 647.1 | 7 | |
| South Africa | 544.3 | 495.8 | -9 | |
| Japan | 81.9 | 288.1 | 252 | |
| UAE | 203.4 | 283.5 | 39 | |
| Non-ferrous metals | USA | 604.0 | 600.4 | -1 |
| South Korea | 590.0 | 393.5 | -33 | |
| Turkey | 54.4 | 356.6 | 556 | |
| Saudi Arabia | 441.7 | 289.8 | -34 | |
| China | 108.2 | 200.2 | 85 | |
| Electrical machinery and components | USA | 1019.9 | 1113.9 | 9 |
| Singapore | 445.4 | 645.3 | 45 | |
| UK | 427.7 | 452.2 | 6 | |
| Germany | 299.1 | 338.9 | 13 | |
| South Korea | 157.8 | 319.4 | 102 | |
| Aircrafts and space crafts | UAE | 8.0 | 573.4 | 7071 |
| Saudi Arabia | 1.0 | 330.9 | 34589 | |
| Turkey | 41.0 | 188.7 | 361 | |
| USA | 186.1 | 177.5 | -5 | |
| Romania | 0.0 | 112.2 | 80715963 | |
| Ships, boats and floating structures and parts | UAE | 452.0 | 663.8 | 47 |
| Singapore | 426.7 | 534.9 | 25 | |
| USA | 52.6 | 249.9 | 375 | |
| Indonesia | 418.3 | 232.7 | -44 | |
| Sri Lanka | 67.7 | 87.1 | 29 | |
| Auto components (including auto parts and auto tyres) | USA | 963.0 | 984.5 | 2 |
| Brazil | 210.9 | 258.5 | 23 | |
| Germany | 229.4 | 257.0 | 12 | |
| Turkey | 217.5 | 220.5 | 1 | |
| Mexico | 191.9 | 212.7 | 11 | |
ANNEXURE II
Country-wise analysis
During April-August 2024-25, several key export destinations saw a decline in demand for Indian engineering products compared to the same period in 2023-24.
Europe (Germany, Italy, Netherlands, France, Belgium, Spain)
India’s engineering exports to Germany, Italy, Netherlands, France, Belgium, and Spain declined by 1.6, 26.1, 9.1, 13.3, 17.6, and 21.6 percent, respectively in April-August 2024-25 compared to April-August 2023-24. These declines reflect reduced demand for Indian engineering products across most of the European markets.
India’s exports to the European Union face significant challenges stemming from stringent standards and tariff barriers. The EU’s rigorous quality, environmental, and safety regulations often create compliance difficulties for Indian exporters, particularly in sectors like engineering goods. The Carbon Border Adjustment Mechanism (CBAM) and other green initiatives present significant hurdles. Additionally, the Ukraine conflict and the Red Sea crisis have created uncertainty for Indian exporters. Table II.2 highlights the decline in imports from major international players across the mentioned countries.
South Korea
India’s engineering exports to South Korea saw a 10.8 percent decline during April-August 2024-25 compared to the same period in 2023-24, with the total exports valued at $1093.68 million. South Korea’s overall imports have declined in recent times, particularly during April-August 2024-25, as imports from major exporters like Japan, Germany, and Singapore saw a decrease compared to the same period in 2023-24. This drop is attributed to various factors, including weakened export demand, ongoing geopolitical tensions, and sluggish domestic consumption, which had already impacted the country’s economic growth in 2023.
Indonesia and Malaysia
India’s engineering exports to Indonesia and Malaysia saw significant declines during April-August 2024-25, dropping by 26.9 and 16.8 percent respectively compared to the same period in 2023- 24. This downturn is part of a broader trend, with both countries, along with other ASEAN members, witnessing reduced imports from key trading partners. For Indonesia, imports from Japan, South Korea, Germany, and Italy recorded sharp declines. Similarly, Malaysia’s imports from countries like France, UK, and Oman decreased, highlighting widespread import contraction from major global exporters.
| II.2 Negative engineering exports country-wise ($ million) | |||
|---|---|---|---|
| Country | April-August 2023-24 | April-August 2024-25 | Growth % |
| Germany | 1753.60 | 1725.05 | -1.6 |
| Italy | 1738.06 | 1285.22 | -26.1 |
| South Korea | 1225.62 | 1093.68 | -10.8 |
| Indonesia | 1291.88 | 944.77 | -26.9 |
| Nepal | 999.91 | 896.73 | -10.3 |
| South Africa | 949.14 | 894.53 | -5.8 |
| Bangladesh | 966.46 | 848.29 | -12.2 |
| Netherlands | 874.32 | 794.83 | -9.1 |
| France | 888.67 | 770.51 | -13.3 |
| Malaysia | 733.09 | 610.08 | -16.8 |
| Belgium | 699.10 | 575.81 | -17.6 |
| Russia | 565.73 | 543.97 | -3.8 |
| Spain | 693.66 | 543.82 | -21.6 |
| Total engineering exports to these countries | 13379.26 | 11527.29 | -13.8 |
| Total engineering exports | 44534.66 | 46410.82 | 4.2 |
| Share % | 30 | 25 | |
© Copyright , All rights reserved. Design by Andreal