







VOL. 19, ISSUE NO. 6 | September 2026

Oversight





ENGINEERING TRADE ANALYSIS FOR JULY 2026
| Trade Flow | Export figures (in US$ billion) | % Growth | ||||
| Jul-2025 | Jul-2026 | Apr-Jul 2025-26 | Apr-Jul 2026-27 | Jul 2026 over Jul 2025 | Apr-Jul 2026-27 over Apr-Jul 2025-26 | |
| Engineering Exports | 10.40 | 12.24 | 39.24 | 46.38 | 17.71% | 18.21% |
| Overall Merchandise Exports | 36.98 | 44.24 | 148.48 | 173.78 | 19.63% | 17.04% |
| Share of engineering | 28.12% | 27.67% | 26.43% | 26.69% | --- | --- |
| Service Exports | 33.74 | 35.89 | 131.15 | 142.64 | 6.37% | 8.76% |
Source: Compiled from data by DGCI&S and Quick Estimates published by the Government of India
Engineering exports continued to witness high growth in fiscal 2026-27 as it grew by 17.7 percent in July 2026
Source: Compiled from data by DGCI&S and Quick Estimates published by the Government of India
After an impressive first quarter performance with over 18 percent year-on-year growth, engineering exports from India in fiscal 2026-27 continued to run on the growth path with nearly 18percentyear-on-year growth in July 2026 even amid geo-political uncertainty along major trade route of India in the West Asian region. Engineering exports in July 2026 was recorded at USD 12.24 billion as against USD 10.40 billion in the same month last fiscal, which was the second monthly highest shipment in 2026-27 after May 2026. On a cumulative basis, engineering exports during April-July 2026-27 stood at USD 46.38 billion as against USD 39.24 billion in the same period last fiscal, registering a growth of 18.21 percent. As per the Quick Estimates of the Government, share of engineering in India’s total merchandise exports was recorded at 27.7 percent during July 2026 while on a cumulative basis, the share was 26.7 percent during April-July 2026-27.This growth in year-on-year engineering exports in the first four months of 2026-27 was attributed to high growth in shipments of Electric machinery and equipment, Copper and products; Ships boats and floating structures; Aluminium and products, Iron and steel, and Motor vehicles/cars among others. Region wise analysis depicted that exports to all regions increased during April-July 2026-27 over the years but exports to WANA and CIS declined in July 2026. Exports to North America, the topmost export destination for engineering, surged by 13.8 percent in 2026-27.
HIGHLIGHTS
- Engineering exports from India continued its growth run in July 2026 with a noteworthy 17.7 percent growth year-on-year. Engineering exports in July 2026 was recorded at USD 12.24 billion as against USD 10.40 billion in the same month last fiscal, which was the second monthly highest shipment in 2026-27 after May 2026.
- On a cumulative basis, egineering exports during April-July 2026-27 stood at USD 46.38 billion as against USD 39.24 billion in the same period last fiscal, registering a growth of 18.21 percent.
- As per the Quick Estimates of the Government, share of engineering in India’s total merchandise exports was recorded at 27.7 percent during July 2026 while on a cumulative basis, the share was 26.7 percent during April-July 2026-27.
- In July 2026, 27 out of 34 engineering panels witnessed positive year-on-year growth. While 7 engineering panels including, Products of Iron and Steel, Lead and products, Machine Tools, Aircraft, Spacecraft and parts, Cranes, Lifts and Winches, Office Equipments, witnessed year-on-year decline in exports.
- On a cumulative basis too, 28 out of 34 engineering panels recorded growth and remaining 6 engineering panels including, Products of Iron and Steel, Lead and products, IC Engines and parts, Machine Tools Cranes, Lifts and Winches, Office Equipments recorded negative growth during April-July 2026-27.
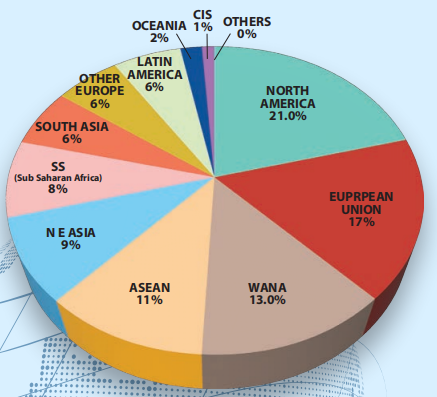
- Region wise analysis showed that engineering exports to all regions recorded growth during July 2026 barring WANA and CIS over July 2025. North America continued to account for the largest share of Indian engineering exports (22%) followed by EU (16.8%), WANA (11.2%), ASEAN (12.0%) and North East Asia (9.4%) during 2026.
- Country-wise, USA continued to remain the top destination for Indian engineering exports in April-July 2026-27 as it recorded an export of 7.78 billion. The y-o-y growth from USA is recorded at a decent 11.8%.
- Country wise analysis also showed that engineering exports to all top destinations namely USA, UAE, Germany, UK and Singapore recorded decent to high growth during April-July 2026 but shipments to Saudi Arabia dropped on a year-on-year basis.
ENGINEERING EXPORTS: MONTHLY TREND
The monthly engineering export figures for 2026-27 vis-à-vis 2025-26 are shown below as per the latest DGCI&S estimates:
Table 1: Engineering Exports: Monthly Trend in 2026-27 (Values in US$ million)
| Month | 2025-26 | 2026-27 | Growth (%) |
| April | 9471.07 | 10353.83 | 9.32 |
| May | 9874.94 | 12312.14 | 24.68 |
| June | 9491.4 | 11475.22 | 20.90 |
| April-June | 28837.4 | 34141.20 | 18.39 |
| July | 10399.9 | 12242.18 | 17.71 |
| April-July | 39237.36 | 46383.37 | 18.21 |
Source: DGCI&S, Govt. of India
TOP 25 ENGINEERING EXPORT DESTINATIONS IN JULY 2026
We now look at the export scenario of the top 25 nations that had highest demand for Indian engineering products during July 2026 over July 2025 as well as in cumulative terms during April-July 2026-27 vis-à-vis April-July 2025-26. The data clearly shows that top 25 countries contribute more than 75 % of total engineering exports.
Table 2: Engineering exports country-wise (Values in US$ Million)
| Countries | July-25 | July-26 | Growth(%) | Apr'-July’ 2025-26 | Apr'-July’ 2026-27 | Growth(%) |
| USA | 1818.7 | 2182.1 | 20.0% | 6951.8 | 7771.2 | 11.8% |
| UAE | 574.5 | 504.8 | -12.1% | 2428.7 | 2532.2 | 4.3% |
| GERMANY | 458.2 | 495.8 | 8.2% | 1617.6 | 1829.9 | 13.1% |
| UK | 402.6 | 457.9 | 13.7% | 1539.7 | 1806.9 | 17.4% |
| SINGAPORE | 353.6 | 517.8 | 46.4% | 1590.5 | 1721.9 | 8.3% |
| SAUDIARABIA | 381.7 | 359.3 | -5.9% | 1478.0 | 1416.0 | -4.2% |
| CHINA | 264.0 | 349.0 | 32.2% | 845.2 | 1349.6 | 59.7% |
| MEXICO | 290.5 | 356.2 | 22.6% | 1076.3 | 1288.9 | 19.8% |
| KOREARP | 236.6 | 274.4 | 16.0% | 951.7 | 1158.6 | 21.7% |
| JAPAN | 256.6 | 391.7 | 52.7% | 893.3 | 1121.2 | 25.5% |
| SOUTHAFRICA | 227.4 | 298.0 | 31.0% | 847.2 | 1117.9 | 32.0% |
| ITALY | 292.6 | 322.8 | 10.3% | 1076.6 | 1096.9 | 1.9% |
| SRI LANKA | 124.3 | 245.0 | 97.1% | 420.7 | 1093.1 | 159.8% |
| FRANCE | 201.4 | 283.8 | 40.9% | 739.7 | 965.9 | 30.6% |
| MALAYSIA | 133.1 | 239.7 | 80.0% | 404.4 | 919.6 | 127.4% |
| BRAZIL | 227.8 | 281.8 | 23.7% | 859.0 | 898.8 | 4.6% |
| NEPAL | 178.3 | 205.8 | 15.4% | 796.2 | 891.6 | 12.0% |
| VIETNAM | 127.9 | 216.0 | 68.8% | 472.4 | 832.2 | 76.1% |
| NETHERLANDS | 179.3 | 192.9 | 7.5% | 733.0 | 792.2 | 8.1% |
| INDONESIA | 168.7 | 220.8 | 30.9% | 573.0 | 738.9 | 29.0% |
| THAILAND | 202.3 | 184.0 | -9.1% | 729.3 | 704.2 | -3.4% |
| AUSTRALIA | 119.0 | 247.9 | 108.4% | 484.9 | 698.5 | 44.0% |
| SPAIN | 134.4 | 169.0 | 25.7% | 483.5 | 687.8 | 42.2% |
| TURKEY | 183.2 | 173.0 | -5.6% | 700.1 | 684.6 | -2.2% |
| OMAN | 78.8 | 140.1 | 77.8% | 283.5 | 601.2 | 112.1% |
| Total engineering exports to top 25 countries | 7615.7 | 9309.7 | 22.2% | 28976.4 | 34719.8 | 19.8% |
| Total engineering exports | 10399.9 | 12242.2 | 17.7% | 39237.4 | 46383.4 | 18.2% |
Source: DGCI&S
REGION WISE INDIA’S ENGINEERING EXPORTS
The following table depicts region wise India’s engineering exports for April-July 2026 as compared to April-July 2025
Table 3: Region wise engineering exports in April-July 2026-27 vis-à-vis April-July 2025-26 (Values in US$ Million)
| Region | July-25 | July-26 | Growth (%) | Apr' - July’ 2025-26 | Apr' - July’ 2026-27 | Growth (%) |
| NORTH AMERICA | 2215.8 | 2687.5 | 21.3% | 8456.7 | 9623.9 | 13.8% |
| EUROPEAN UNION | 1881.2 | 2053.0 | 9.1% | 6910.6 | 7788.9 | 12.7% |
| WANA | 1453.5 | 1368.9 | -5.8% | 5630.9 | 6013.5 | 6.8% |
| ASEAN | 1059.8 | 1472.4 | 38.9% | 4158.2 | 5289.1 | 27.2% |
| N E ASIA | 865.0 | 1151.6 | 33.1% | 3093.1 | 4122.4 | 33.3% |
| SSA( Sub Saharan Africa) | 808.0 | 1029.2 | 27.4% | 2994.0 | 3856.3 | 28.8% |
| SOUTH ASIA | 530.3 | 658.2 | 24.1% | 2125.6 | 2876.8 | 35.3% |
| OTHER EUROPE | 623.6 | 691.3 | 10.9% | 2394.8 | 2746.4 | 14.7% |
| LATIN AMERICA | 664.1 | 726.9 | 9.5% | 2400.6 | 2704.3 | 12.7% |
| OCEANIA | 132.9 | 259.8 | 95.5% | 533.9 | 749.5 | 40.4% |
| CIS | 150.2 | 129.3 | -13.9% | 490.1 | 536.9 | 9.5% |
| OTHERS | 15.6 | 14.1 | -10.2% | 49.0 | 75.2 | 53.5% |
| Grand Total | 10399.9 | 12242.2 | 17.7% | 39237.4 | 46383.4 | 18.2% |
Source: DGCI&S
Note: Myanmar has been included in ASEAN and not in South Asia, since ASEAN is a formal economic grouping.
Figure 1: Region-wise shares of India’s engineering exports during April-July 2026-27
Source: S&ICGD:
Regional observations:
- In July 2026, India’s exports grew to almost all destinations barring Saudi Arabia (-12.1%), Thailand (-9.1%) and Turkey (-5.6%)
- In Saudi Arabia, the logistics crisis in an around the Hormuz strait has affect India’s exports significantly. Furthermore most of Saudi Arabia’s engineering imports are project linked and the ongoing conflict in the region has affected some projects and Saudi Arabia’s purchasing activity has weekened in the recent times
- In Thailand, the decline is mainly in IC engines and parts which can be explained by Thailand’s consistent shift towards electric vehicles. Furthermore growing competition from RCEP members and increasing cost of compliance for Indian exporters exporting under AIFTA can also have some impact on India’s exports to the region
- In case of Turkey while exports have come down the postitive thing is that, the decline was in double digits a few months ago which has now come down significantly
PANEL WISE INDIA’S ENGINEERING EXPORTS
The following table depicts panel wise India’s engineering exports for April-July 2026 as compared to April-July 2025
Table 4: Panel wise engineering exports in April-July 2026-27 vis-à-vis April-July 2025-26 (US$ Mn)
| S.No | Product panel | July- 25 | July- 26 | Growth (%) | Apr -July 2025- 26 | Apr -July 2026- 27 | Growth (%) | Share % (April-July 2025) | Share % (April-July 2026) |
| 1. Iron and Steel and Products made of Iron and Steel | |||||||||
| A | Iron and Steel | 799.9 | 1267.4 | 58.4% | 3195.1 | 4210.1 | 31.8% | 8.1% | 9.1% |
| B | Products of Iron and Steel | 996.8 | 943.9 | -5% | 3485.2 | 3441.0 | -1.3% | 8.9% | 7.4% |
| Sub Total | 1796.7 | 2211.3 | 23% | 6680.3 | 7651.1 | 15% | 17.0% | 16.5% | |
| 2. Non-Ferrous Metals and Products made of Non-Ferrous Metals | |||||||||
| A | Copper and products | 238.3 | 412.2 | 73% | 798.1 | 1468.4 | 84% | 2.0% | 3% |
| B | Aluminium and products | 543.5 | 772.8 | 42% | 2027.9 | 3083.7 | 52% | 5.2% | 7% |
| C | Zinc and products | 47.6 | 74.5 | 57% | 199.9 | 310.7 | 55% | 0.5% | 1% |
| D | Nickel and products | 16.0 | 19.1 | 19% | 54.9 | 70.9 | 29% | 0.1% | 0% |
| E | Lead and products | 94.0 | 57.1 | -39% | 345.8 | 276.2 | -20% | 0.9% | 1% |
| F | Tin and products | 3.5 | 6.3 | 80% | 9.7 | 26.3 | 171% | 0.02% | 0.06% |
| G | Other Non-Ferrous Metals | 93.5 | 93.9 | 0% | 351.7 | 397.4 | 13% | 0.9% | 1% |
| Sub Total | 1036.3 | 1436.0 | 39% | 3788.0 | 5633.9 | 49% | 9.7% | 12.1% | |
| 3. Industrial Machinery | |||||||||
| A | Industrial Machinery like Boilers, parts, etc | 70.6 | 101.0 | 43% | 308.2 | 363.9 | 18% | 0.8% | 0.8% |
| B | IC Engines and Parts | 379.3 | 388.3 | 2% | 1417.0 | 1415.8 | 0% | 3.6% | 3.1% |
| C | Pumps of all types | 144.2 | 145.6 | 1% | 524.3 | 552.1 | 5% | 1.3% | 1.2% |
| D | Air condition and Refrigerators | 182.7 | 208.6 | 14% | 744.9 | 802.8 | 8% | 1.9% | 1.7% |
| E | Industrial Machinery for dairy,food processing, textiles etc | 800.8 | 869.8 | 9% | 2952.4 | 3099.0 | 5% | 7.5% | 6.7% |
| F | Machine Tools | 108.2 | 80.1 | -26% | 304.4 | 293.9 | -3% | 0.8% | 0.6% |
| G | Machinery for Injecting moulding,valves and ATMs | 276.5 | 285.4 | 3% | 1029.8 | 1050.6 | 2% | 2.6% | 2.3% |
| Sub Total | 1962.3 | 2078.9 | 6% | 7281.1 | 7578.0 | 4% | 18.6% | 16.3% | |
| 4. Electrical Machinery | |||||||||
| A | Electrical Machinery | 1431.3 | 1811.1 | 27% | 5230.6 | 6396.9 | 22% | 13.3% | 13.8% |
| 5. Automobiles | |||||||||
| A | Motor Vehicle / cars | 837.1 | 986.6 | 18% | 3336.3 | 3862.7 | 16% | 8.5% | 8.3% |
| B | Two and Three Wheelers | 346.2 | 437.2 | 26% | 1214.8 | 1563.7 | 29% | 3.1% | 3.4% |
| C | Auto Components / Part | 791.2 | 822.7 | 4.0% | 2880.5 | 3052.6 | 6.0% | 7.3% | 6.6% |
| D | Auto Tyres and Tubes | 272.9 | 281.5 | 3% | 1074.0 | 1123.3 | 5% | 2.7% | 2.4% |
| Sub Total | 2247.4 | 2527.9 | 12% | 8505.6 | 9602.3 | 13% | 21.7% | 20.7% | |
| 6. Aircrafts and Spacecraft parts and products | |||||||||
| A | Aircrafts and Spacecraft parts and products | 151.7 | 137.7 | - 9% | 538.2 | 618.8 | 15% | 1.4% | 1.3% |
| 7. Ships Boats and Floating products and parts | |||||||||
| A | Ships Boats and Floating products and parts | 313.2 | 341.5 | 9% | 1612.4 | 2717.0 | 69% | 4.1% | 5.9% |
| 8. Other engineering products | |||||||||
| A | Medical and Scientific instruments | 246.6 | 279.9 | 13% | 952.2 | 1010.8 | 6% | 2.4% | 2.2% |
| B | Railway Transport | 36.4 | 43.5 | 20% | 138.2 | 233.2 | 69% | 0.4% | 0.5% |
| C | Hand Tools & Cutting Tools | 93.6 | 105.2 | 12% | 355.9 | 374.5 | 5% | 0.9% | 0.8% |
| D | Bicycle Parts | 41.2 | 43.6 | 6% | 153.1 | 166.2 | 9% | 0.4% | 0.4% |
| E | Cranes Lifts & Winches | 105.4 | 98.4 | -7% | 375.3 | 366.4 | -2% | 1.0% | 0.8% |
| F | Office Equipment | 36.0 | 29.4 | -19% | 125.1 | 113.5 | -9% | 0.3% | 0.2% |
| G | Other Construction Machinery | 283.1 | 351.1 | 24% | 1117.4 | 1281.9 | 15% | 2.8% | 2.8% |
| H | Prime Mica & Mica Products | 1.9 | 3.3 | 74% | 10.8 | 11.2 | 4% | 0.0% | 0.0% |
| I | Other Misc. Items | 445.1 | 557.7 | 25% | 1741.1 | 1952.0 | 12% | 4.4% | 4.2% |
| 9. Project Goods | |||||||||
| Project Goods | 0.2 | 0.2 | -22% | 0.4 | 0.6 | 47% | 0.0% | 0.0% | |
| 10. Other Rubber Product Except Footwear | |||||||||
| Other Rubber Product Except Footwear | 171.5 | 185.5 | 8% | 631.6 | 675.2 | 7% | 1.6% | 1.5% | |
| Sub total | 1289.3 | 1512.2 | 17% | 4969.1 | 5509.6 | 11% | 12.7% | 11.9% | |
| Total engineering exports | 10399.9 | 12242.2 | 17.7% | 39237.4 | 46383.4 | 18.2% | |||
Sectoral Observations:
India’s engineering exports grew by about 18.2% in April–July 202627 to around US$46.38 billion, with mixed performance across panels:
a. Exports of iron and steel rose by 15% during April–July 2026-27, supported by higher shipments of primary steel growing by 31.8%, while products of iron and steel witnessed a marginal decrease of 1.3% Overall, India’s steel exports rose 15% to US$7.65 billion during April–July 2026-27, supported by strong demand from the USA, UAE, Italy and UK (EU Countries), Nepal, Vietnam, Netherland, Germany and Belgium (EU markets), and Korea Rep..As per the latest Ministry of Steel estimates, during April to July FY 2026-27, India became a net exporter of steel, with exports marginally exceeding imports by 0.03 million tonnes. During this period, finished steel exports stood at 1.70 million tonnes, while imports were 1.67 million tonnes. In July 2025, India’s finished steel exports increased to 0.49 million tonnes from 0.45 million tonnes in June 2025. At the same time, imports declined significantly to 0.28 million tonnes from 0.44 million tonnes in the previous month, further strengthening the country’s trade position in steel. On the raw material front, NMDC iron ore lump prices declined to ₹5,700 per tonne in July 2025, compared with ₹6,300 per tonne in June 2025, indicating a moderation in domestic iron ore prices. Meanwhile, domestic steel prices softened during the month. Retail prices in the Mumbai market for TMT (10 mm), HRC (2.50 mm) and CRC (0.63 mm) recorded month-on-month declines of 4.1%, 2.9% and 3.2%, respectively, as of 31 July 2025 compared with their levels at the end of June 2025.
Again non-ferrous panel emerged as a significant growth driver as copper, aluminum, zinc, nickel and tin indicated double-digit export growth. Decline was only noted in lead and lead products

ENGINEERING EXPORTS – STATE-WISE ANALYSIS (April-July 2026-27)
Table 5: State-wise India’s engineering exports (value in US$ billion)
| States | April-July 2025 | April-July 2026 | Growth % | Share % |
| MAHARASHTRA | 8.4 | 9.0 | 7% | 19% |
| GUJARAT | 5.3 | 7.2 | 36% | 16% |
| TAMIL NADU | 6.7 | 7.2 | 7% | 15% |
| KARNATAKA | 2.9 | 3.9 | 32% | 8% |
| HARYANA | 2.8 | 3.2 | 12% | 7% |
| ODISHA | 1.8 | 3.1 | 69% | 7% |
| DELHI | 1.6 | 2.0 | 25% | 4% |
| UTTAR PRADESH | 1.5 | 1.6 | 4% | 3% |
| WEST BENGAL | 1.2 | 1.6 | 28% | 3% |
| RAJASTHAN | 1.1 | 1.3 | 18% | 3% |
| ANDHRA PRADESH | 1.5 | 1.3 | -18% | 3% |
| PUNJAB | 1.0 | 1.0 | 0% | 2% |
| TELANGANA | 0.8 | 0.9 | 17% | 2% |
Source: DGCI&S
India’s state-wise engineering exports during April-July 2026-27 reflect robust growth with significant contributions from western and southern states.
Maharashtra remained the largest engineering exporting state, with exports rising to US$ 9.0 billion, accounting for 19% of India’s total engineering exports, although growth was relatively moderate at 7%. Gujarat emerged as one of the strongest growth drivers among the top exporting states, with exports surging 36% to US$ 7.2 billion, capturing a 16% share. Tamil Nadu retained its position as the third-largest exporter, registering 7% growth to US$ 7.18 billion and contributing 15% to the country’s engineering exports. Karnataka and Odisha also recorded impressive growth of 32% and 69%, respectively, highlighting the increasing diversification of India’s engineering export base. Haryana maintained its strong position with exports growing by 12% to US$ 3.16 billion, while Delhi recorded a notable 25% increase in exports. Among the emerging contributors, Uttarakhand posted the highest growth rate among major exporting states, with exports more than doubling by 131% during the period.
Table 6: Region Wise Engineering Exports (Value in US$ million)
| Region Wise | April-July 2025 | April-July 2026 | Growth % | Share % |
| EASTERN REGION | 3572.1 | 5334.9 | 49% | 11.5% |
| NORTHERN REGION | 8276.1 | 9484.2 | 15% | 20.4% |
| SOUTHERN REGION | 12360.4 | 13684.8 | 11% | 29.5% |
| WESTERN REGION | 15028.8 | 17878.5 | 19% | 38.5% |
| Grand Total | 39237.4 | 46382.4 | 18% |
Source: DGCI&S
India’s region-wise engineering exports during April-July 2026 registered a strong growth of 18%, increasing to US$ 46.38 billion from US$ 39.24 billion in the corresponding period of the previous year.
The Western Region continued to dominate India’s engineering exports, with shipments rising by 19% to US$ 17.88 billion, accounting for the largest 38.5% share of total exports.
The Southern Region remained the second-largest contributor, recording exports of US$ 13.68 billion, a growth of 11% over April-July 2025, and accounting for 29.5% of total engineering exports.
The Northern Region posted a healthy growth of 15%, with exports increasing to US$ 9.48 billion, contributing 20.4% to the national total.
The Eastern Region emerged as the fastest-growing region, registering an impressive 49% increase in engineering exports to US$ 5.33 billion. Its share in total exports reached 11.5%, reflecting growing export momentum from the region.
Overall, India’s engineering export performance during April-July 2026 was driven by broad-based growth across all regions, with the Western Region retaining its leadership position while the Eastern Region demonstrated the strongest pace of expansion.
• Maharashtra: Export performance was driven by industrial machinery, products of iron & steel, iron & steel, electric machinery, motor vehicles and auto components, reinforcing its position as India’s largest engineering exporting state.
- Tamil Nadu: Exports were led by motor vehicles, auto components, electric machinery and industrial machinery. In addition, ship, boat and floating structures emerged as a key growth segment during the period.
• Gujarat: The state’s export surge was driven primarily by ship, boat and floating structures, followed by motor vehicles, products of iron & steel, industrial machinery and copper products, indicating broad-based expansion across engineering sectors.
- Karnataka: Growth was supported by a significant jump in electric machinery, along with strong exports of aircraft, spacecraft and parts, iron & steel, auto components and other high-technology engineering products, highlighting the state’s increasing specialization in advanced manufacturing.
• Haryana: Export growth was led by motor vehicles, electric machinery, auto components and industrial machinery, supported by a strong automotive manufacturing ecosystem. The state also recorded notable contributions from two- and three-wheelers, reinforcing its position as a major transport equipment hub.
• Odisha: Export growth was overwhelmingly driven by aluminium and aluminium products and iron & steel, which together accounted for the bulk of the state’s engineering exports. Additional contributions came from ship, boat and floating structures and electric machinery, reflecting increasing diversification beyond metals.
- West Bengal: Export performance was led by iron & steel, followed by products of iron & steel. The state also witnessed notable growth in ship, boat and floating structures, other non-ferrous metal products and aluminium products, supporting its strong export growth during the period.
- Disclaimer: Please note the following disclaimer given by the DGCI&S whereby it is stated that state-wise export figures are based on state of origin code in shipping bills and June not give the right estimate.
CORRELATION BETWEEN MANUFACTURING OUTPUT AND ENGINEERING EXPORTS
Engineering forms a considerable part of the broader manufacturing sector and the share of engineering production in overall manufacturing output is quite significant. As exports generally come from what is produced within a country, some correlation between manufacturing production growth and engineering export growth should exist. We briefly look at the trend in manufacturing growth as also engineering export growth to see if they move in tandem. It may be mentioned that manufacturing has 77.63% weightage in India’s industrial production.
Engineering export growth and manufacturing output growth moved in the same direction in as many as nine out of twelve months in each of the fiscal years 2019-20 and 2020-21. During fiscal 202122, engineering export growth and manufacturing growth moved in the same direction in seven out of twelve months while in each of fiscal 2022-23 and 2023-24, as many as 10 out of 12 months saw engineering exports and manufacturing output moved in the same direction. In 2024-25, both moved in the same direction in eight out of 12 months and in202526, both engineering export growth and manufacturing growth moved in the same direction in seven out of 12 months.
The first month of fiscal 2026-27 saw manufacturing output growth (new series with base year 202223) engineering export growth and moved in the same direction with both securing higher growth over the previous month. May and June 2026, however witnessed both of them moving in the opposite direction. While May 2026 saw higher engineering export growth but moderated manufacturiong output growth, June 2026 witnessed just the reverse.
The link between these two may not be established in one or two months, but a positive correlation may be seen if medium to long term trend is considered.
Table 7: Engineering exports growth vis-à-vis manufacturing growth from April 2024
| Months/ Year | Engg. Export Growth (%) | Manufacturing Growth (%) |
| April 2024 | -4.49 | 4.2 |
| May 2024 | 7.43 | 5.1 |
| June 2024 | 10.26 | 3.5 |
| July 2024 | 5.12 | 4.7 |
| August 2024 | 4.28 | 1.2 |
| September 2024 | 10.55 | 4.0 |
| October 2024 | 39.27 | 4.4 |
| November 2024 | 13.72 | 5.5 |
| December 2024 | 8.33 | 3.7 |
| January 2025 | 7.49 | 5.8 |
| February 2025 | -8.64 | 2.8 |
| March 2025 | -3.92 | 4.0 |
| April 2025 | 11.20 | 3.1 |
| May 2025 | -0.84 | 3.2 |
| June 2025 | 1.28 | 3.7 |
| July 2025 | 13.87 | 6.0 |
| August 2025 | 4.91 | 3.8 |
| September 2025 | 2.93 | 5.6 |
| October 2025 | -16.71 | 2.0 |
| November 2025 | 23.81 | 8.5 |
| December 2025 | 1.29 | 8.4 |
| January 2026 | 10.35 | 5.3 |
| February 2026 | 12.91 | 5.9 |
| March 2026 | 1.13 | 4.3 |
| April 2026 | 9.32 | 6.1 |
| May 2026 | 24.68 | 5.2 |
| Jun 2026 | 20.90 | 7.8 |
Source: Department of Commerce and MOSPI, Govt. of India
IMPACT OF EXCHANGE RATE ON INDIA’S EXPORTS
How did the exchange rate fare during July 2026 and what was the recent trend in Re-Dollar movement? In order to get a clearer picture of the recent Re-Dollar trend, fiscal 2026-27 as per the latest data published, as mere one-month figure does not reflect any trend. The following two tables clearly depicts the short-term trend.
Table 8: USD-INR monthly average exchange rate in 2026-27 vis-à-vis 2025-26 (As per latest data released by FBIL)
|
Monthly Average Exchange Rate (1 USD to INR) |
Year-on-Year Change (%) |
Direction |
Month-on-Month Change (%) |
Direction |
||
| Month | 2025-26 | 2026-27 | ||||
| April | 85.56 | 93.55 | 9.34 | Depreciation | 0.85 | Depreciation |
| May | 85.19 | 95.60 | 12.22 | Depreciation | 2.19 | Depreciation |
| June | 85.90 | 94.97 | 10.56 | Depreciation | -0.66 | Appreciation |
| July | 86.11 | 95.82 | 11.28 | Depreciation | 0.90 | Depreciation |
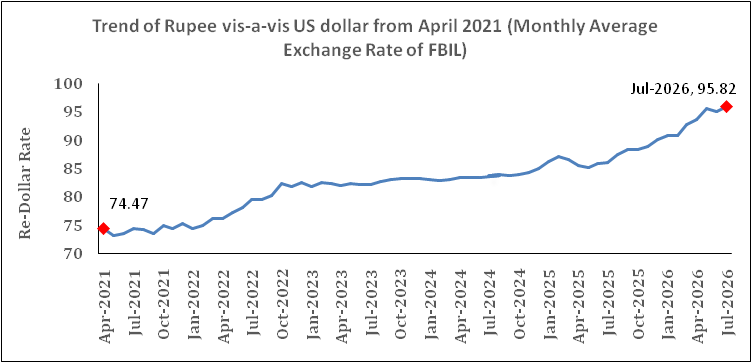
Indian Rupee again depreciated vis-à-vis the US Dollar on a month-on-month basis in July 2026 and this time by 0.9 percent. On a year-on-year basis, the depreciation was as high as 11.28 percent.
Table 9: USD-INR monthly average exchange rate in 2025-26 vis-à-vis 2024-25 (As per latest data released by FBIL)
|
Monthly Average Exchange Rate (1 USD to INR) |
Year-on-Year Change (%) |
Direction |
Month-on-Month Change (%) |
Direction |
||
| Month | 2024-25 | 2025-26 | ||||
| April | 83.41 | 85.56 | 2.58 | Depreciation | -1.25 | Appreciation |
| May | 83.39 | 85.19 | 2.16 | Depreciation | -0.43 | Appreciation |
| June | 83.47 | 85.90 | 2.91 | Depreciation | 0.83 | Depreciation |
| July | 83.59 | 86.11 | 3.01 | Depreciation | 0.24 | Depreciation |
| August | 83.90 | 87.52 | 4.31 | Depreciation | 1.64 | Depreciation |
| September | 83.81 | 88.32 | 5.38 | Depreciation | 0.91 | Depreciation |
| October | 84.03 | 88.42 | 5.22 | Depreciation | 0.11 | Depreciation |
| November | 84.36 | 88.83 | 5.30 | Depreciation | 0.46 | Depreciation |
| December | 84.99 | 90.09 | 6.00 | Depreciation | 1.42 | Depreciation |
| January | 86.26 | 90.80 | 5.25 | Depreciation | 0.79 | Depreciation |
| February | 87.05 | 90.77 | 4.27 | Depreciation | -0.03 | Appreciation |
| March | 86.64 | 92.76 | 7.06 | Depreciation | 2.19 | Depreciation |
Fig 2: Trend of Rupee vis-a-vis US dollar from April 2021 (Monthly Average Rate of FBIL has been considered)
Source: FBIL
ANALYSIS OF INDIA’S ENGINEERING IMPORTS
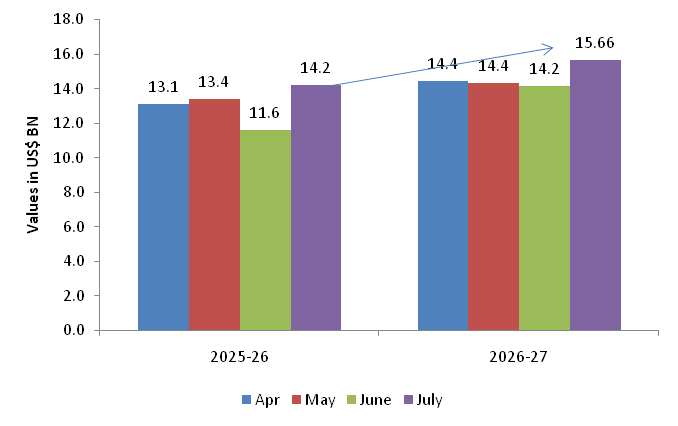
- India’s Engineering imports during July 2026 were valued at US$ 15.7 billion compared to US$ 14.2 billion in July 2025 registering a positive growth of 10.2 percent in dollar terms. In cumulative terms (Apr-July 2026), India’s imports increased by 12.0 percent.
- In July 2026, imports increased sharply for Two and Three Wheelers , Project Goods, Motor Vehicles/ Cars, Tin & Products made of Tin, Ships, Boats & Floating Structures, Hand Tools & Cutting Tools of Metals & Aluminium & its products.
- In July 2026, import increased from the regions, with significant imports from CIS, SSA( Sub Saharan Africa) NE Asia, Oceania, ASEAN, North America and EU. In cumulative terms, imports increased from all regions barring CIS &WANA.
- The share of engineering imports in India’s total merchandise imports in Apr-July 2026 was estimated at 18 percent.
- 42.5 % of India’s engineering imports come from N E Asia and 20.7 % from the EU. The next major suppliers are ASEAN (12.9%), North America (8.1%) and WANA (5.2%) during AprJuly 2026.
Fig 3: Monthly Engineering Imports for April-July 2026-27 vis-a-vis April-July2025-26
Source: DGCI&S
TREND IN ENGINEERING TRADE BALANCE
We now present the trend in two-way yearly trade for the engineering sector for the 2026-27 depicted in the table below:
Table 10: Monthly Trend in Engineering Trade Balance for the current FY 2026-27 (US$ Billions)
| Trade Flow | Apr | May | June | July |
| Engineering Export | 9.89 | 12.31 | 11.48 | 12.24 |
| Engineering Import | 14.44 | 14.36 | 14.19 | 15.66 |
| Trade Balance | -4.55 | -2.05 | -2.71 | -3.42 |
Source: DGCI&S, EEPC India Analysis
CONCLUSION:
Engineering exports reached USD 12.24 billion in July 2026, registering a robust 18 per cent year-on-year growth, while cumulative exports during first quarter that is AprilJuly 2026-27 rose to USD 46.38 billion, an impressive 18.21 per cent increase over the corresponding period of the previous year. Notably, engineering exports grew faster than India’s overall merchandise exports, which increased by 17 per cent during the same period. Engineering’s share in India’s merchandise exports consequently rose to 26.7 per cent in the AprilJuly 2026-27. Importantly, exports remained above USD 10 billion in all the first five months of FY 2026-27, which may indicate a strengthening export base. This performance becomes particularly significant when viewed against the latest global trade trends. The WTO Goods Trade Barometer stood at 101.7 in June 2026, indicating that merchandise trade volumes remained above trend, although the index had eased from 102.3 earlier in the year. Higher energy and shipping costs, geopolitical tensions, protectionist measures and increasingly stringent technical and regulatory requirements could raise the cost of market access. UNCTAD notes that nontariff measures such as technical regulations, health and safety requirements and certification procedures remain a major source of trade costs, particularly for developing economies. In these challenging times, it is important for the Indian engineering exporters sustain the present momentum which can be achieved with greater competitiveness, scale, technological upgrading, compliance capacity and market diversification. The initiative has to be taken by the industry but the support from the Government of India will also play a significant role to ensure that the export growth remains sustainable.
ENGINEERING PRODUCT PANELS – COUNTRY-WISE ANALYSIS
We now analyze the performance of some of the important products for the fiscal April-July 2026 vis-à-vis AprilJuly 2025. We have taken the major panels and computed the top importers to get an idea of the current trade pattern.
Engineering Product Panel - Country matrix (Value in US$ million)
| Product panels | Top 5 nations | April-Juy 2025 | April-July 2026 | Growth |
| Iron and Steel | USA | 301.1 | 610.6 | 103% |
| Nepal | 235.0 | 279.0 | 19% | |
| Italy | 353.9 | 272.5 | -23% | |
| Vietnam | 48.0 | 266.2 | 455% | |
| UAE | 167.6 | 265.9 | 59% | |
| Product panels | Top 5 nations | April-Juy 2025 | April-July 2026 | Growth |
| Products of Iron and Steel | USA | 1050.7 | 1126.9 | 7% |
| UAE | 283.9 | 215.1 | -24% | |
| Germany | 165.1 | 158.0 | -4% | |
| Saudi Arab | 132.1 | 128.9 | -2% | |
| U K | 95.1 | 115.7 | 22% | |
| Industrial Machinery | USA | 1568.1 | 1629.6 | 4% |
| China | 294.5 | 353.2 | 20% | |
| Germany | 329.8 | 334.0 | 1% | |
| Australia | 127.6 | 293.9 | 130% | |
| UAE | 398.1 | 289.2 | -27% | |
| Automobiles (Motor Vehicles/Cars and Two and Three Wheelers) | South Africa | 508.9 | 596.9 | 17% |
| Mexico | 479.3 | 541.7 | 13% | |
| Saudi Arab | 500.5 | 393.8 | -21% | |
| Japan | 301.0 | 307.2 | 2% | |
| Colombia | 235.4 | 274.4 | 17% | |
| Non-Ferrous metals | USA | 605.0 | 739.7 | 22% |
| China | 205.3 | 448.4 | 118% | |
| Korea RP | 342.8 | 447.4 | 31% | |
| Saudi Arab | 318.5 | 423.8 | 33% | |
| Japan | 135.0 | 248.9 | 84% | |
| Electrical Machinery and Components | USA | 1064.0 | 1148.9 | 8% |
| Singapore | 512.5 | 728.3 | 42% | |
| U K | 583.0 | 511.5 | -12% | |
| Germany | 373.0 | 475.1 | 27% | |
| Malaysia | 110.9 | 440.1 | 297% | |
| Aircrafts and Space crafts | UAE | 467.8 | 972.4 | 108% |
| Singapore | 690.3 | 575.3 | -17% | |
| Sri Lanka | 89.1 | 444.2 | 398% | |
| Oman | 65.9 | 171.5 | 160% | |
| Egypt | 0.0 | 158.1 | ||
| Ships, Boats and Floating Structures and parts | UAE | 467.8 | 972.4 | 108% |
| Singapore | 690.3 | 575.3 | -17% | |
| Sri Lanka | 89.1 | 444.2 | 398% | |
| Oman | 65.9 | 171.5 | 160% | |
| Egypt | 0.0 | 158.1 | ||
| Auto Components (including Auto Parts and Auto Tyre) | USA | 781.5 | 862.6 | 10% |
| Germany | 257.0 | 304.3 | 18% | |
| Brazil | 247.9 | 242.1 | -2% | |
| Mexico | 135.7 | 177.3 | 31% | |
| Bangladesh | 178.4 | 155.3 | -13% |
- In April-July 2026, USA, Nepal and Italy ranked as the top importers of Indian Iron and Steel, while the USA, UAE and Germany lead in import of products of Iron & Steel.
- The USA stood out as the primary importer of Indian ‘Industrial machinery,’ making up 22% of India’s global exports in this category, followed by China and Germany with 5% ad 4% shares, respectively.
- South Africa, Mexico and Saudi Arab were top importers of India’s Automobiles during April-July 2026 in India’s global exports respectively over the same period previous fiscal.
- USA, China, South Korea and Saudi Arab were the top importers of India’s Non-ferrous metals and products during April-July 2026.
- USA, Singapore and UK were the top importers of Indian Electrical Machinery & Components during the same period with 18%, 11% and 8% shares, respectively.
- USA, France, Maldives, UK and Germany were the top importers of India’s Aircrafts and Spacecraft during April-July 2026, making up to 71% of India’s total export of Aircrafts and Spacecraft.
- UAE, Singapore and Sri Lanka became the largest importer of ships, boats and floating structures during April- July 2026 in India’s global exports respectively over the same period previous fiscal.
- For the auto components’ product group, USA remained the top importer in April-July 2026 followed by Germany, Brazil, Mexico and Bangladesh.
ANNEXURE-II
ENGINEERING PRODUCT PANELS – SHARE %
We now analyze the performance of some of the important products by computing the share of product panels in total engineering exports during the fiscal April-July 2026.
Engineering Product Panel – Share% (Value in US$ million)
| Product panels | April-July 2025 | April-July 2026 | Growth% | Share% |
| Electric Machinery And Equipment | 5230.62 | 6396.88 | 22.3% | 13.79% |
| Iron And Steel | 3195.10 | 4210.11 | 31.8% | 9.08% |
| Motor Vehicle/Cars | 3336.26 | 3862.70 | 15.8% | 8.33% |
| Products Of Iron And Steel | 3485.18 | 3440.98 | -1.3% | 7.42% |
| Indl. Machnry For Dairy Etc | 2952.43 | 3099.00 | 5.0% | 6.68% |
| Aluminium, Products Of Aluminm | 2027.85 | 3083.74 | 52.1% | 6.65% |
| Auto Components/Parts | 2880.52 | 3052.62 | 6.0% | 6.58% |
| Ship, Boat And Floating Structure | 1612.41 | 2717.00 | 68.5% | 5.86% |
| Other Misc. Engineering Items | 1741.06 | 1951.96 | 12.1% | 4.21% |
| Two And Three Wheelers | 1214.79 | 1563.65 | 28.7% | 3.37% |
| Copper And Prdcts Made Of Copr | 798.07 | 1468.45 | 84.0% | 3.17% |
| IC Engines And Parts | 1417.01 | 1415.76 | -0.1% | 3.05% |
| Other Construction Machinery | 1117.45 | 1281.89 | 14.7% | 2.76% |
| Auto Tyres And Tubes | 1074.05 | 1123.35 | 4.6% | 2.42% |
| Atm, Injctng Mlding Mchnry Etc | 1029.78 | 1050.57 | 2.0% | 2.26% |
| Medical And Scientific Instrument | 952.18 | 1010.82 | 6.2% | 2.18% |
| AC, Refrigeration Machnry Etc | 744.87 | 802.80 | 7.8% | 1.73% |
| Othr Rubber Prodct Excpt Footw | 631.63 | 675.22 | 6.9% | 1.46% |
| Aircraft, Spacecraft And Parts | 538.22 | 618.79 | 15.0% | 1.33% |
| Pumps Of All Types | 524.32 | 552.09 | 5.3% | 1.19% |
| Oth Non Ferous Metal And Prodct | 351.70 | 397.44 | 13.0% | 0.86% |
| Hnd Tool, Cttng Tool Of Metals | 355.93 | 374.50 | 5.2% | 0.81% |
| Cranes, Lifts And Winches | 375.25 | 366.41 | -2.4% | 0.79% |
| Nucler Reactr, Indl Boilr, Prt | 308.23 | 363.86 | 18.1% | 0.78% |
| Zinc And Products Made Of Zinc | 199.91 | 310.75 | 55.4% | 0.67% |
| Machine Tools | 304.41 | 293.92 | -3.4% | 0.63% |
| Lead And Products Made Of Led | 345.83 | 276.23 | -20.1% | 0.60% |
| Railwy Trnsprt Equipmnts, Prts | 138.24 | 233.21 | 68.7% | 0.50% |
| Bicycle And Parts | 153.12 | 166.16 | 8.5% | 0.36% |
| Office Equipments | 125.06 | 113.45 | -9.3% | 0.24% |
| Nickel, Product Made Of Nickel | 54.95 | 70.93 | 29.1% | 0.15% |
| Tin And Products Made Of Tin | 9.70 | 26.34 | 171.5% | 0.06% |
| Prime Mica And Mica Products | 10.78 | 11.18 | 3.7% | 0.02% |
| Project Goods | 0.42 | 0.61 | 46.7% | 0.001% |

© Copyright , All rights reserved. Design by Andreal