







VOL. 19, ISSUE NO. 5 | August 2026

Oversight





ENGINEERING TRADE ANALYSIS
FOR JUNE 2026
Engineering exports grewby an impressive 18 percent in the first quarter of fiscal 2026-27

Source: Compiled from data by DGCI&S and Quick Estimates published by the Government of India
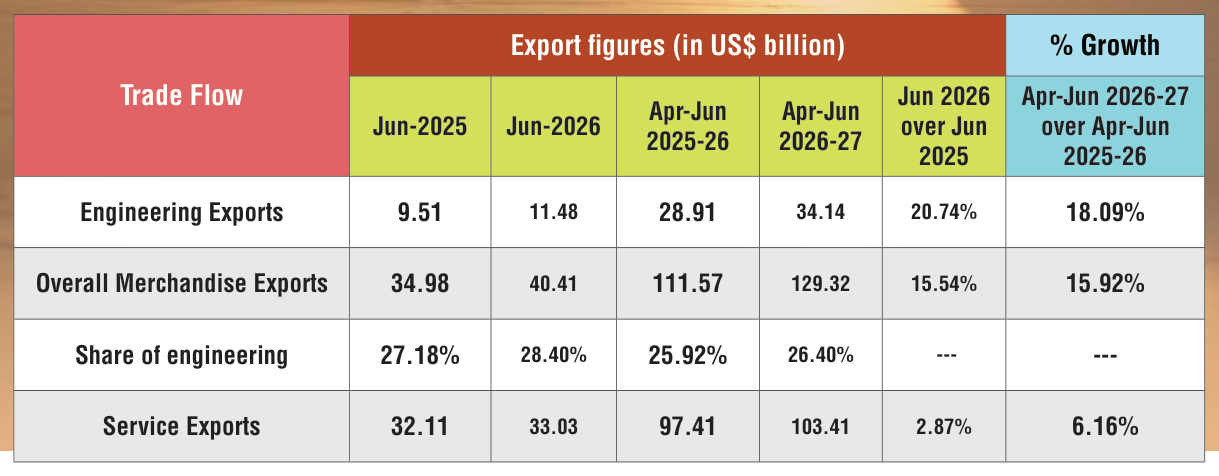
The first quarter of fiscal 2026-27 saw engineering exports grew by an impressive 18.09 percent over the same period last fiscal even amid geo-political uncertainty along major trade route of India in the West Asian region. During June 2026, engineering exports from India was recorded at USD 11.48 billion as against USD 9.51 billion in June 2025, securing a growth as high as 20.74 percent. In all months of the first quarter of the current fiscal, Indian engineering exports were well above USD 10 billion that was really a reason to cheer for the Indian engineering community. On a cumulative basis, Indian engineering shipment stood at USD 34.14 billion during April-June 2026-27 as against USD 28.91 billion during the same quarter last fiscal with a growth of 18.09 percent. As per the Quick Estimates of the Government, share of engineering in India’s total merchandise exports was recorded at 28.4 percent during June 2026 while on a cumulative basis, the share was 26.4 percent during the first quarter of 2026-27 showing an increasing trend over the years. This noteworthy performance of Indian engineering exports during the first quarter was attributed to high growth in exports of Ships, boats and floating structure; Aluminium and its products; Electric machinery and equipment; Copper and its products; Iron and steel, and Automobile among others. Regionwise analysis also showed an encouraging picture where exports to all the regions increased on a year-on-year basis led by North America, EU and WANA sharing more than half of India’s global engineering exports. Among the top destination countries, exports to USA, UAE, UK and Germany recorded moderate to strong year-on-year growth during April-June 2026-27 but Singapore and Saudi Arabia conceded decline in engineering import from India during the same time period. Engineering exports to China reached USD 1 billion during the first quarter of 2026-27 securing a growth of as high as 72 percent over the same quarter of last fiscal.
HIGHLIGHTS
- The first quarter of fiscal 2026-27 saw engineering exports grew by an impressive 18.09 percent over the same period last fiscal even amid geo-political uncertainty along major trade route of India in the West Asian region.
- In all months of the first quarter of the current fiscal, Indian engineering exports were well above USD 10 billion that was really a reason to cheer for the Indian engineering community.
- During June 2026, engineering exports from India was recorded at USD 11.48 billion as against USD 9.51 billion in June 2025, securing a growth as high as 20.74 percent.
- On a cumulative basis, Indian engineering shipment stood at USD 34.14 billion during AprilJune 2026-27 as against USD 28.91 billion during the same quarter last fiscal with a growth of 18.09 percent.
- As per the Quick Estimates of the Government, share of engineering in India’s total merchandise exports was recorded at 28.4 percent during June 2026 while on a cumulative basis, the share was 26.4 percent during the first quarter of 2026-27 showing an increasing trend over the years.
- In June 2026, 27 out of 34 engineering panels witnessed positive year-on-year growth. While 7 engineering panels including, Lead and products, IC Engines, Machinery for ATMs, Cranes, Lifts and Winches, Office Equipments, prime mica witnessed year-on-year decline in exports.
- On a cumulative basis too, 29 out of 34 engineering panels recorded growth and remaining 5 engineering panels including, Lead and products, IC Engines, Cranes, Lifts and Winches, Office Equipments and prime mica recorded negative growth during April-June 2026-27.
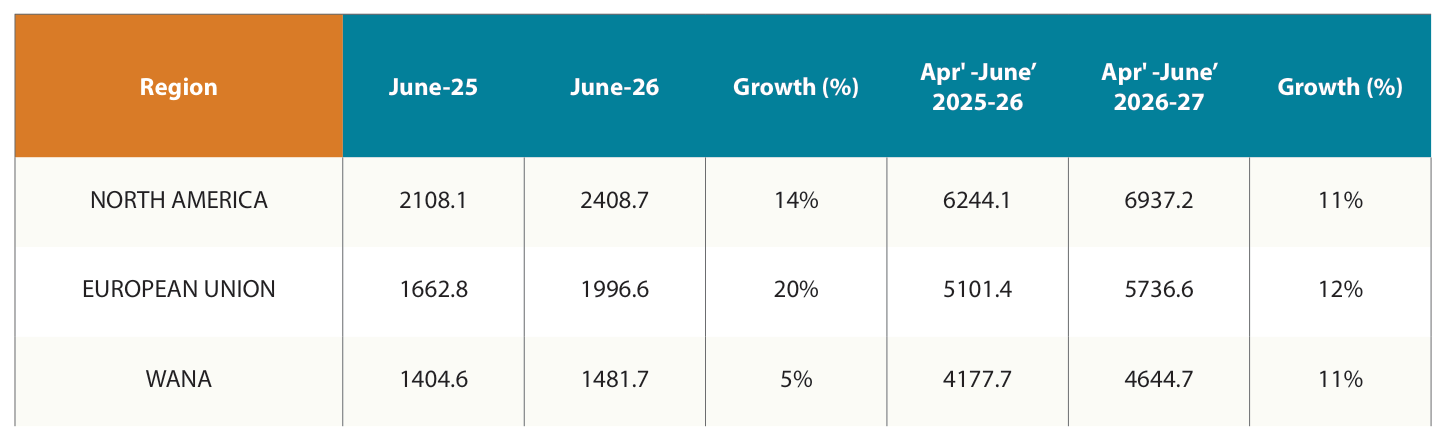
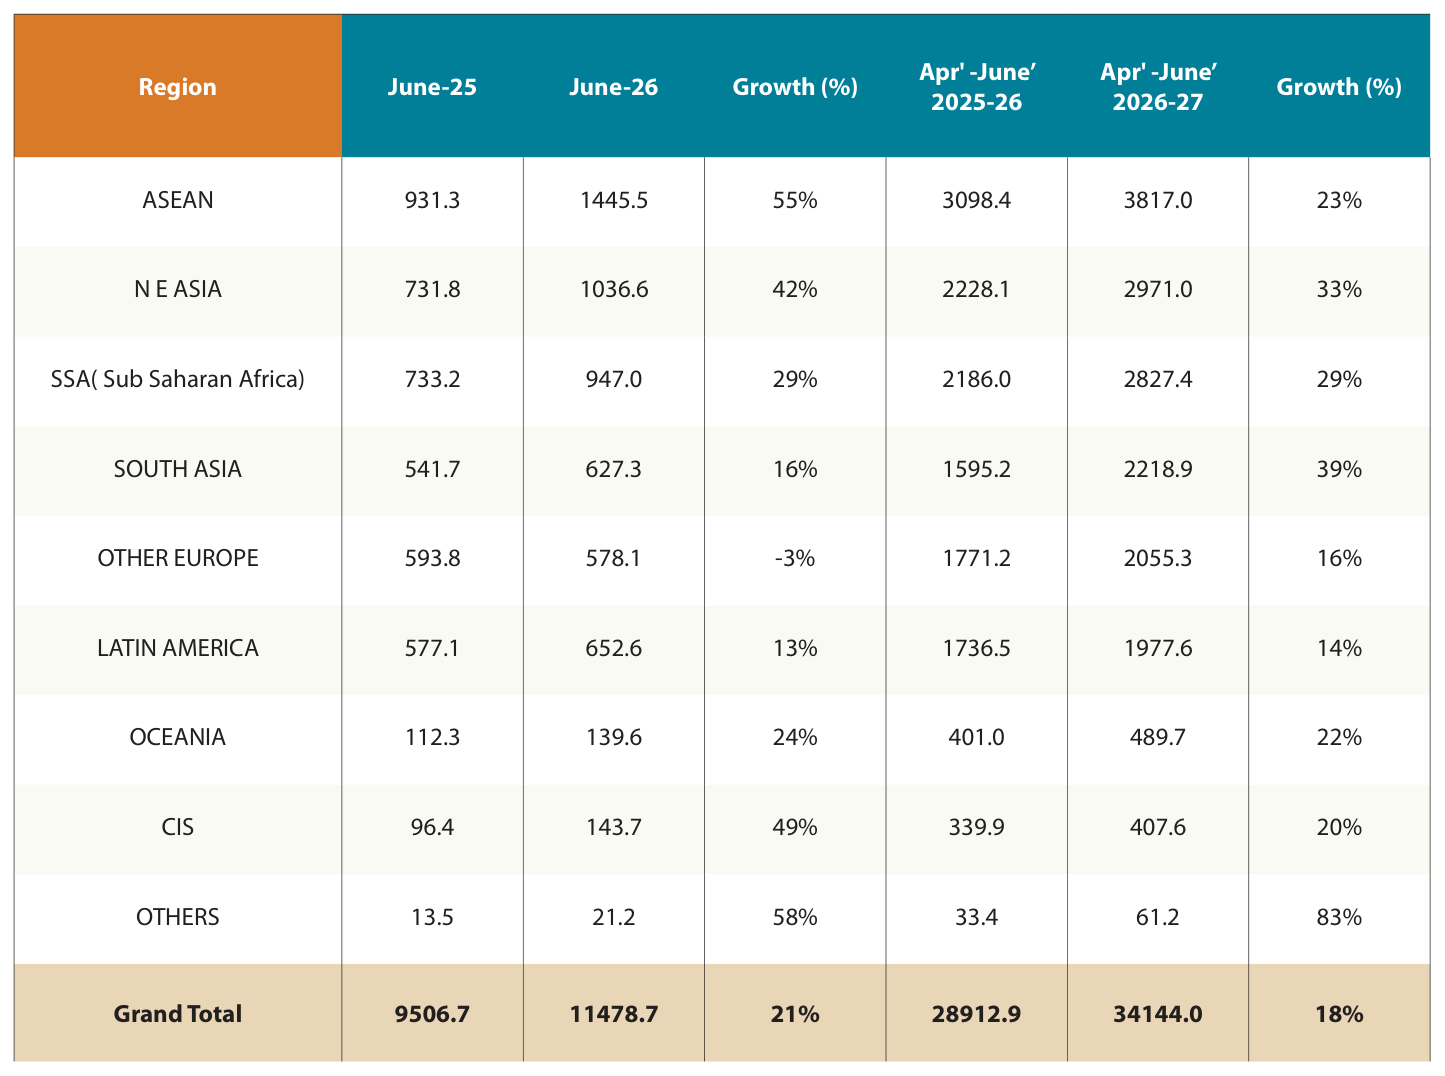
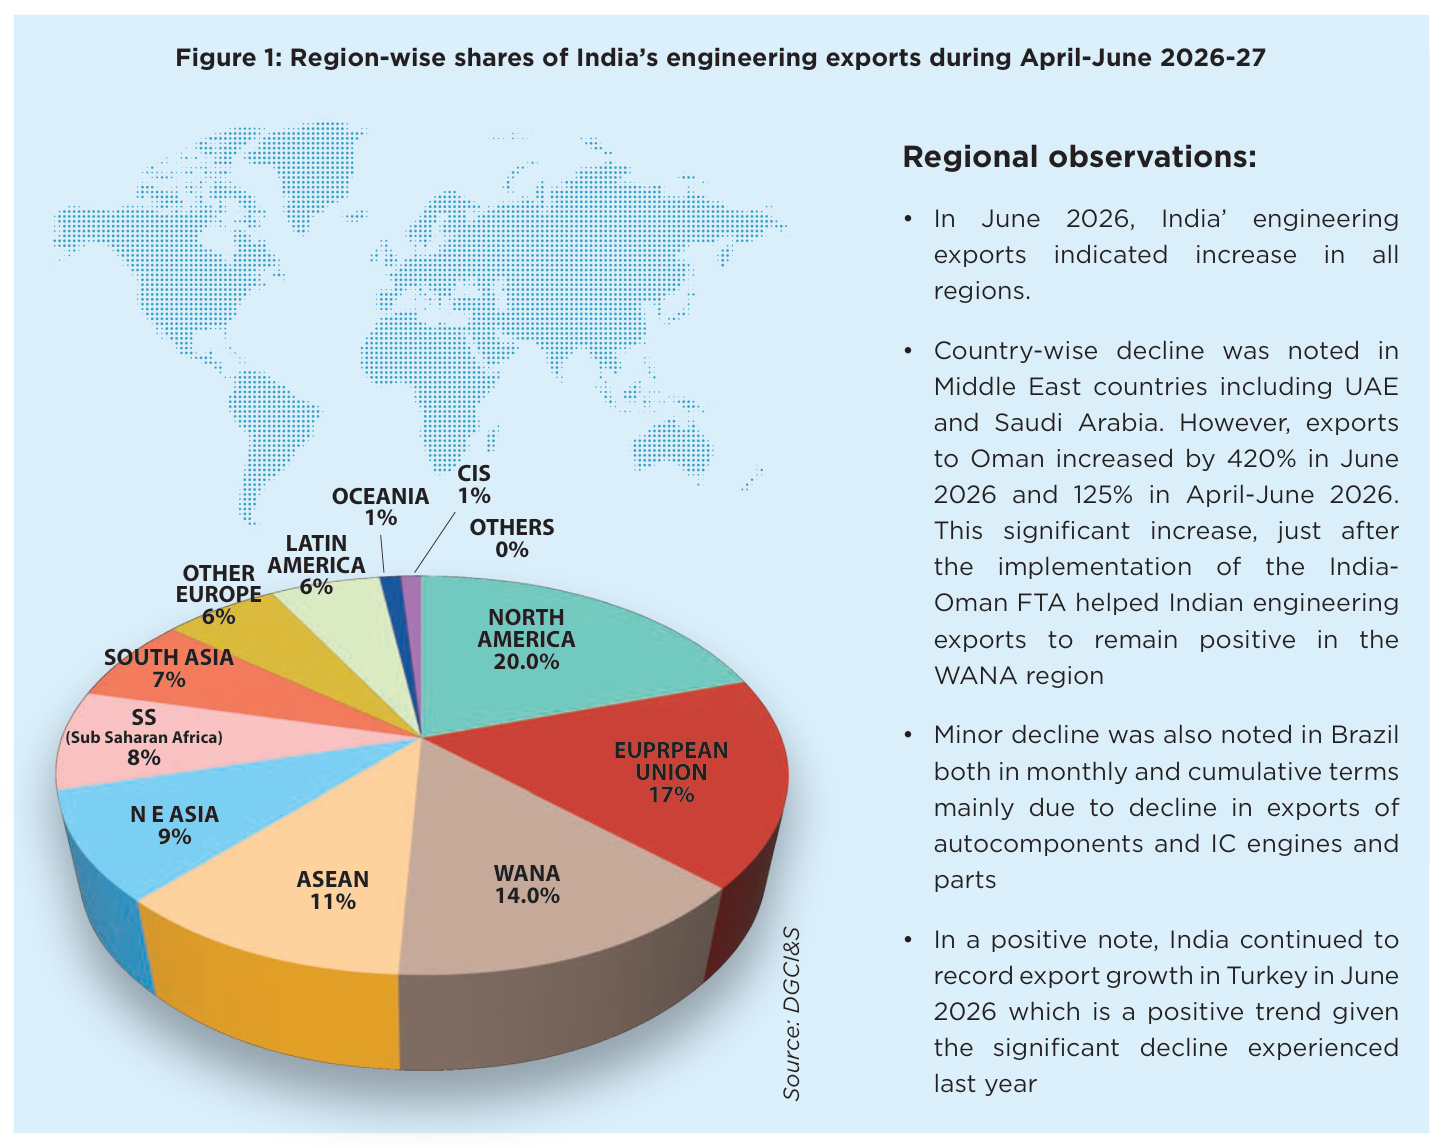
- Region wise analysis showed that engineering exports to all regions recorded growth during the first quarter of fiscal 2026-27 over the same quarter last fiscal. North America continued to account for the largest share of Indian engineering exports (20%) followed by EU (17%), WANA (14%), ASEAN (11%) and North East Asia (9%).
- Even at the time of Geopolitical crisis in the West Asia, engineering exports to WANA increased by 11percent during Apr-Jun 2026-27.
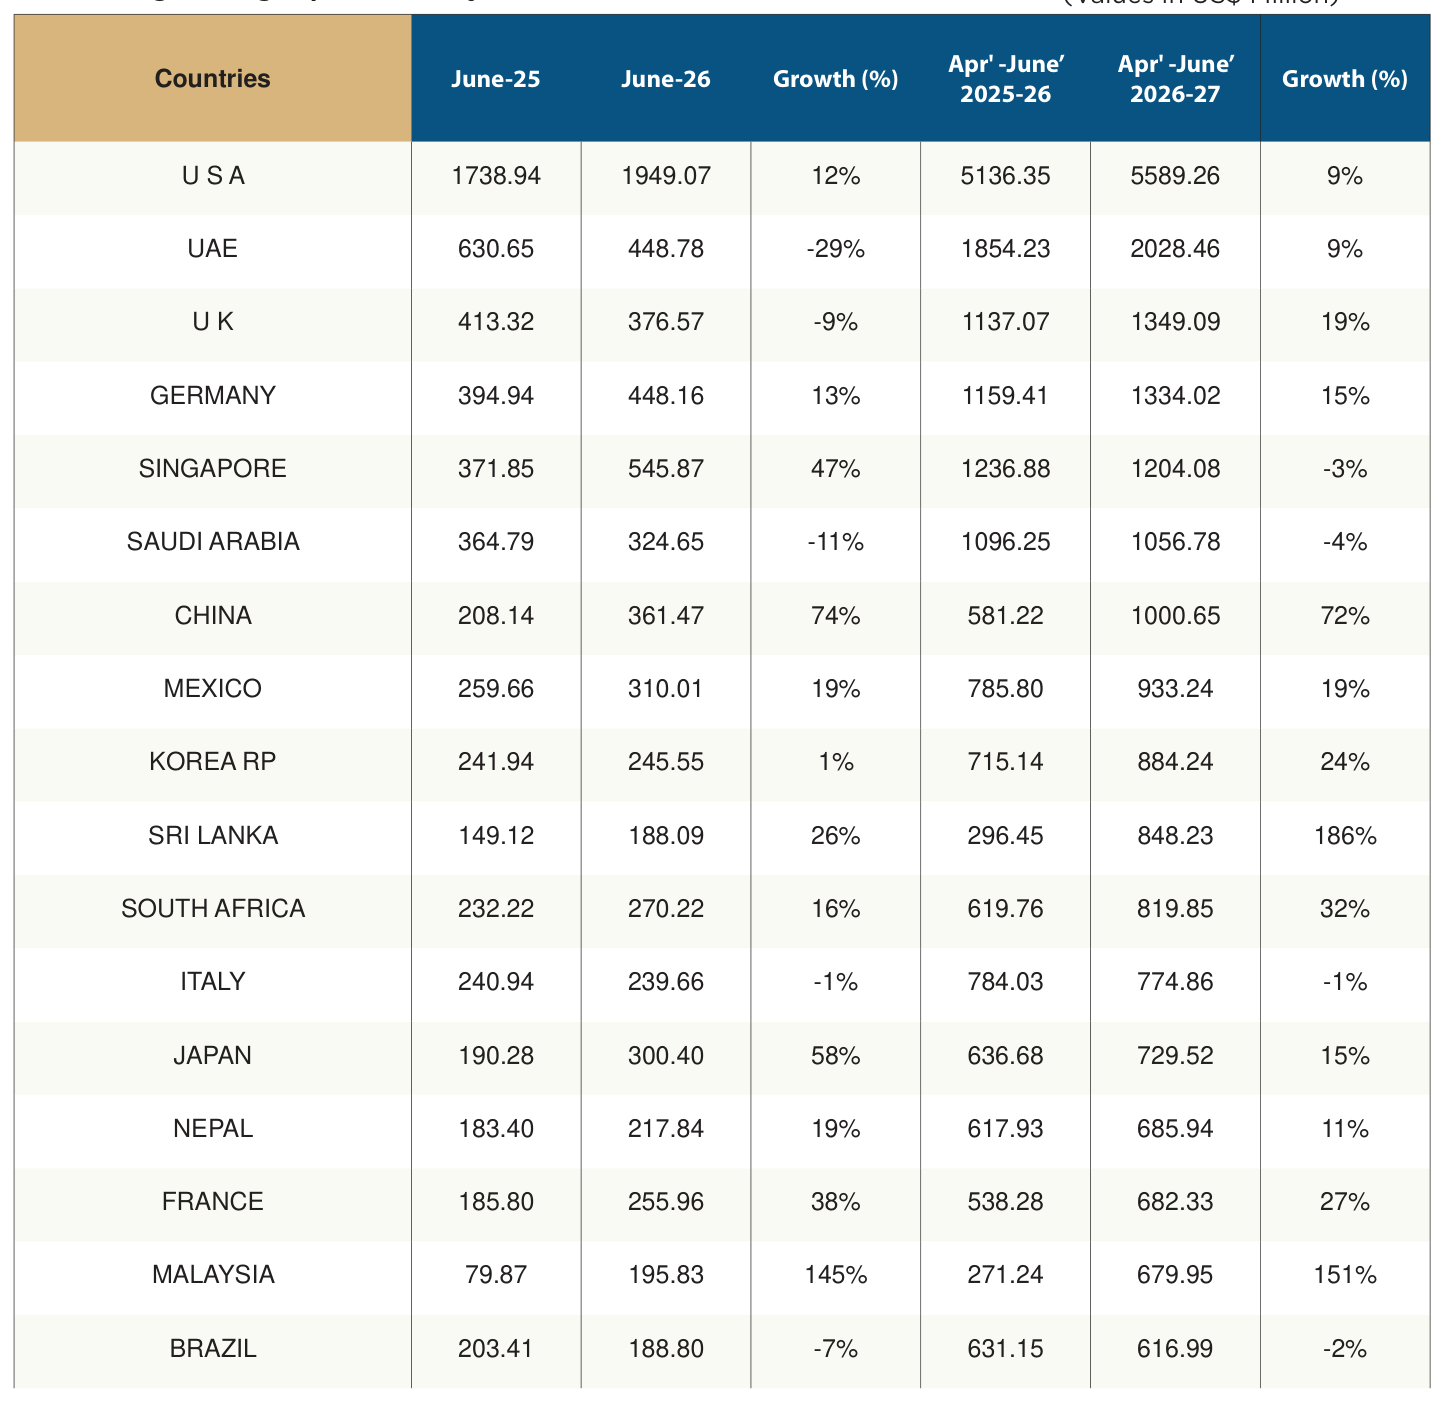
- Country-wise, USA continued to remain the top destination for Indian engineering exports in April-June 2026-27 as it recorded an export of 5.59 billion. The y-o-y growth from USA is recorded at a decent 9%.
- Country wise analysis also showed that engineering exports to all top destinations namely USA, UAE, UK and Germany recorded decent to high growth during the first quarter of fiscal 2026-27 but shipments to Singapore and Saudi Arabia dropped on a yearon-year basis.
ENGINEERING EXPORTS: MONTHLY TREND
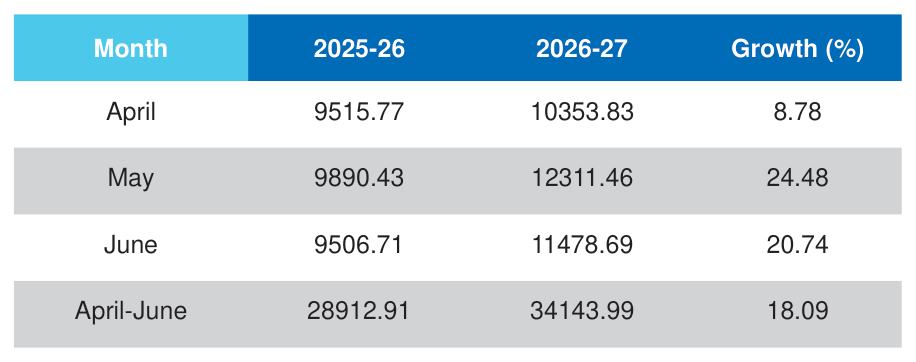
The monthly engineering export figures for 2026-27 vis-à-vis 2025-26 are shown below as per the latest DGCI&S estimates:
Table 1: Engineering Exports: Monthly Trend in 2026-27 (Values in US$ million)
Source: DGCI&S, Govt. of India
TOP 25 ENGINEERING EXPORT DESTINATIONS IN JUNE 2026
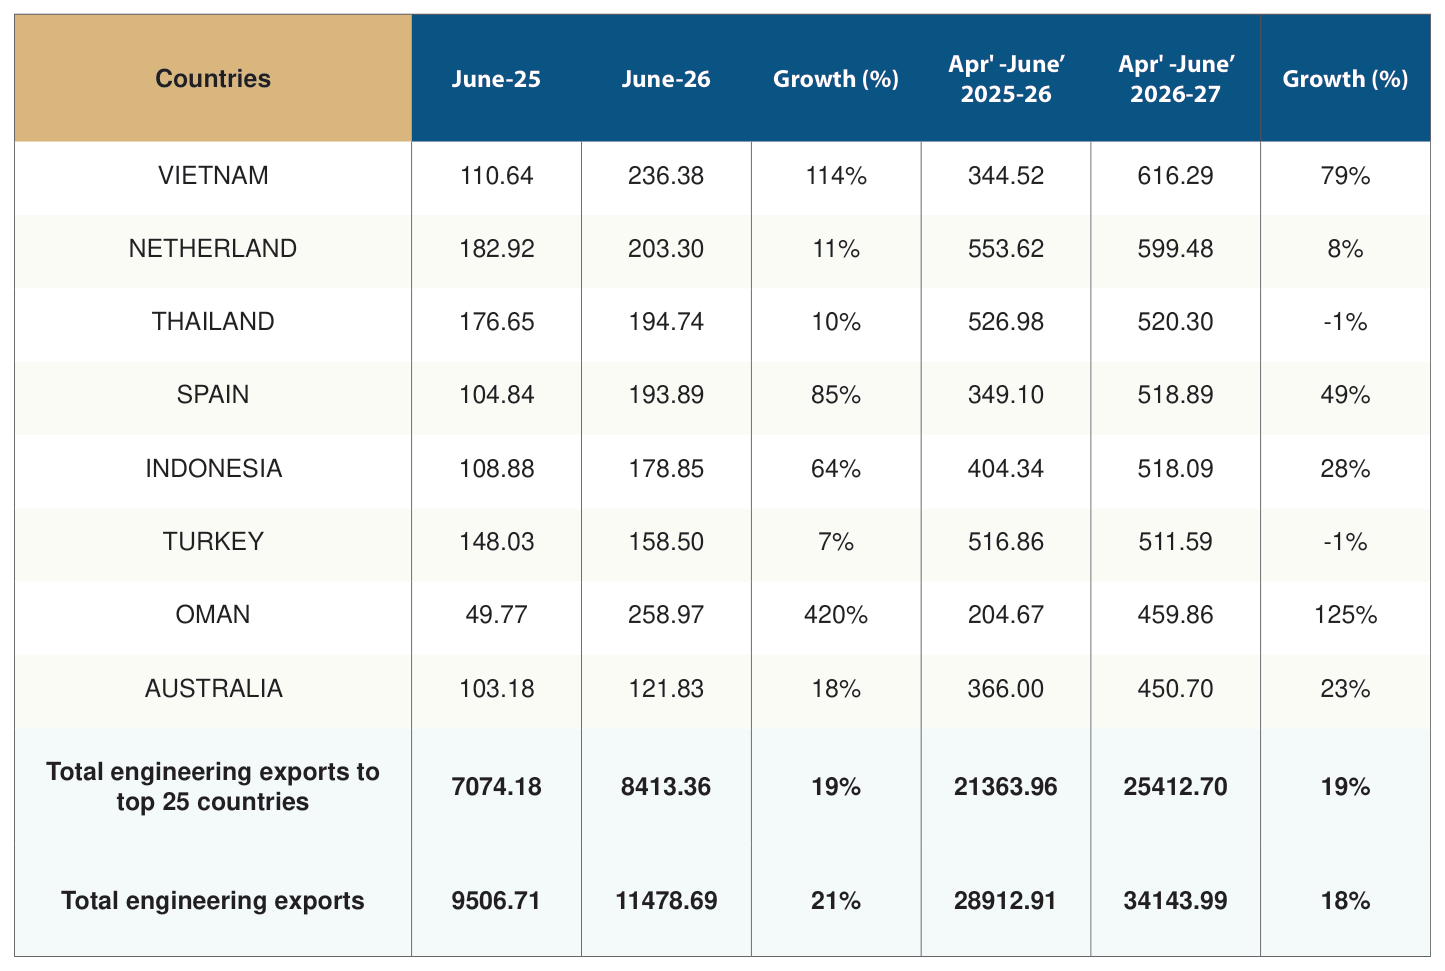
We now look at the export scenario of the top 25 nations that had highest demand for Indian engineering products during June 2026 over June 2025 as well as in cumulative terms during April-June 2026-27 vis-à-vis April-June 202526. The data clearly shows that top 25 countries contribute more than 75 % of total engineering exports.
Table 2: Engineering exports country-wise (Values in US$ Million)
Source: DGCI&S
REGION WISE INDIA’S ENGINEERING EXPORTS
The following table depicts region wise India’s engineering exports for April-June 2026 as compared to April-June 2025
Table 3: Region wise engineering exports in April-June 2026-27 vis-à-vis April-June 2025-26 (Values in US$ Million)
Source: DGCI&S
Note: Myanmar has been included in ASEAN and not in South Asia, since ASEAN is a formal economic grouping.
PANEL WISE INDIA’S ENGINEERING EXPORTS
The following table depicts region wise India’s panel wise engineering exports for May 2026 as compared to May 2025
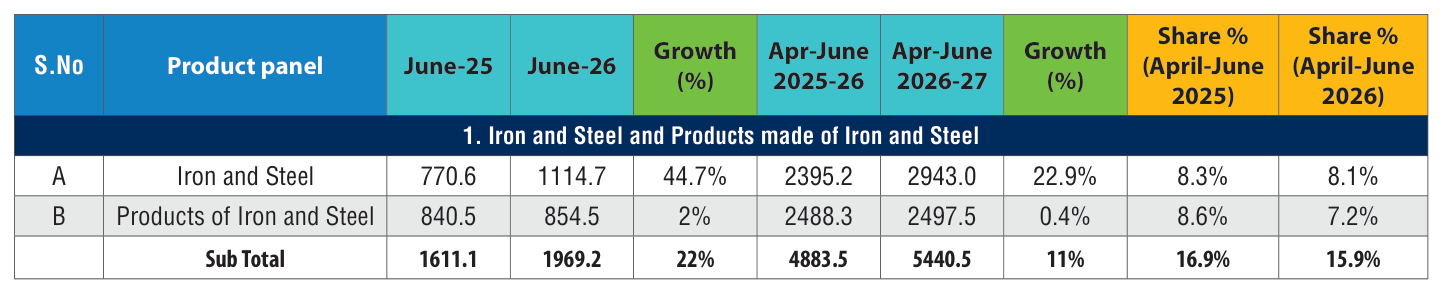
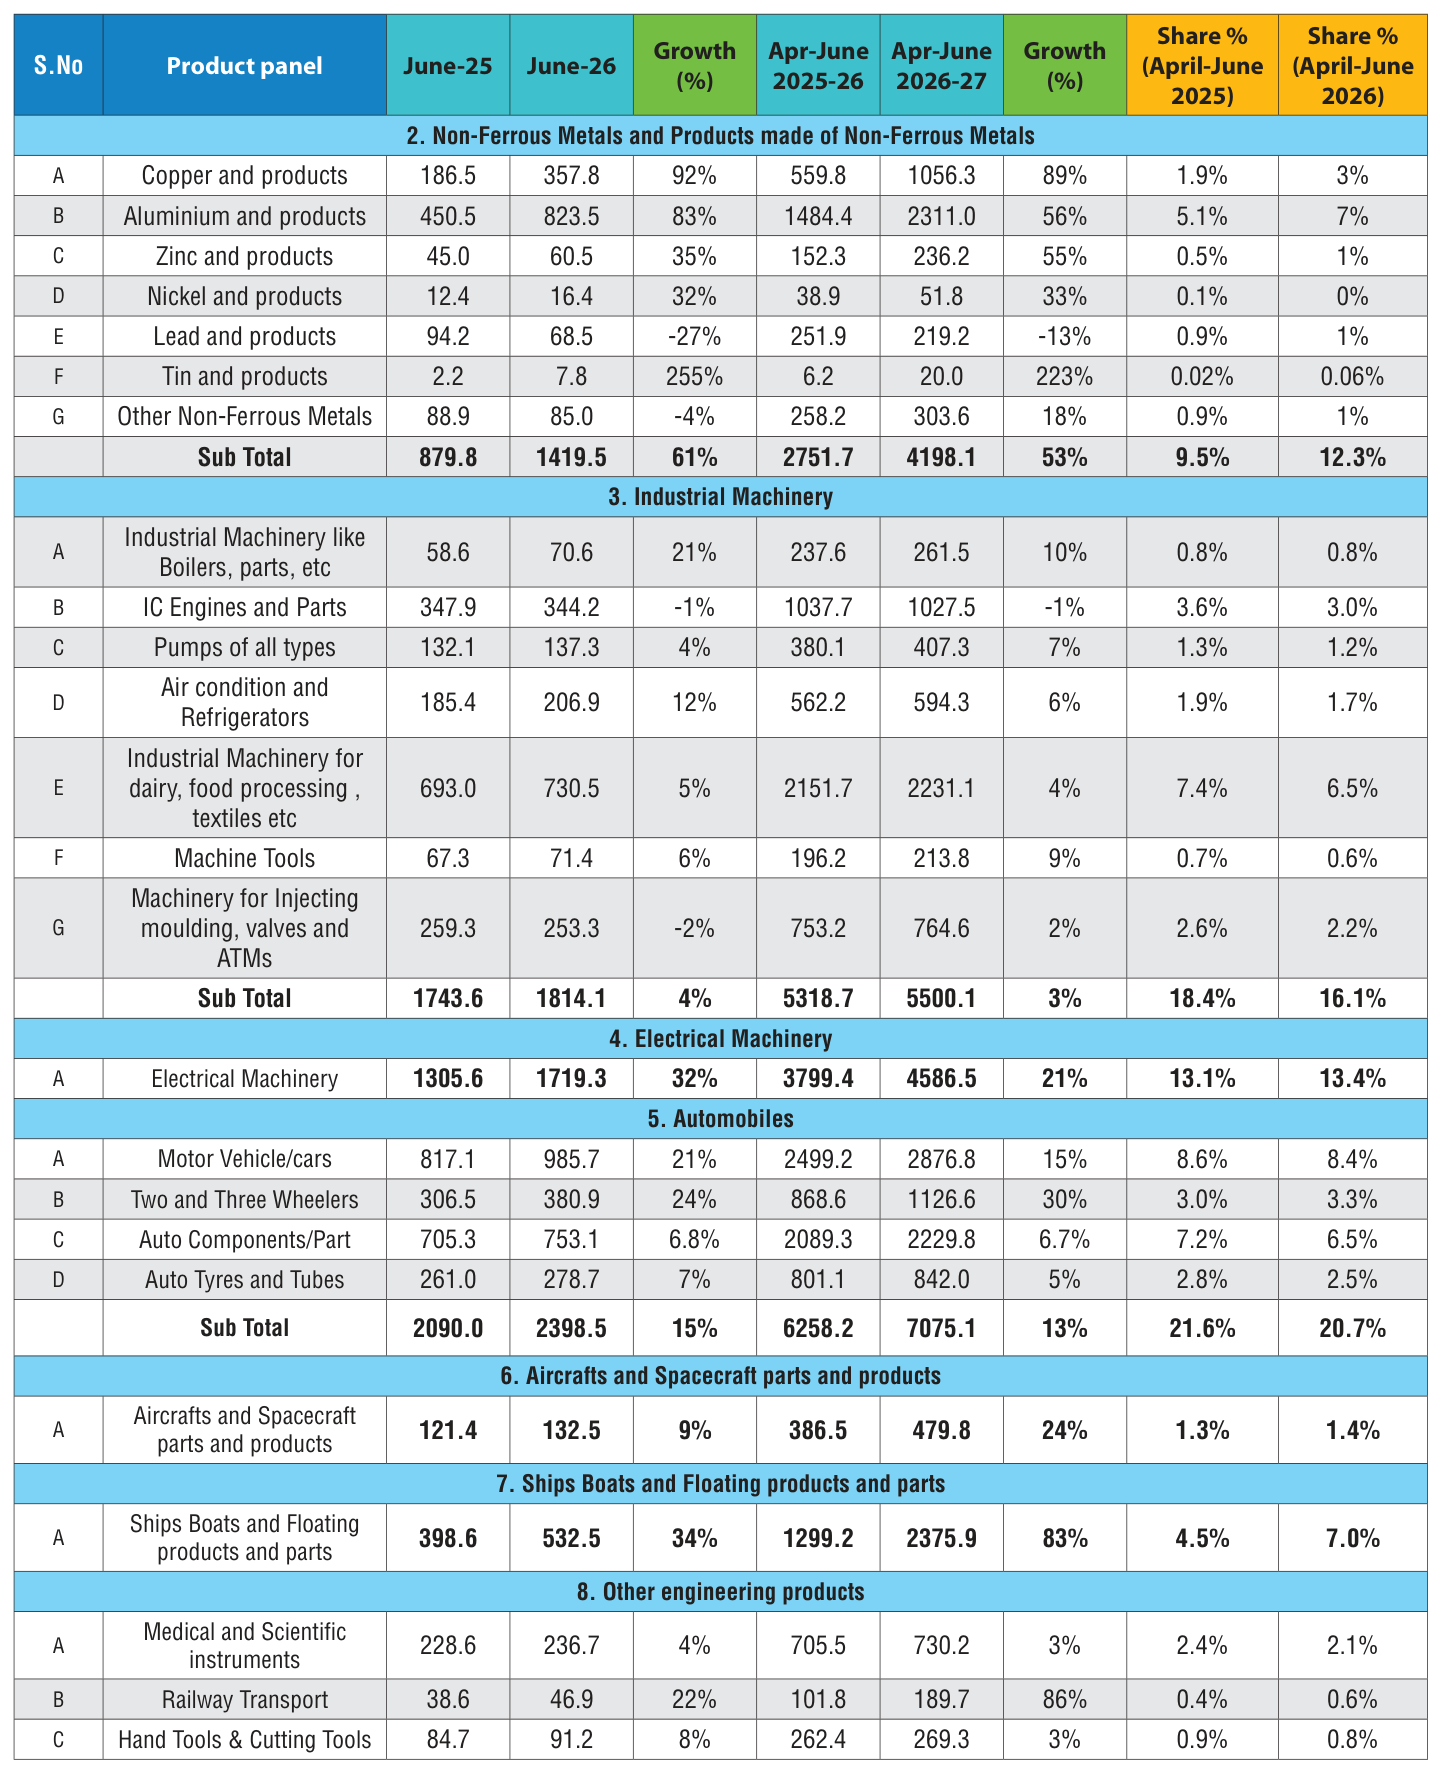
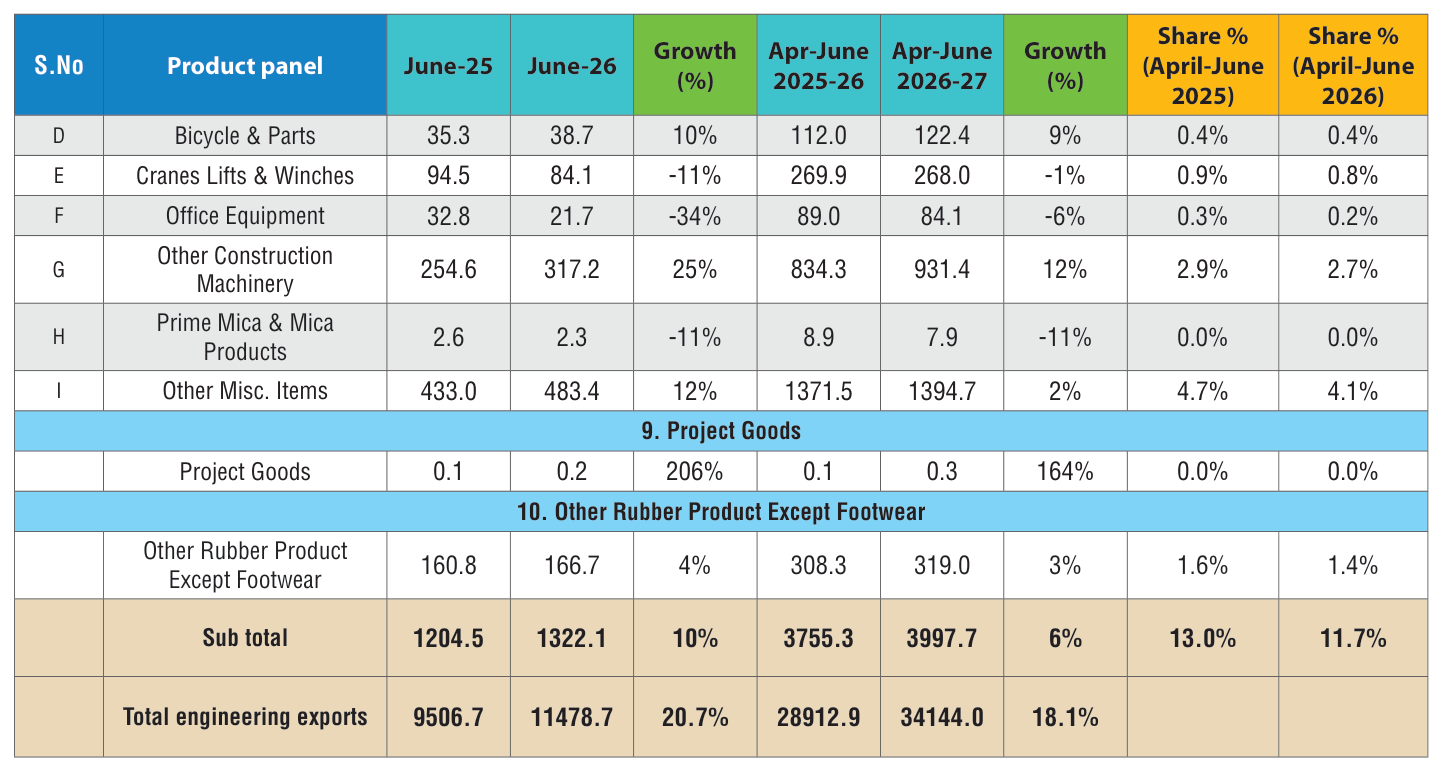
Table 4: Panel wise engineering exports in April-June 2026-27 vis-à-vis April-June 2025-26 (US Mn)
Sectoral Observations:
India’s engineering exports grew by about 18.1% in April–June 202627 to around US$34.14 billion, with mixed performance across panels:
a. Exports of iron and steel rose by 11% during April–June 2026-27, supported by higher shipments of primary steel growing by 22.9%, while products of iron and steel witnessed a marginal increase of 0.4% Overall, India’s steel exports rose 11% to US$5.44 billion during April–June 202627, supported by strong demand from the USA, Nepal, Vietnam, UAE, UK and EU markets (Italy, Netherland, Belgium), and Korea Rep.
b. As per the latest Ministry of Steel estimates, during April to June FY 2026-27, India remained a net importer of steel, with imports exceeding exports by 0.47 million tonnes, as finished steel imports stood at 2.06 million tonnes against exports of 1.59 million tonnes. In June 2026, steel exports increased to 0.62 million tonnes from 0.51 million tonnes in May 2026, while imports also rose marginally to 0.70 million tonnes from 0.69 million tonnes during the same period. On the pricing front, iron ore prices increased in June 2026 compared with the previous month, with NMDC iron ore lump prices reaching ₹5,700 per tonne. Meanwhile, domestic steel prices softened in June 2026, with retail prices of TMT, HRC and CRC declining by 6.7%, 1.2% and 0.1%, respectively, compared with May 2026.
c. Again non-ferrous panel emerged as a significant growth driver as copper, aluminum, zinc, nickel and tin indicated double-digit export growth. Decline was only noted in lead and lead products
ENGINEERING EXPORTS – STATE-WISE ANALYSIS (April-June 2026-27)
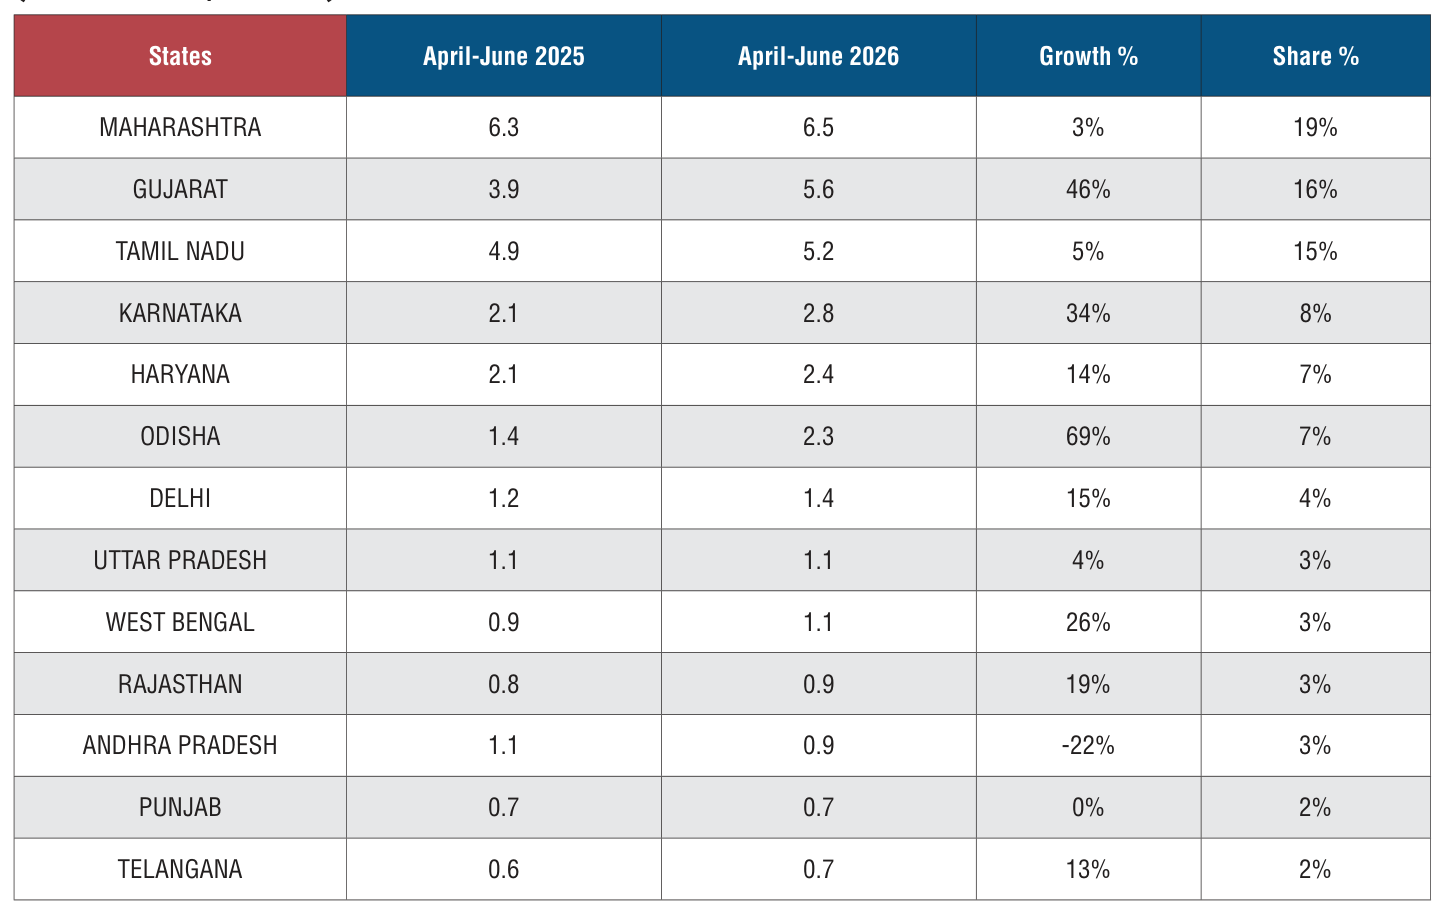
Table 5: India’s top states constituting 91% of India’s engineering exports (value in US$ billion)
Source: DGCI&S
India’s state-wise engineering exports during April-June 2026-27 reflect robust growth with significant contributions from western and southern states. Maharashtra remained the largest engineering exporting state, with exports rising to USD 6.5 billion, accounting for 19% of India’s total engineering exports, although growth was relatively modest at 3%. Gujarat emerged as the strongest growth driver among the top exporting states, with exports surging 46% to USD 5.6 billion, capturing a 16% share. Tamil Nadu retained its position as the third-largest exporter, registering 5% growth to USD 5.2 billion and contributing 15% to the country’s engineering exports. Karnataka and Odisha also recorded impressive growth of 34% and 69%, respectively, highlighting the increasing diversification of India’s engineering export base

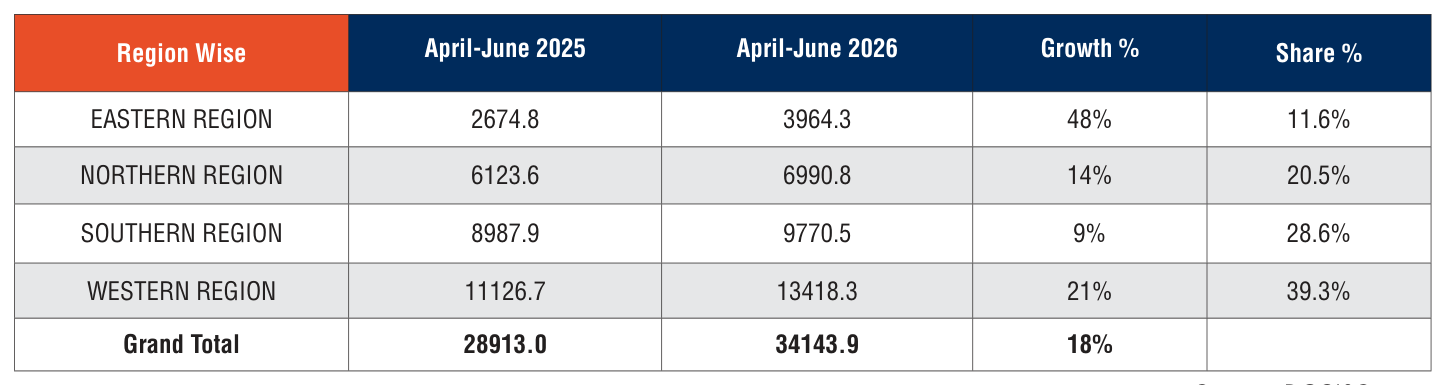
Table 6: Region Wise Engineering Exports (Value in US$ million)
Source: DGCI&S
India’s region-wise engineering exports during April–June 2026 registered a strong growth of 18%, increasing to US$ 34.14 billion from US$ 28.91 billion in the corresponding period of the previous year. The Western Region continued to dominate India’s engineering exports, with shipments rising by 21% to US$ 13.42 billion, accounting for the largest 39.3% share of total exports.
The Southern Region remained the second-largest contributor, recording exports of US$ 9.77 billion, a growth of 9% over AprilJune 2025, and accounting for 28.6% of total engineering exports. The Northern Region posted a healthy growth of 14%, with exports increasing to US$ 6.99 billion, contributing 20.5% to the national total.
The Eastern Region emerged as the fastest-growing region, registering an impressive 48% increase in engineering exports to US$ 3.96 billion. Its share in total exports rose to 11.6%, reflecting growing export momentum from the region.
Overall, India’s engineering export performance during April-June 2026 was driven by broad-based growth across all regions, with the Western Region retaining its leadership position while the Eastern Region demonstrated the strongest pace of expansion.
Key Products driving exports in top states:
- Maharashtra: Export performance was driven by industrial machinery (USD 641 million), products of iron & steel (USD 580 million), iron & steel (USD 572 million), electric machinery (USD 555 million), motor vehicles (USD 528 million) and auto components (USD 492 million), reinforcing its position as India’s largest engineering exporting state.
- Tamil Nadu: Exports were led by motor vehicles (USD 766 million), auto components (USD 618 million), electric machinery (USD 595 million) and industrial machinery (USD 434 million). In addition, ship, boat and floating structures (USD 310 million) emerged as a key growth segment during the period.
- Gujarat: The state’s export surge was driven primarily by ship, boat and floating structures (USD 1,284 million), followed by motor vehicles (USD 697 million), products of iron & steel (USD 643 million), industrial machinery (USD 396 million) and copper products (USD 364 million), indicating broad-based expansion across engineering sectors.
- Karnataka: Growth was supported by a significant jump in electric machinery (USD 1,049 million), along with strong exports of aircraft, spacecraft and parts (USD 213 million), iron & steel (USD 177 million), auto components (USD 143 million) and other high-technology engineering products, highlighting the state’s increasing specialization in advanced manufacturing.
- Haryana: Export growth was led by motor vehicles, electric machinery, auto components and industrial machinery, supported by a strong automotive manufacturing ecosystem. The state also recorded notable contributions from two- and three-wheelers, reinforcing its position as a major transport equipment hub
- Odisha: Export growth was overwhelmingly driven by aluminium and aluminium products (USD 1,431 million) and iron & steel (USD 623 million), which together accounted for the bulk of the state’s engineering exports. Additional contributions came from ship, boat and floating structures (USD 156 million) and electric machinery (USD 44 million), reflecting increasing diversification beyond metals.
- West Bengal: Export performance was led by iron & steel (USD 562 million), followed by products of iron & steel (USD 189 million). The state also witnessed notable growth in ship, boat and floating structures (USD 53 million), other non-ferrous metal products (USD 37 million) and aluminium products (USD 35 million), supporting its strong export growth during the period.
Disclaimer: Please note the following disclaimer given by the DGCI&S whereby it is stated that state-wise export figures are based on state of origin code in shipping bills and June not give the right estaimate.An tuscio, cles hos confeco nesederehem renam nont in hostion ina,
CORRELATION BETWEEN MANUFACTURING OUTPUT AND ENGINEERING EXPORTS
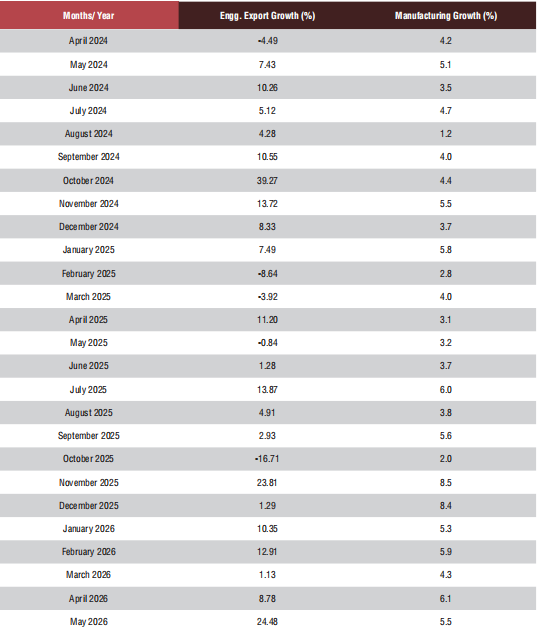
Engineering forms a considerable part of the broader manufacturing sector and the share of engineering production in overall manufacturing output is quite significant. As exports generally come from what is produced within a country, some correlation between manufacturing production growth and engineering export growth should exist. We briefly look at the trend in manufacturing growth as also engineering export growth to see if they move in tandem. It may be mentioned that manufacturing has 77.63% weightage in India’s industrial production.
Engineering export growth and manufacturing output growth moved in the same direction in as many as nine out of twelve months in each of the fiscal years 2019-20 and 2020-21. During fiscal 202122, engineering export growth and manufacturing growth moved in the same direction in seven out of twelve months while in each of fiscal 2022-23 and 2023-24, as many as 10 out of 12 months saw engineering exports and manufacturing output moved in the same direction. In 2024-25, both moved in the same direction in eight out of 12 months and in202526, both engineering export growth and manufacturing growth moved in the same direction in seven out of 12 months.
The first month of fiscal 2026-27 saw manufacturing output growth (new series with base year 202223) engineering export growth and moved in the same direction with both securing higher growth over the previous month. May 2026, however witnessed higher engineering export growth but moderated manufacturiong output growth.
The link between these two may not be established in one or two months, but a positive correlation may be seen if medium to long term trend is considered.
Table 7: Engineering exports growth vis-à-vis manufacturing growth from April 2024
Source: Department of Commerce and MOSPI, Govt. of India
IMPACT OF EXCHANGE RATE ON INDIA’S EXPORTS
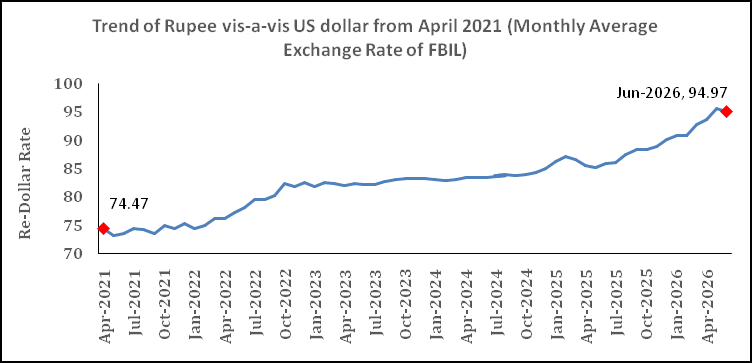
How did the exchange rate fare during June 2026 and what was the recent trend in Re-Dollar movement? In order to get a clearer picture of the recent Re-Dollar trend, not only we took the exchange rate of June 2026, but also considered monthly average exchange rate of Rupee vis-à-vis the US Dollar for each month of fiscal 2024-25 and fiscal 2025-26 as per the latest data published, as mere one-month figure does not reflect any trend. The following two tables clearly depicts the short-term trend.
Table 8: USD-INR monthly average exchange rate in 2026-27 vis-à-vis 2025-26 (As per latest data released by FBIL)
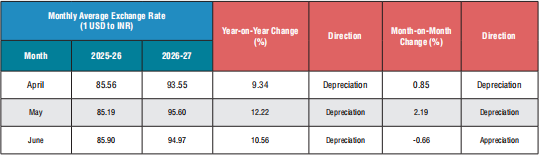
Indian Rupee appreciated by 0.7 percent in June 2026 over the month vis-à-vis the US dollar. On a yearly basis however, the depreciation continued. Marginal appreciation in June 2026 was led by falling global crude price and active intervention by the RBI.
Throughout the month, the INR saw a series of gains backed by strong foreign portfolio inflows and steady debt investments.
Table 9: USD-INR monthly average exchange rate in 2025-26 vis-à-vis 2024-25 (As per latest data released by FBIL)
| Monthly Average Exchange Rate (1 USD to INR) | Year-on-Year Change (%) | Direction | Month-on-Month Change (%) | Direction | ||
| Month | 2024-25 | 2025-26 | ||||
| April | 83.41 | 85.56 | 2.58 | Depreciation | -1.25 | Appreciation |
| May | 83.39 | 85.19 | 2.16 | Depreciation | -0.43 | Appreciation |
| June | 83.47 | 85.90 | 2.91 | Depreciation | 0.83 | Depreciation |
| July | 83.59 | 86.11 | 3.01 | Depreciation | 0.24 | Depreciation |
| August | 83.90 | 87.52 | 4.31 | Depreciation | 1.64 | Depreciation |
| September | 83.81 | 88.32 | 5.38 | Depreciation | 0.91 | Depreciation |
| October | 84.03 | 88.42 | 5.22 | Depreciation | 0.11 | Depreciation |
| November | 84.36 | 88.83 | 5.30 | Depreciation | 0.46 | Depreciation |
| December | 84.99 | 90.09 | 6.00 | Depreciation | 1.42 | Depreciation |
| January | 86.26 | 90.80 | 5.25 | Depreciation | 0.79 | Depreciation |
| February | 87.05 | 90.77 | 4.27 | Depreciation | -0.03 | Appreciation |
| March | 86.64 | 92.76 | 7.06 | Depreciation | 2.19 | Depreciation |
Fig 2: Trend of Rupee vis-a-vis US dollar from April 2021 (Monthly Average Rate of FBIL has been considered)
Source: FBIL

ANALYSIS OF INDIA’S ENGINEERING IMPORTS
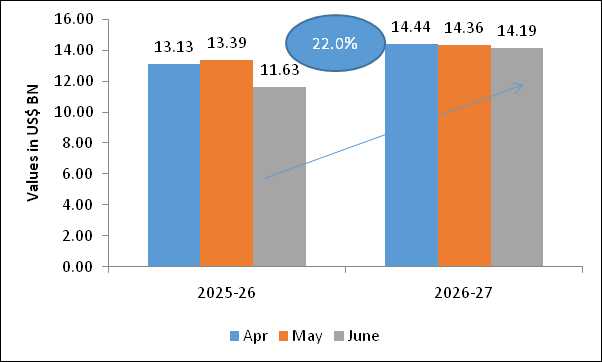
- India’s Engineering imports during June 2026 were valued at US$ 14.2 billion compared to US$ 11.6 billion in June 2025 registering a positive growth of 22 percent in dollar terms. In cumulative terms (Apr-June 2026), India’s imports increased by 12.7 percent.
- In June 2026, imports increased sharply for Two and Three Wheelers , Aircraft Spacecraft & parts, Electric machinery & equipments, Hand Tools & Cutting Tools of Metals , Aluminium & its products, Bicyle& parts, Zinc & Products made of Zinc, Tin & Products made of Tin, Other Construction machinery, Industrial Machinery for dairy, Textiles and etc,along with increase in, Medical & Scientific Instruments.
- In June 2026, import increased from the regions, with significant imports from NE Asia, EU, ASEAN, North America and SSA( Sub Saharan Africa) barring WANA, CIS and Others. In cumulative terms, imports increased from all regions barring CIS &WANA.
- The share of engineering imports in India’s total merchandise imports in Apr-June 2026 was estimated at 20 percent.
- 41.7 % of India’s engineering imports come from N E Asia and 20.8 % from the EU. The next major suppliers are ASEAN (13.0%), North America (8.3%) and WANA (5.4%) during Apr-June 2026.
Fig 3: Monthly Engineering Imports for April-May 2026-27 vis-a-vis April-May2025-26
Source: DGCI&S
TREND IN ENGINEERING TRADE BALANCE
We now present the trend in two-way yearly trade for the engineering sector for the 2026-27 depicted in the table below:
Table 10: Monthly Trend in Engineering Trade Balance for the current FY 2026-27 (US$ Billions)

Source: DGCI&S, EEPC India Analysis
CONCLUSION:
Indian engineering exports continued its growth momentum in the month of June 2026 as it recorded a whopping 21% increase in exports compared to the same period last year. In another achievement, India’s engineering exports exceede USD 10 billion in all the first four months of FY 2026-27. Due to this stellar performance in the first four months of the current fiscal, India’s engineering exports recorded a remarkable 18% growth in cumulative terms. The growth rate surpassed that of merchandise exports both in monthly and cumulative terms. The trend also corroborates the overall positive atmosphere in global trade as reflected by the recently published INCTAD Global Trade Update which indicates that global merchandise trade is estimated to have reached approximately USD13.7 trillion in the first half of 2026, recording a growth of 12.5% over 2025. While this is a positive trend, the UNCTAD report also mentions that the global trade growth although positive will become increasingly uneven due to continuing geopolitical tensions, policy uncertainty and rising trade costs. Therefore, the Indian engineering industry will also have to remain cautious and would need continuous assistance from the Government of India to continue this growth momentum.
ENGINEERING PRODUCT PANELS – COUNTRY-WISE ANALYSIS
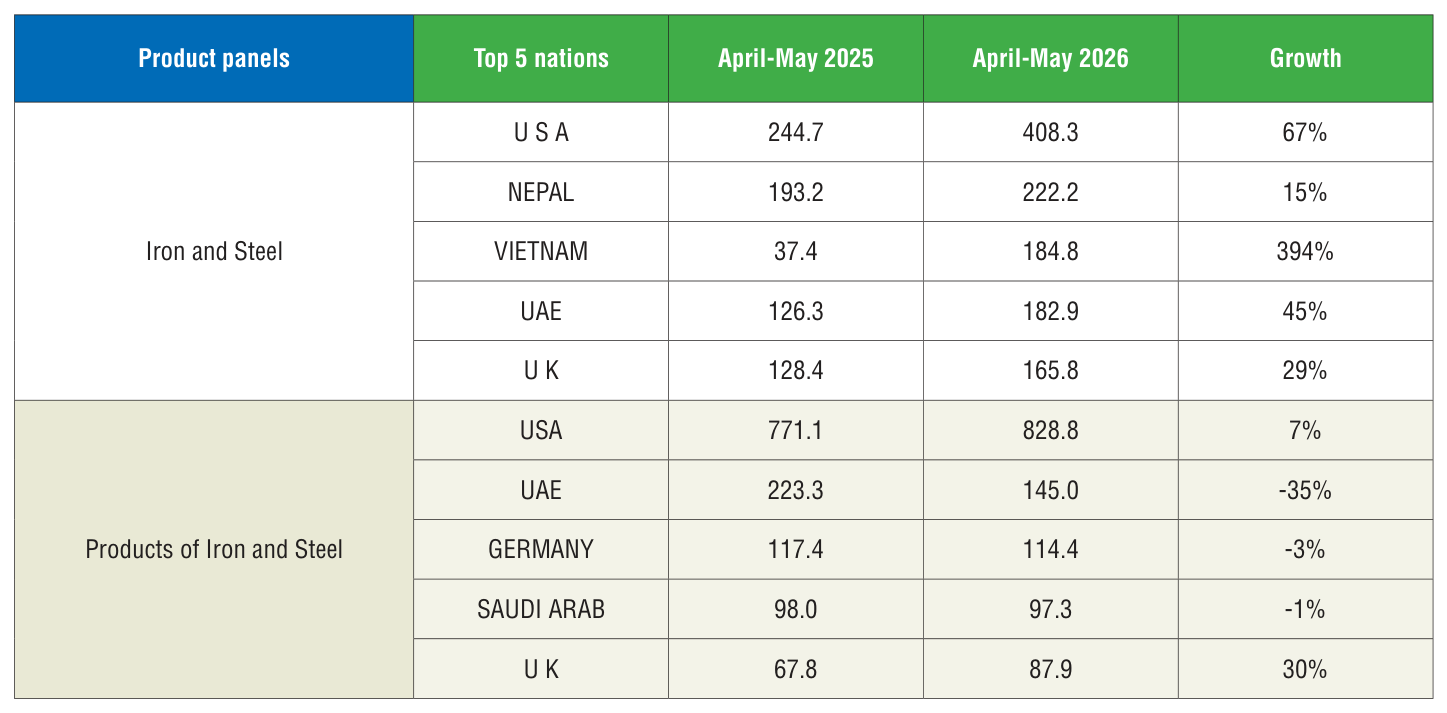
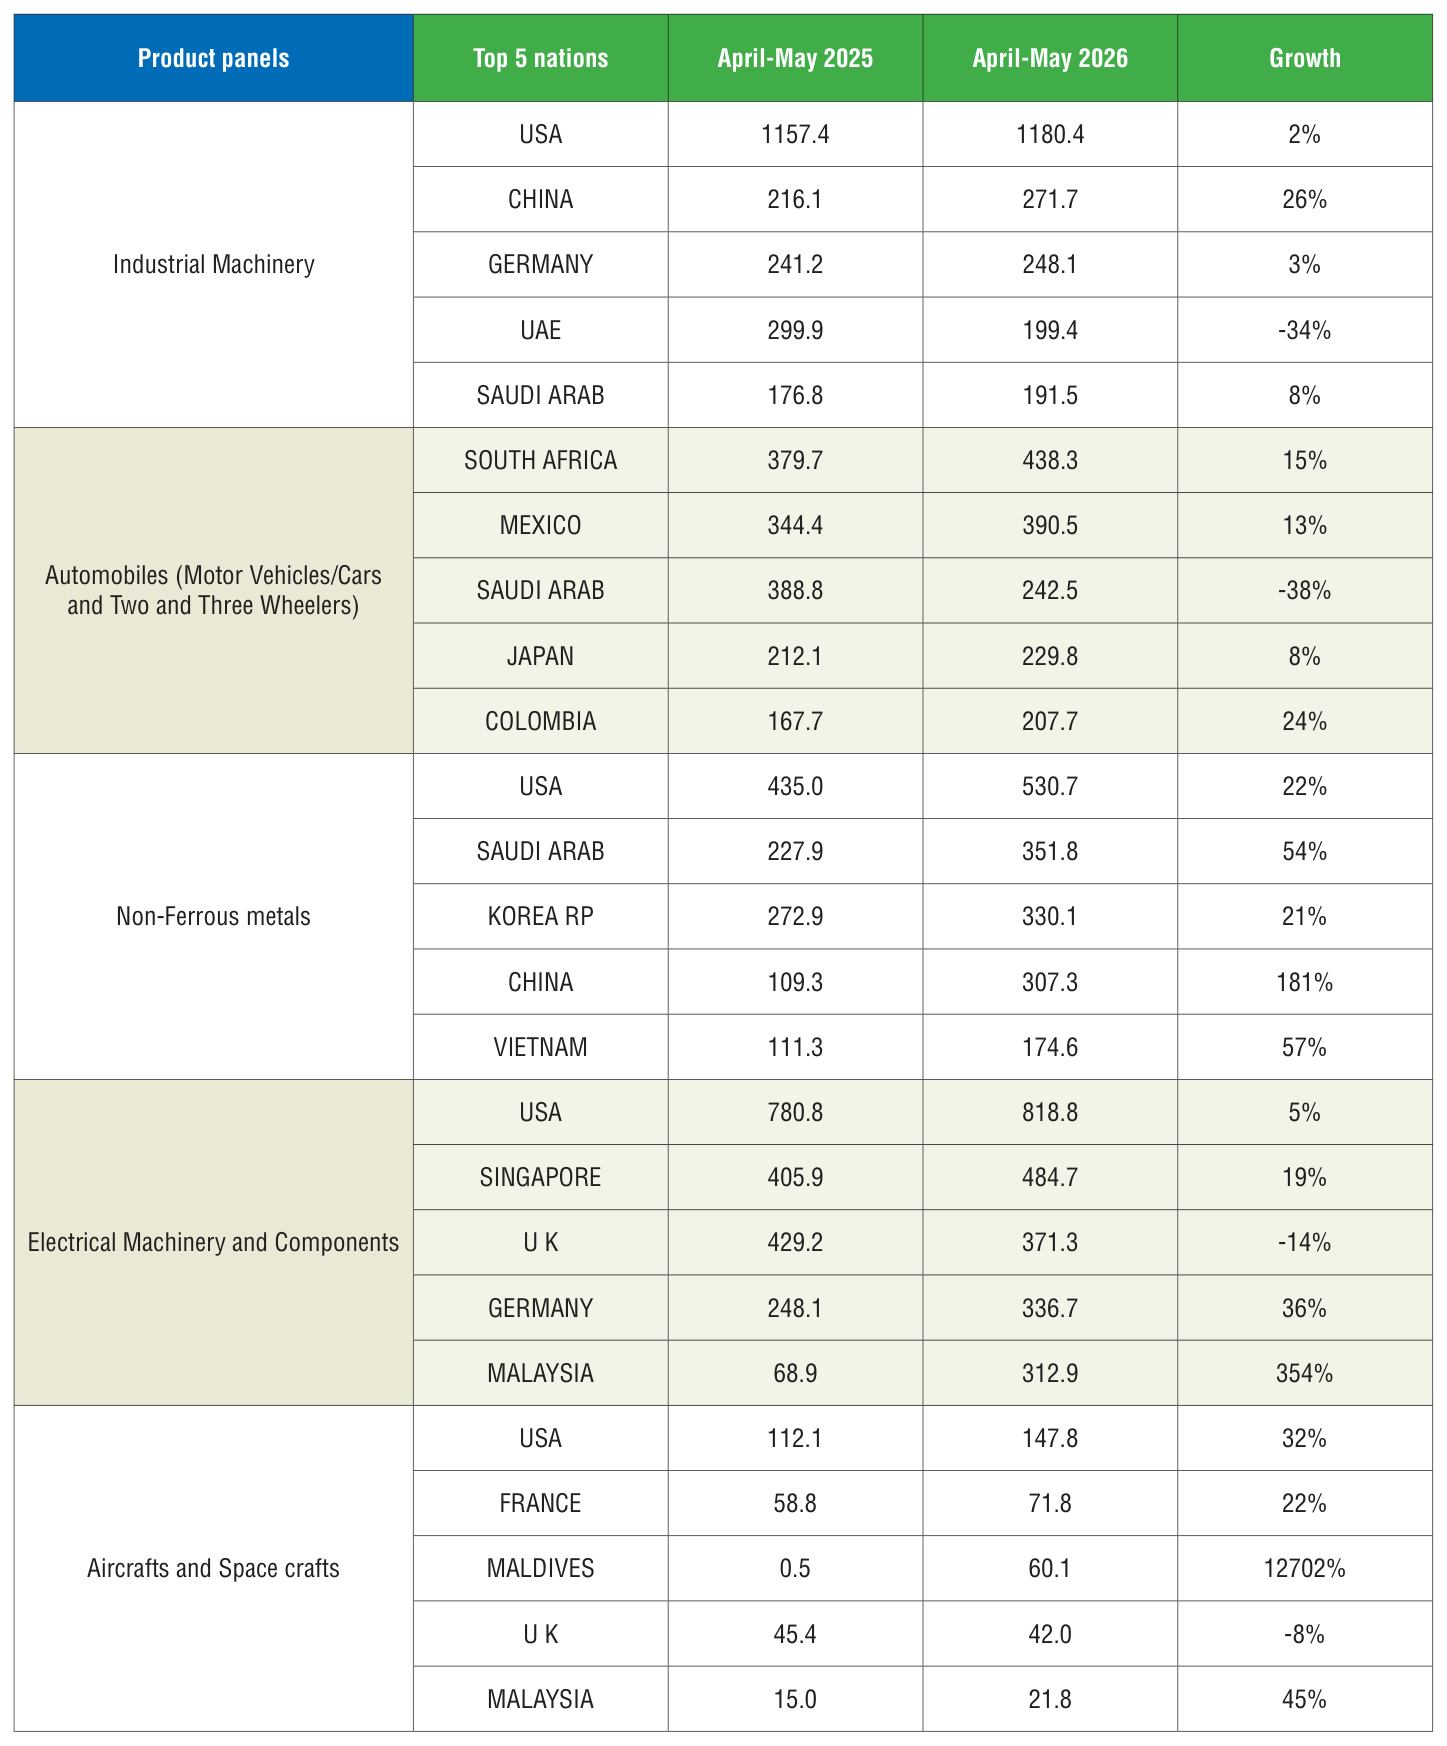
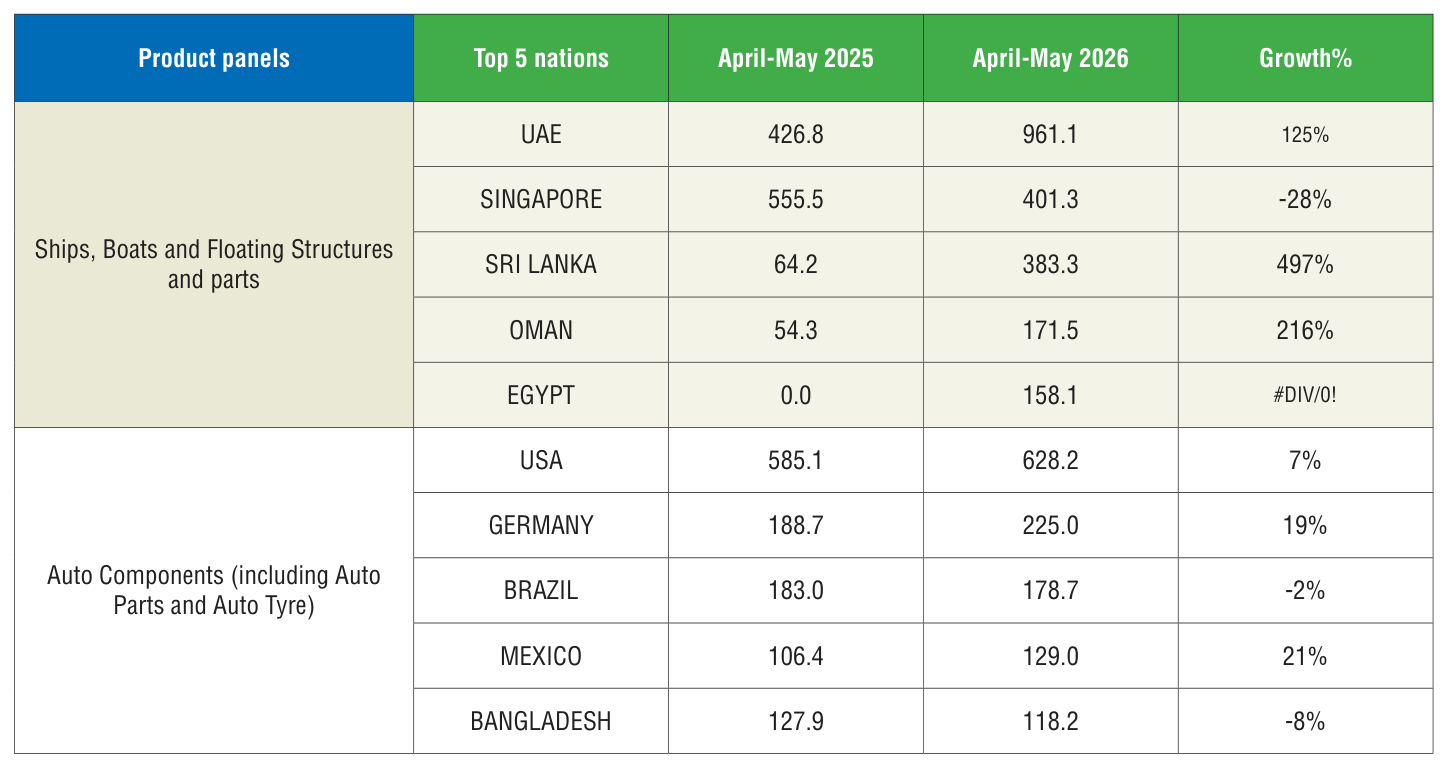
We now analyze the performance of some of the important products for the fiscal April-June 2026 vis-à-vis AprilJune 2025. We have taken the major panels and computed the top importers to get an idea of the current trade pattern.
Engineering Product Panel - Country matrix (Value in US$ million)
Source: DGCI&S
- In April-June 2026, USA, Nepal and Vietnam ranked as the top importers of Indian Iron and Steel, while the USA, UAE and Germany lead in import of products of Iron & Steel.
- The USA stood out as the primary importer of Indian ‘Industrial machinery,’ making up 21% of India’s global exports in this category, followed by China and Germany with 5% ad 5% shares, respectively.
- South Africa, Mexico and Saudi Arab were top importers of India’s Automobiles during April-June 2026 in India’s global exports respectively over the same period previous fiscal.
- USA, Saudi Arab and South Korea were the top three importers of India’s Non-ferrous metals and products during April-June 2026.
- USA, Singapore and UK were the top importers of Indian Electrical Machinery & Components during the same period with 18%, 11% and 8% shares, respectively.
- USA, France, Maldives UK and Malaysia were the top importers of India’s Aircrafts and Spacecraft during April-June 2026, making up to 72% of India’s total export of Aircrafts and Spacecraft
- UAE, Singapore and Sri Lanka became the largest importer of ships, boats and floating structures during April- June 2026 in India’s global exports respectively over the same period previous fiscal.
- For the auto components’ product group, USA remained the top importer in April-June 2026 followed by Germany, Brazil, Mexico and Bangladesh.
© Copyright , All rights reserved. Design by Andreal