


VOL. 18, ISSUE NO. 12 | March 2026
Oversight


HIGHLIGHTS
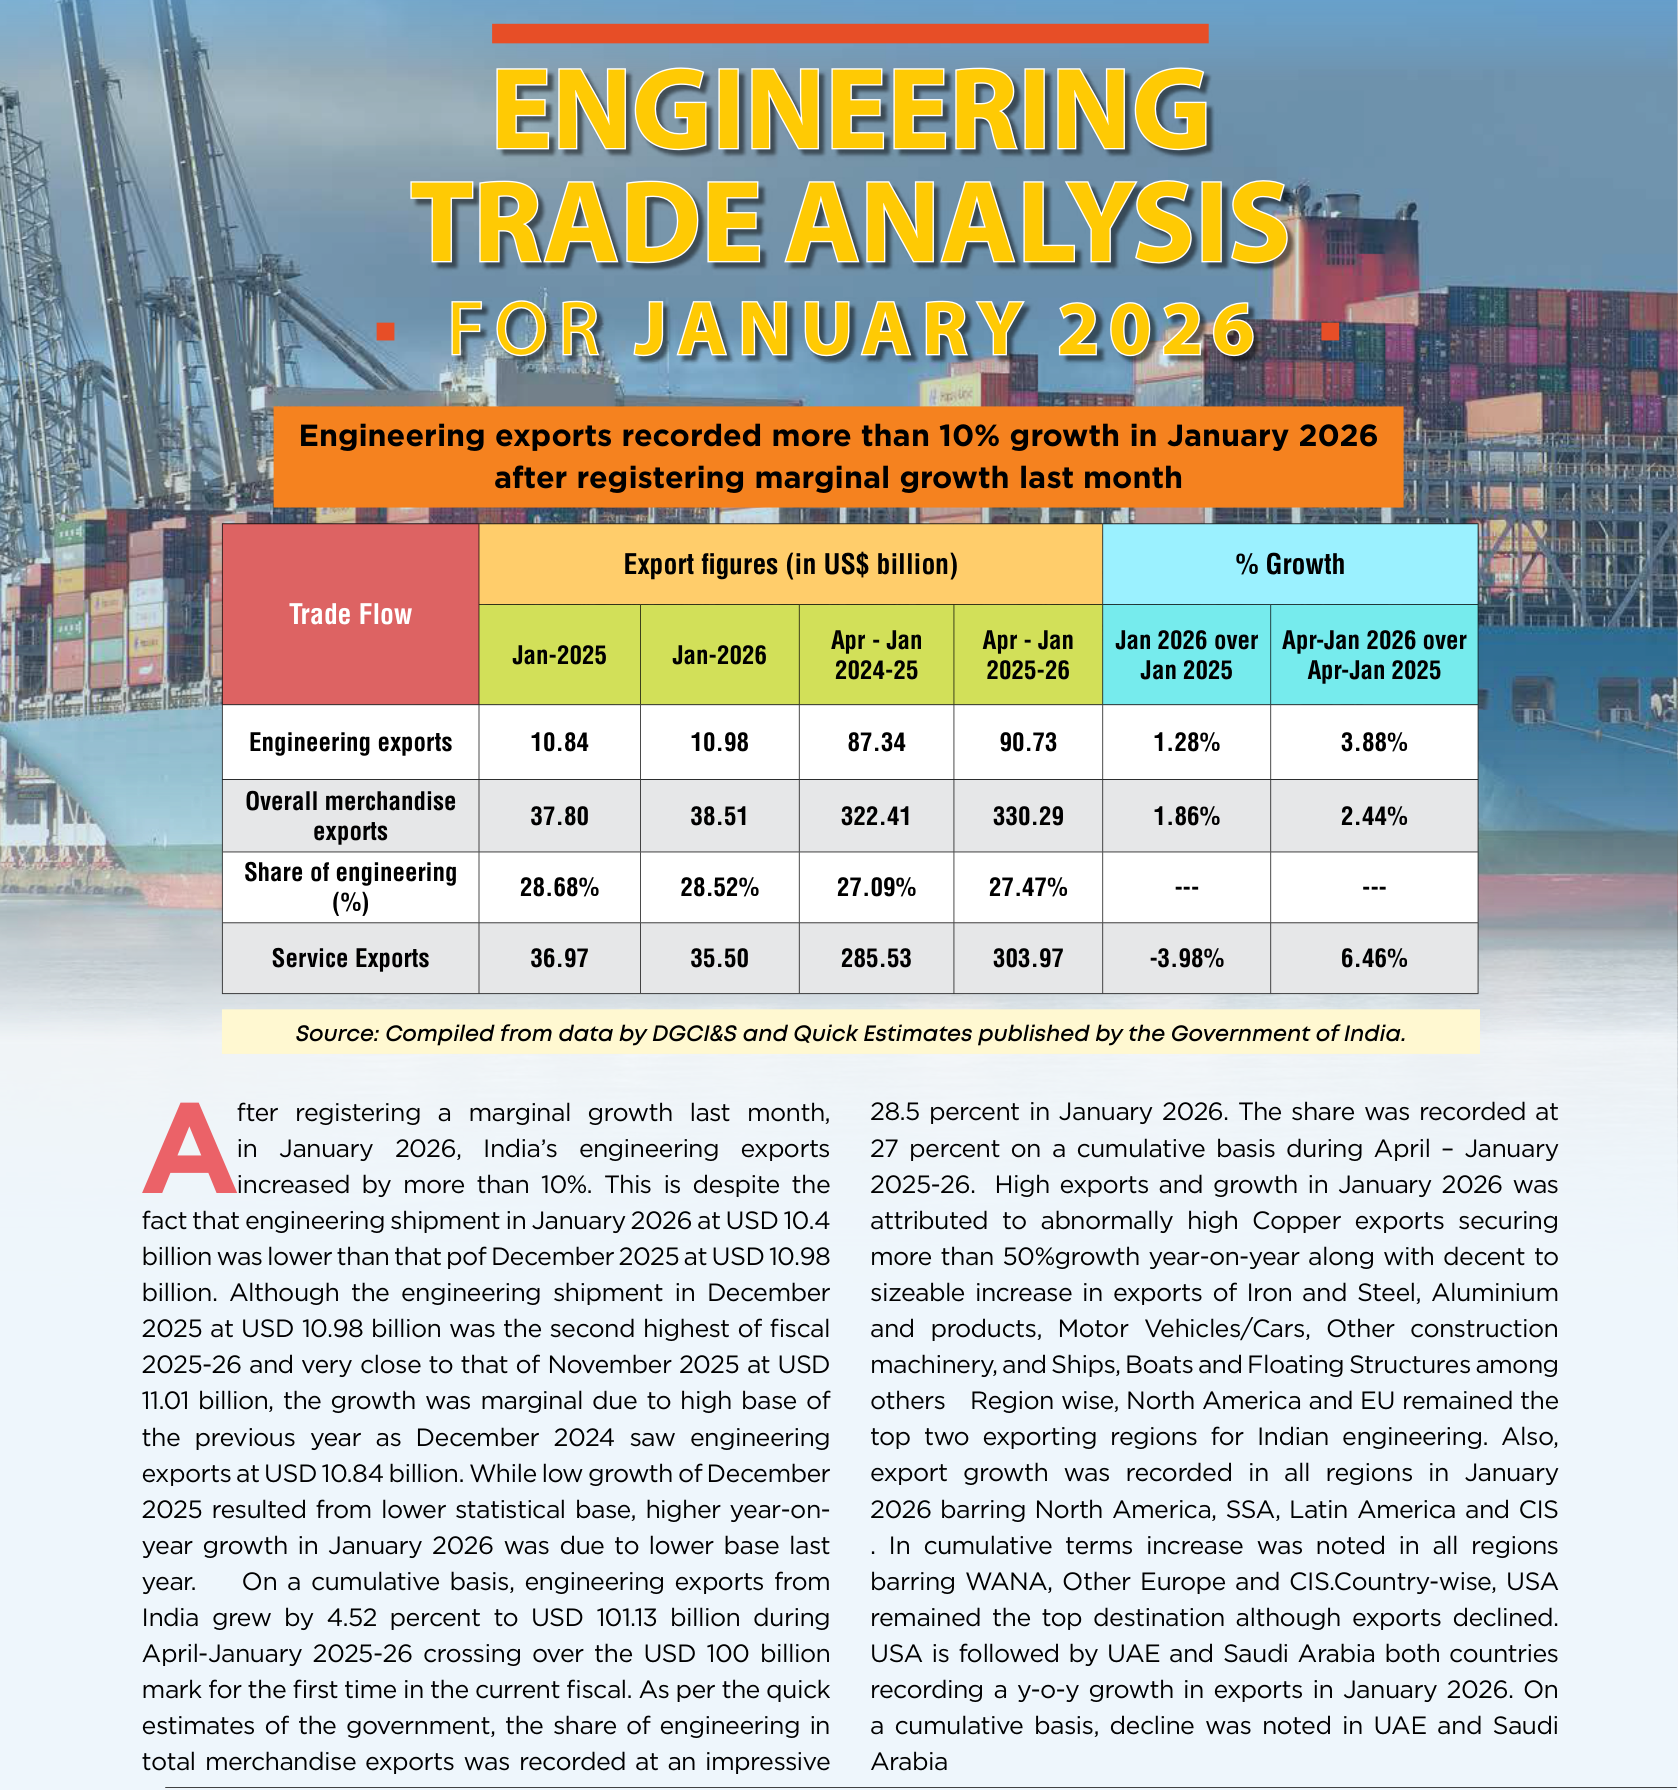
- After registering a marginal growth last month, in January 2026, India’s engineering exports increased by more than 10%.
- This is despite the fact that en‑ gineering shipment in January 2026 at USD 10.4 billion was low‑ er than that pof December 2025 at USD 10.98 billion – the signifi‑ cant growth therefore can be at‑ tributed to low base in the Janu‑ ary of last year.
- On a cumulative basis, engineer‑ ing exports from India grew by 4.52 percent to USD 101.13 billion during April‑January 2025‑26 crossing over the USD 100 billion mark for the first time in the cur‑ rent fiscal.
- As per the quick estimates of the government, the share of en‑ gineering in total merchandise exports was recorded at an im‑ pressive 28.5 percent in January 2026. The share was recorded at 27percent on a cumulative basis during April – January 2025‑26.
- In January 2026, 28 out of 34 en‑ gineering panels witnessed posi‑ tive year‑on‑year growth. While 6 engineering panels including Nickel and its products, aircraft, spacecraft and parts, hand tools and cutting tools and prime mica and products and project exports witnessed year‑on‑year decline in exports.
- On a cumulative basis too, 28 out of 34 engineering panels re‑ corded growth and remaining 3 engineering panels including Nickel and its products, Aircraft and Spacecrafts, Ships, boats and floating structures, hand tools and cutting tools, prima mica and project goods recorded nega‑ tive growth during April‑January 2025‑26.
- Region wise, North America and EU remained the top two ex‑ porting regions for Indian engi‑ neering. Also, export growth was recorded in all regions in Janu‑ ary2026 barring North America, SSA, Latin America and CIS.In cu‑ mulative terms increase was not‑ ed in all regions barring WANA, Other Europe and CIS.
- Country‑wise, USA remained the top destination although exports declined. USA is followed by UAE and Saudi Arabiaboth countries recording a y‑o‑y growth in ex‑ ports in January 2026. On a cu‑ mulative basis, decline was noted in UAE and Saudi Arabia.
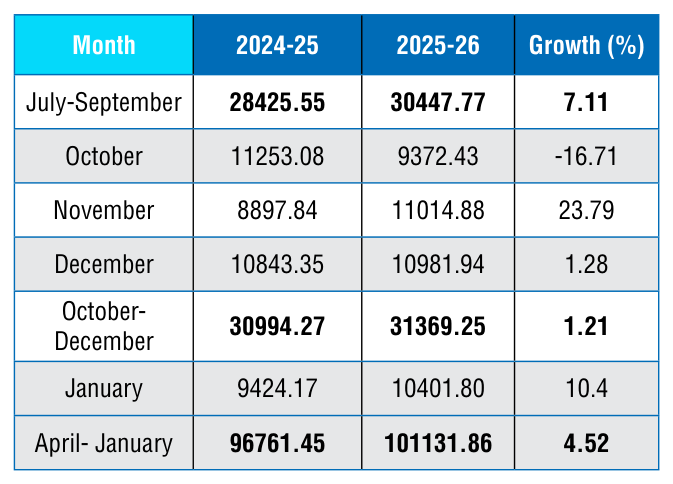
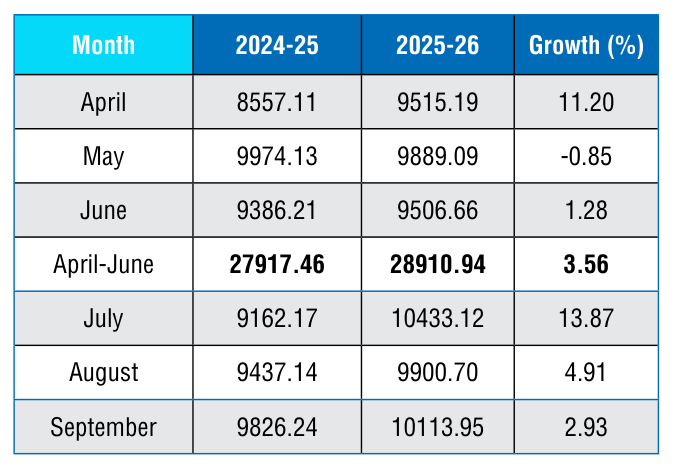
The monthly engineering export figures for 2025‑26 vis‑à‑vis 2024‑25 are shown below as per the latest DGCI&S estimates::
Engineering Exports: Monthly Trend
Table 1: Engineering Exports: Monthly Trend in 2025-26 (Values in US$ million)
TOP 25 ENGINEERING EXPORT DESTINATIONS IN JANUARY 2026
We now look at the export scenario of the top 25 nations that had highest demand for Indian engineering products during January 2026 over January 2025 as well as in cumulative terms during April‑January 2025‑26 vis‑à‑vis April‑ January 2024‑25. The data clearly shows that top 25 countries contribute more than 74 % of total engineering exports.
Table 2: Engineering exports country-wise (Values in US$ Million)
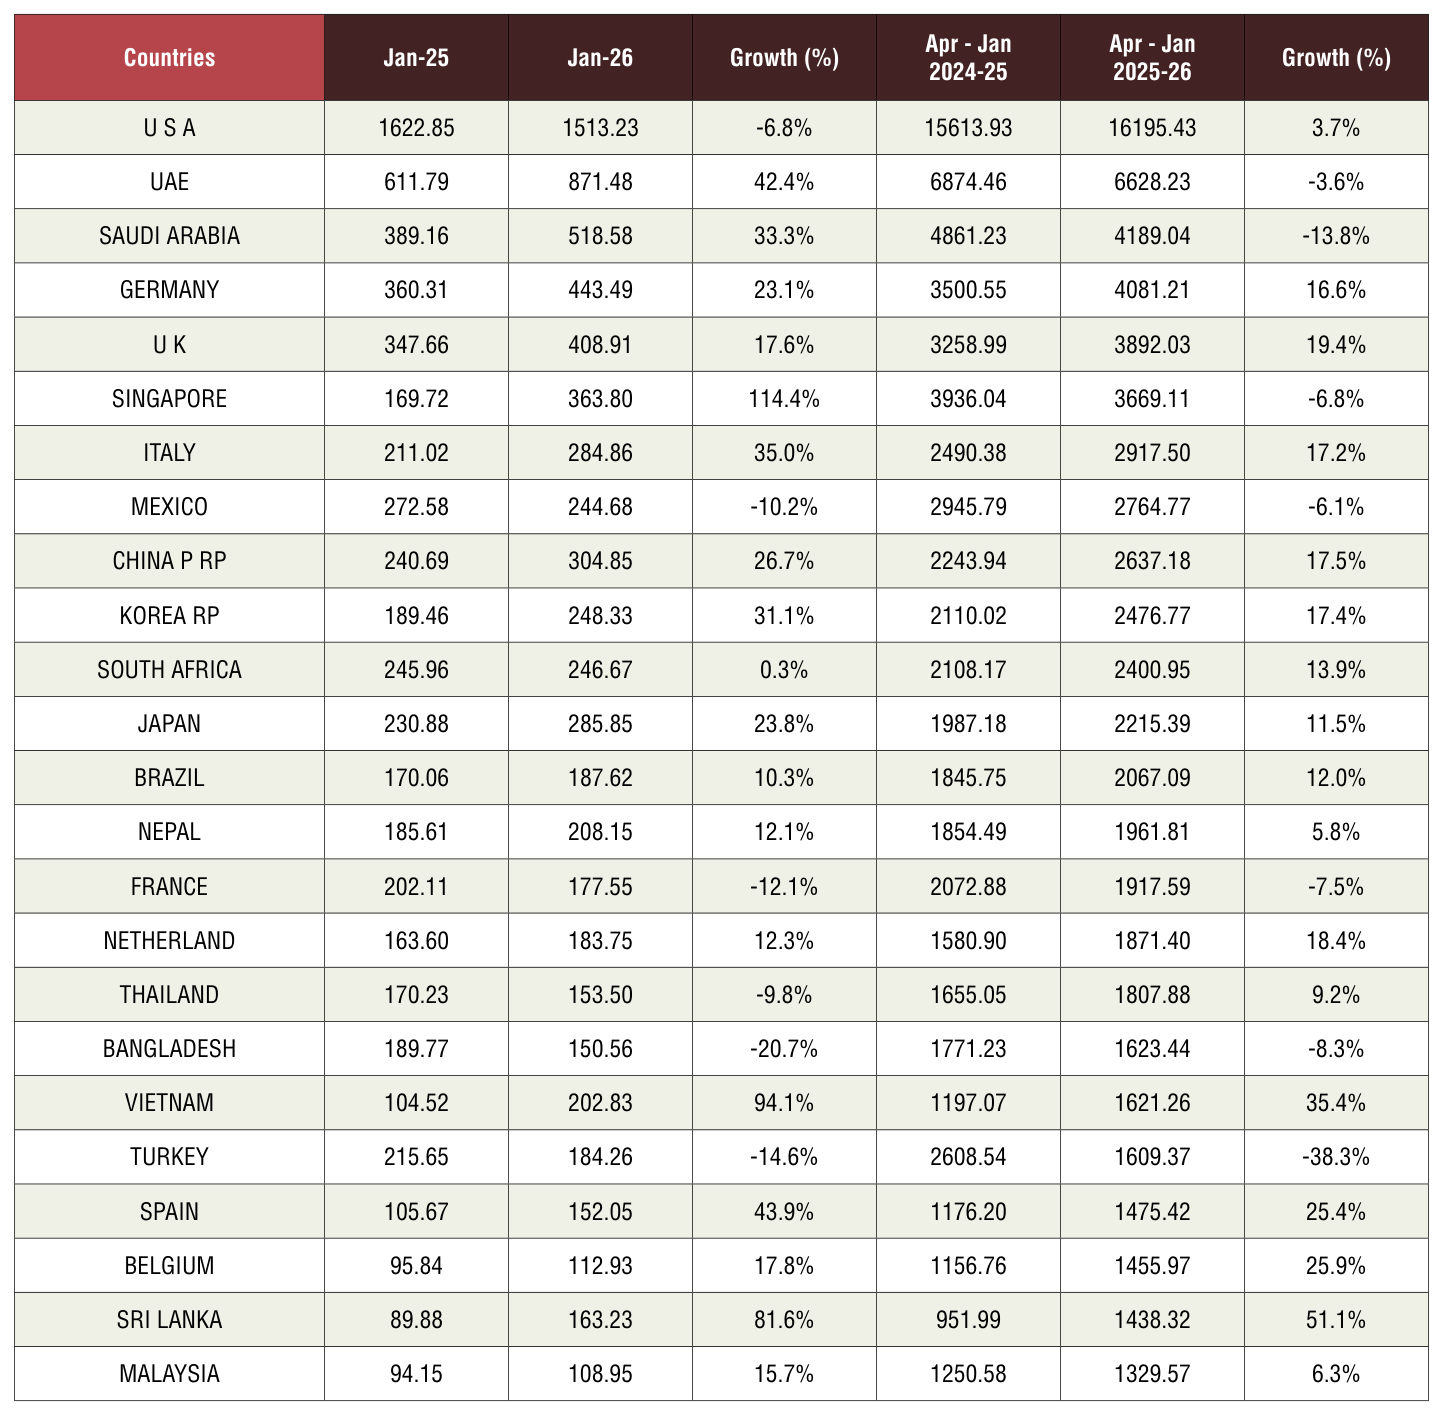
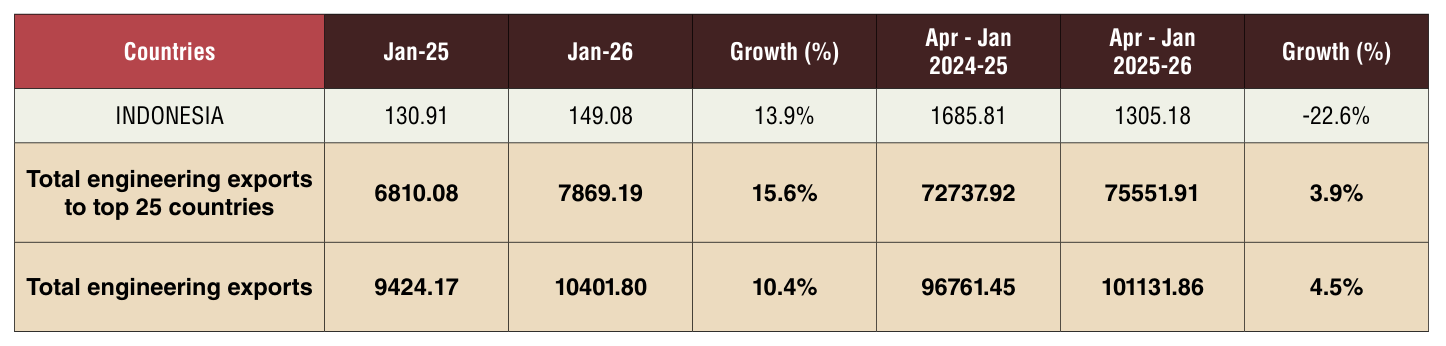
Source: DGCI&S
REGION WISE INDIA'S ENGINEERING EXPORTS
The following table depicts region wise India’s engineering exports for April‑January 2026 as compared to April‑January 2025
Table 3: Region wise engineering exports in April-January 2025-26 vis-à-vis April-January 2024-25
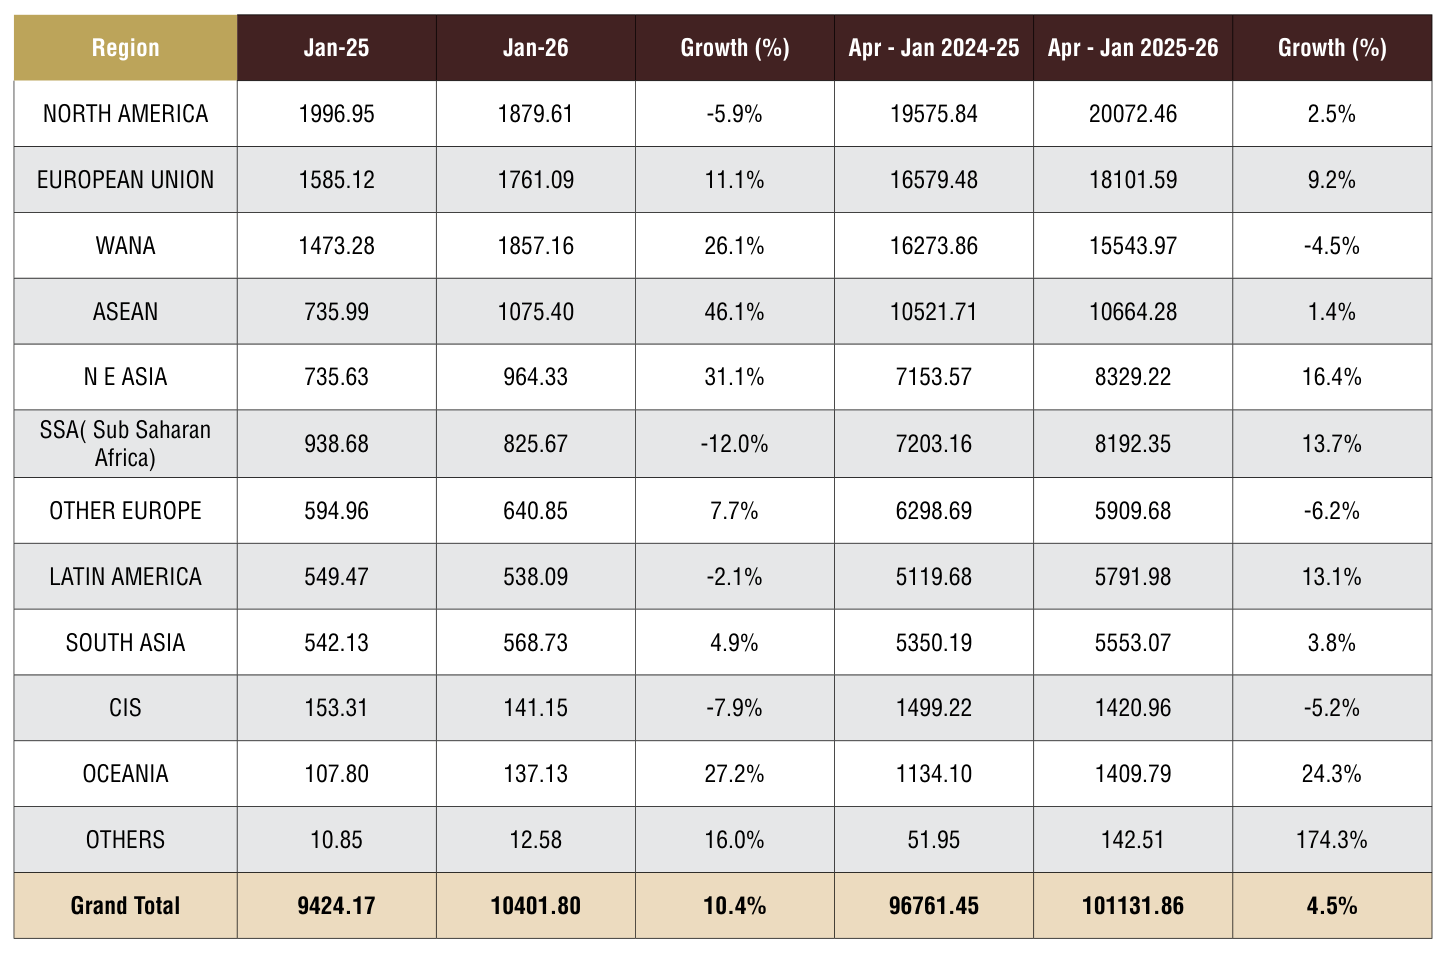
Source: DGCI&S
Note: Myanmar has been included in ASEAN and not in South Asia, since ASEAN is a formal economic grouping.
Region-wise observations:
- • North America: Exports to North America declined mainly due to decline in exports to the US (‑6.8%) during January 2026.Within US major decline was not‑ ed in exports of iron and steel and products, aluminium and prod‑ ucts and auto components all of which are under Section 232 tar‑ iff. Apart from this, exports also declined in electrical machinery and industrial machinery
- • SSA: Decline in exports to SSA was mainly sue to falling exports in Nigeria. Exports of two and three wheelers, products of iron and steel, industrial and electrical machinery recorded significant dip in exports to Nigeria
- • CIS: In CIS region, exports to Rus‑ sia declined by around 8% which also contributed towards decline in exports to the CIS.
- • Latin America: Exports to Latin America declined by 2.1% mainly due to some exports decline to Chile and Argentina.
- • WANA: On a positive noteAf‑ ter registering decline in the last month, exports to WANA again registered significant growth this month mainly due to growing ex‑ ports in both UAE and Saudi Ara‑ bia
Figure 1: Region-wise shares of India’s engineering exports during April-January 2025-26
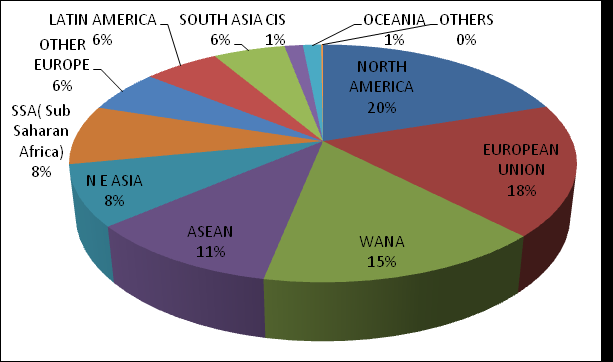
Source: DGCI&S
PANEL WISE INDIA’S ENGINEERING EXPORTS
In this section we look at the Engineering Panel wise exports for the month of December 2025 vis‑à‑vis December 2024 as well as cumulative exports for April‑December 2025‑26 vis‑à‑vis April‑December 2024‑25. These are indicated in the table below.
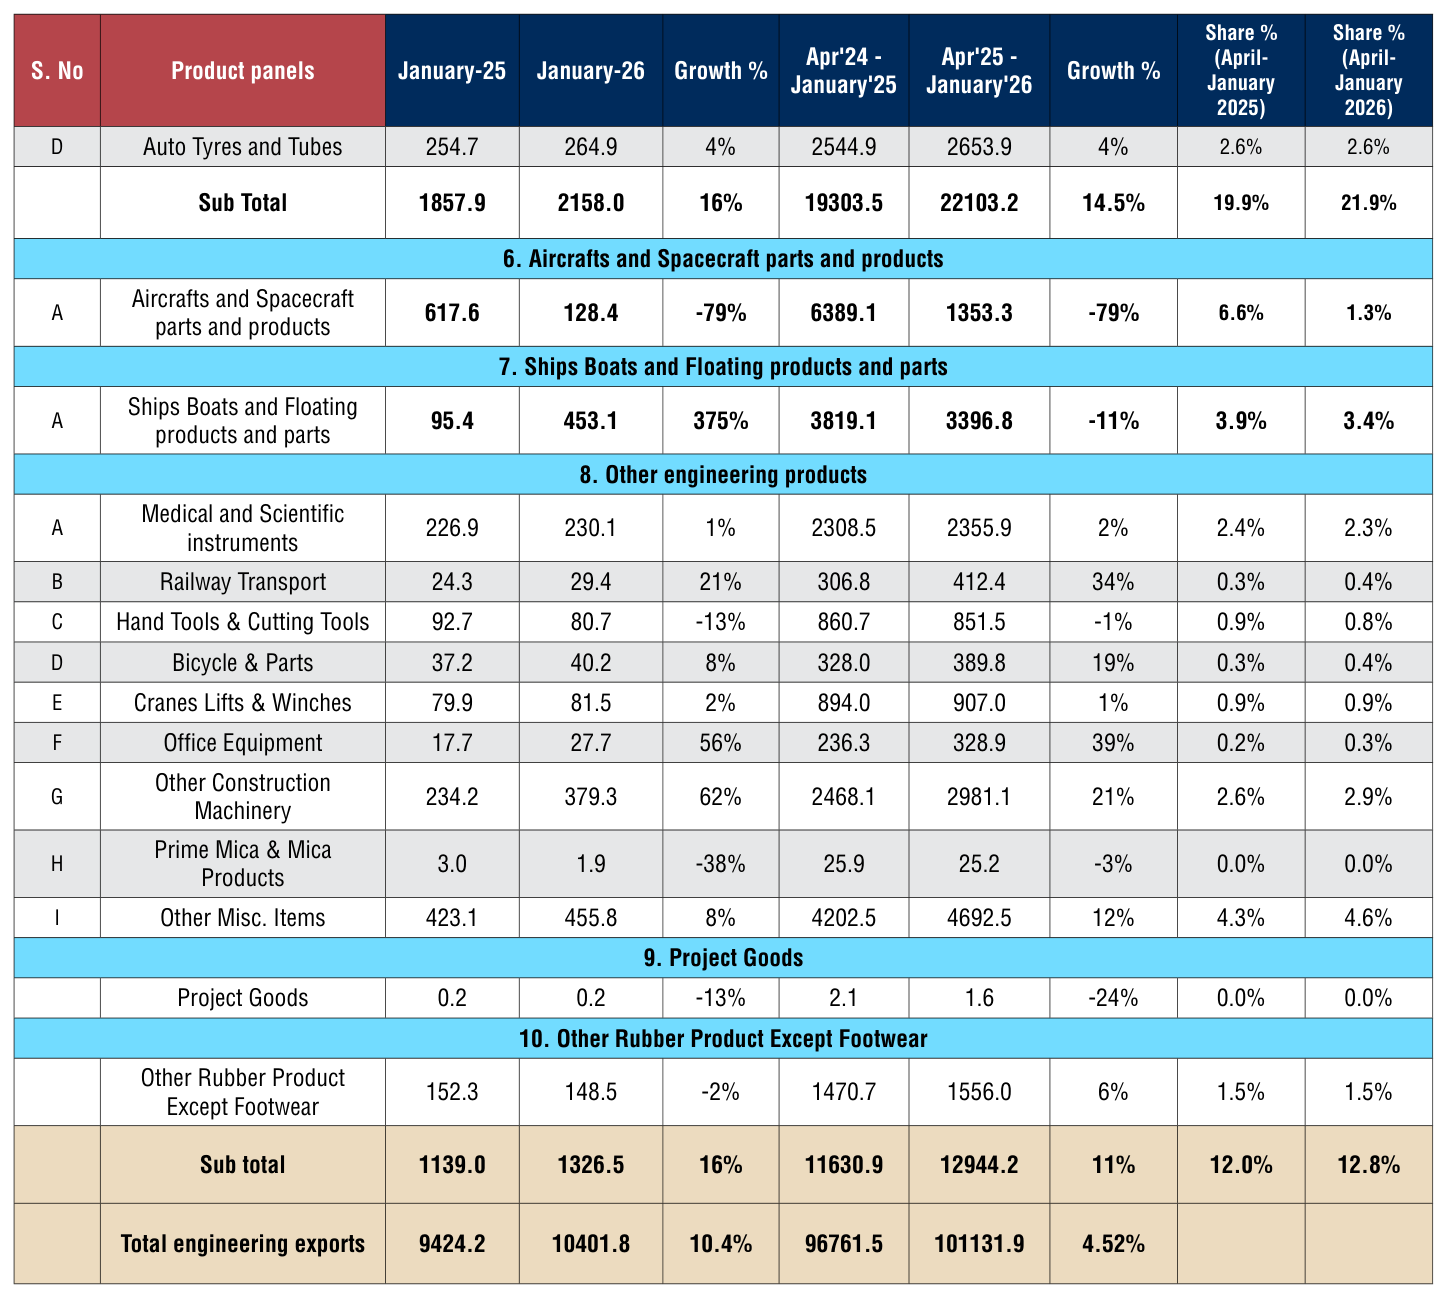
Table 4: Panel wise in April-January 2025-26 vis-à-vis April-January 2024-25 (Value in US$ million)
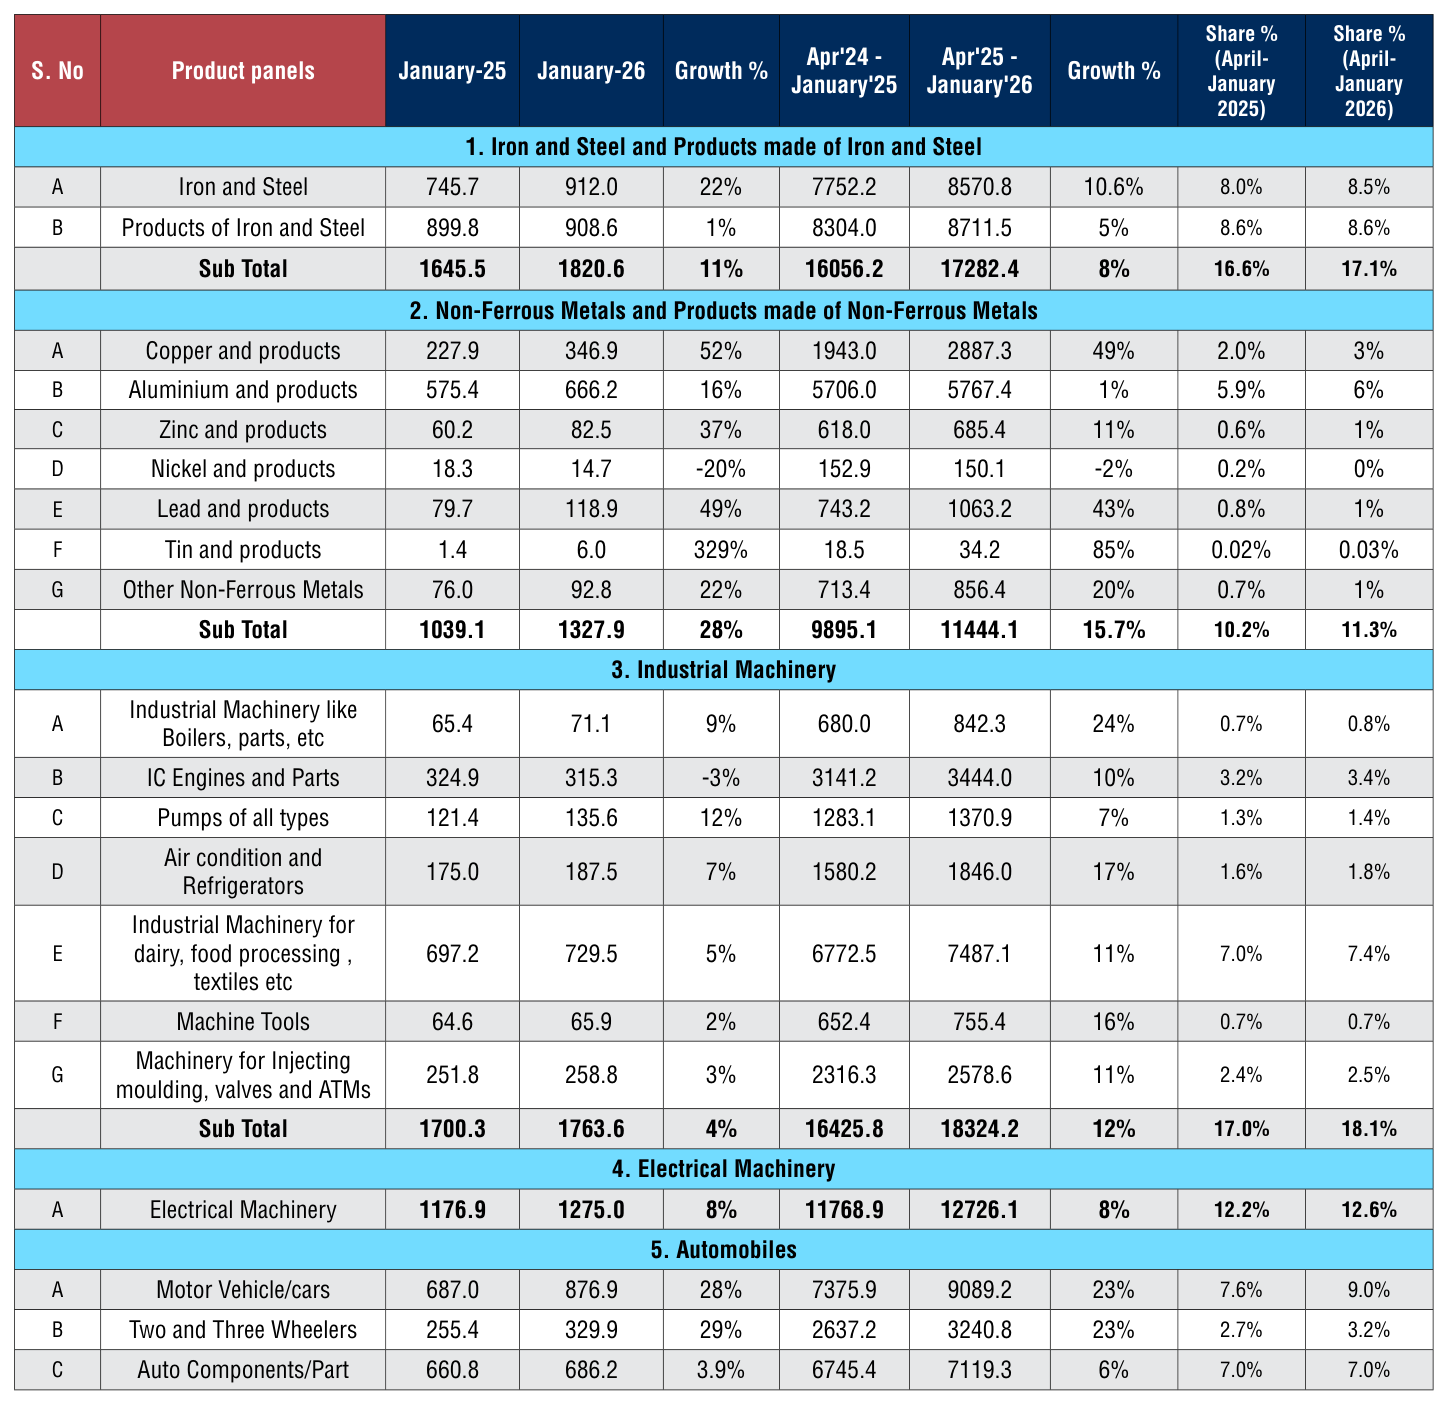
Sectoral Observations:
India’s engineering exports grew by about 4.52% in April–January 2025‑ 26 to around US$101.13 billion, with mixed performance across panels:
- Exports of iron and steel rose by 10.6% during April–January 2025 26, supported by higher shipments of primary steel, while products of iron and steel grew at a slower 5%. Overall, India’s steel exports rose 8% to US$17.28 billion during April–January 2025 26, supported by strong demand from the USA, UAE, EU markets (Italy, UK, Belgium, Germany, Netherland, Spain), Nepal and select WANA desti‑ nations (Saudi Arabia, Oman).
As reflected in the BigMint as‑ sessment, India’s crude steel production rose sharply by 10.6% year on year during 10MFY’26, supported by a 9.7% increase in finished steel output. However, domestic consumption grew at a slower pace of 6.6% due to an ex‑ tended monsoon and unseasonal rains that disrupted construction and infrastructure activity—the country’s largest steel consum‑ ing segments. With domestic de‑ mand subdued, mills increasingly shifted volumes to export mar‑ kets, where realisations remained more favourable than domestic prices. Strong buying from the EU ahead of the CBAM phase in further sustained India’s export momentum, helping offset the weakness in local demand.
- The non‑ferrous metals panel emerged as a major growth driv‑ er, with exports rising by 15.7% to US$11.44 billion during April–Jan‑ uary 2025 26. Among which:
i. Aluminium and aluminium products witnessed a marginal growth of 1% to US$5.77 billion in April‑Jan 2026 from US$5.71 billion during April‑Jan 2025.Export performance was sup‑ ported by stronger shipments to Vietnam, the USA, Japan and Italy, although declines were observed in markets such as Korea (Rep.), Mexico and Turkey. On the pricing front, BigMint data indicates that domestic aluminium prices in India firmed up week‑on‑week, reflecting the rise in LME and MCX aluminium futures amid ongoing global supply con‑ cerns.
ii. Copper and copper prod‑ ucts registered a robust 49% increase, rising to US$ 2.88 billion from US$ 1.94 billion.Export growth was support‑ ed by strong demand from China, Saudi Arabia, Korea (Rep.), the UAE, key EU mar‑ kets, and Nepal. On the pric‑ ing front, BigMint data shows that imported copper scrap prices in India climbed sharply week‑on‑week, tracking a re‑ bound in LME copper futures, while domestic scrap prices also firmed on higher replace‑ ment costs and improving sen‑ timent, despite cautious buy‑ ing. Middle East‑origin Birch Cliff scrap was assessed at US$ 12,795/t CFR Mundra, up 9.8% w‑o‑w, while Brass Hon‑ ey prices strengthened across origins—European‑origin ma‑ terial at US$ 7,730/t (up 9.4% w‑o‑w) and Middle East‑origin at US$ 8,295/t (up 7% w‑o‑w).
iii. Lead and lead products rose significantly to US$1.06billion (+43%), while tin products expanded to US$34.2 million (+85%), albeit on a low base.

- Exports of industrial machinery increased by 12% to US$18.32 bil‑ lion during April–January 2025 26, driven by strong demand for Industrial Machinery like Boilers, Air‑condition and Refrigeration machinery, Machine tools, reflect‑ ing rising global investment in automation and manufacturing.However, exports of IC engines and parts grew only moderately.
• Exports of electrical machinery grew by 8% to US$12.73 billion, supported by demand for pow‑ er equipment, switchgear, and transmission‑related products.
- The automobile sector recorded robust growth of 20%, with ex‑ ports reaching US$22.10 billion, led by South Africa, Mexico,Saudi Arabia, UAE, Japan, Brazil, Ger‑ many and Colombia and, reflect‑ ing sustained demand for vehi‑ cles and components. In South Asia, a strong rebound in Sri Lan‑ ka and Nepal boosted exports.However, shipments to USA, Tur‑ key and Indonesia moderated
- Exports of other engineering products rose by 11% to US$12.94 billion, supported by strong growth in railway transport equipment, bicycle parts, office equipment, and construction ma‑ chinery. In contrast, medical and scientific instruments saw a mar‑ ginal growth.
ENGINEERING EXPORTS – STATE-WISE ANALYSIS
State wise engineering export performance- Data as on 2025-26
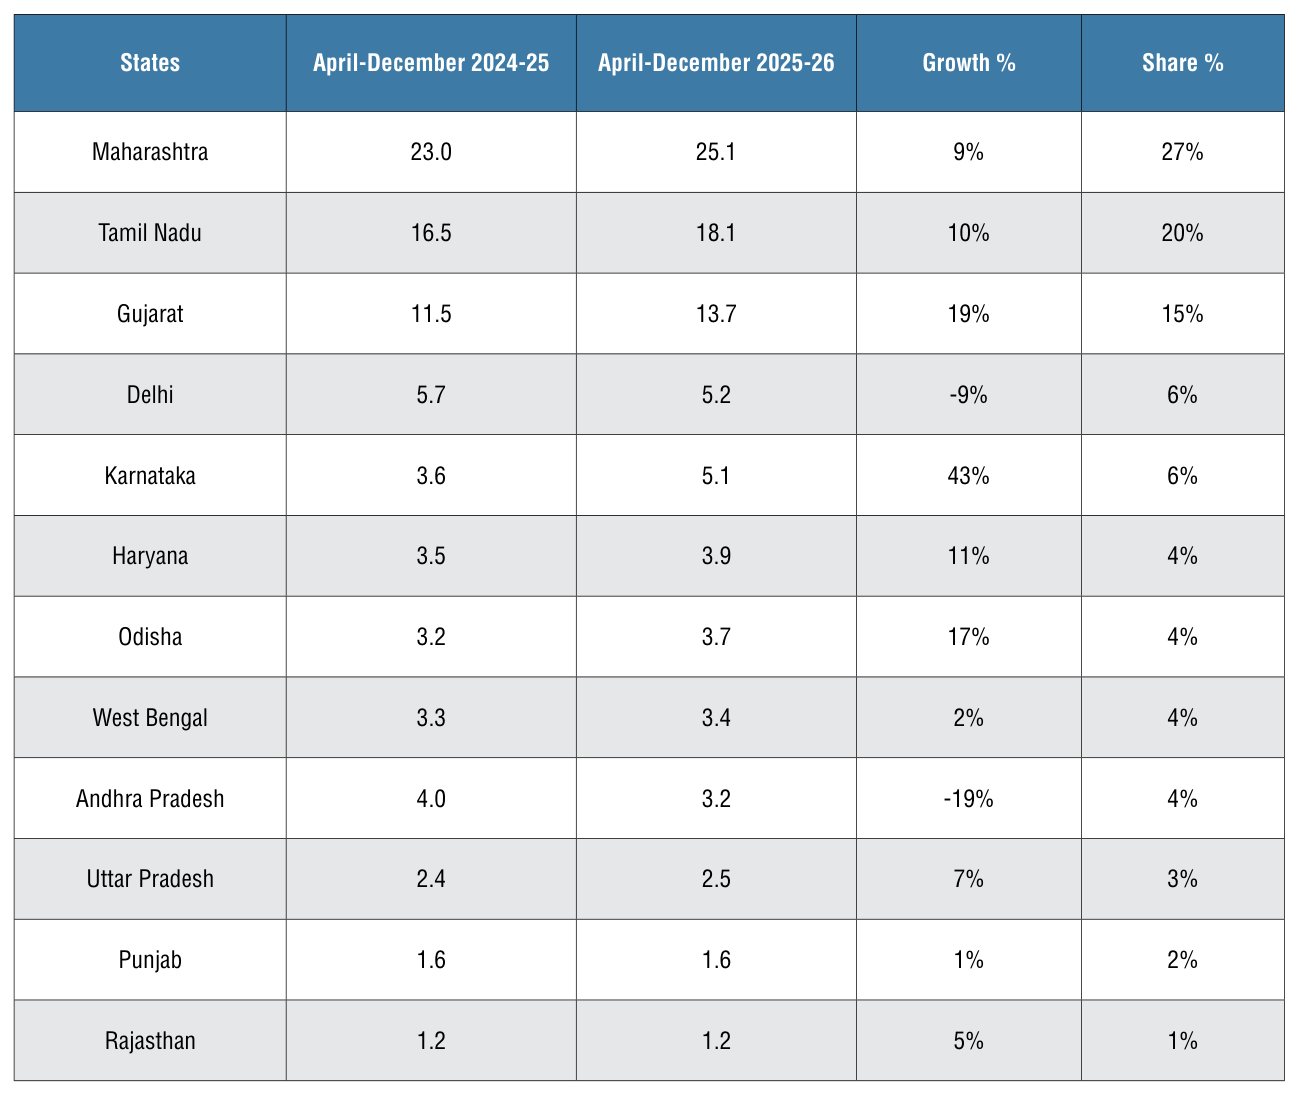
The table below indicates the exports from top Indian states. It is evident from the table that almost 95% of India’s exports is contributed by the listed 12 states. Within this almost more than 60 percent of exports is done by Maha‑ rashtra, Tamil Nadu and Gujarat together during April‑December 2025‑26
Table 5: State-wise engineering exports in April-December 2025-26 (Value in US$ million)
Source: DGCIS Portal
Maharashtra leads with 25.1 billion USD in engineering exports (April‑ December 2025‑26), up 9% from 23 billion USD, securing a 27% national share through its robust ecosystem in engineering goods. West Bengal recorded marginal 2% growth reaching US$ 3.4 billion, holding a 4% share. Odisha achieved 17% growth to 3.7 billion USD (4% share) during April‑December 2025‑26. Karnataka achieved the highest growth of 43% during April‑ December 2025‑26 reaching US$ 5.1 billion holding a share of 6%. Delhi contracted 9% to US$5.2 bn (6% share) and Andhra Pradesh fell 19% to US$ 3.2 bn (4% share), while Punjab was flat. Overall, growth remains concentrated in the western–southern hubs.
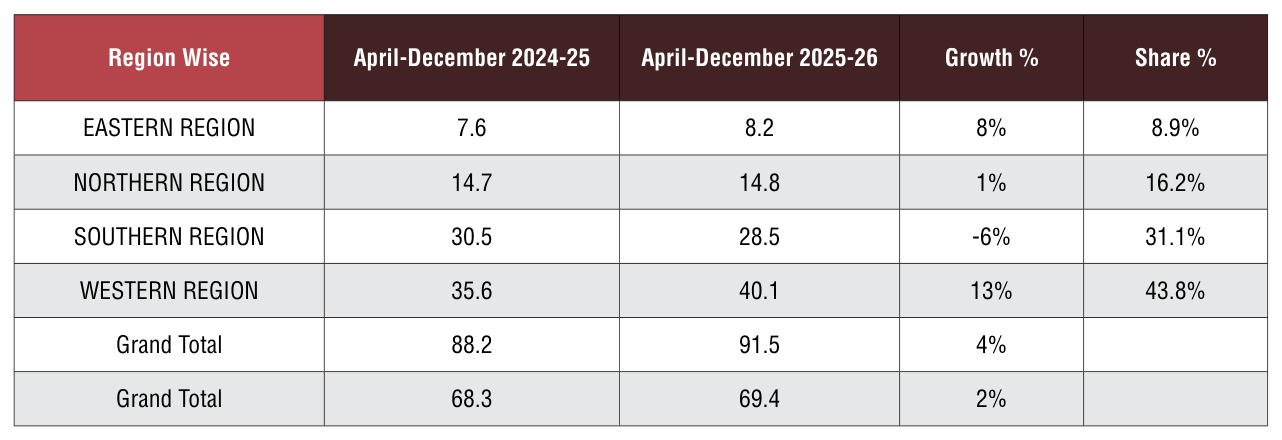
Table 6: Region-wise engineering exports in April-December 2025-26 - Value in US$ billion
Source: DGCIS Portal
India’s region‑wise engineering exports (DGCIS) rose approximately 4% to US$ 91.5 bn in Apr–Dec 2025‑26, led by the Western Region at US$ 40.1 bn (+13%, 43.8% share), which more than offset a contraction in the Southern Region to US$ 28.5 bn (–6%, 31.1% share).The Northern Region inched up marginally by 1% to US$ 14.8 bn (16.2% share), while the Eastern Region posted steady growth of 8% to US$8.2 bn (8.9% share). Overall, exports remain highly concentrated in the West and South (~75% share), with the West acting as the primary growth engine this period.
CORRELATION BETWEEN MANUFACTURING OUTPUT AND ENGINEERING EXPORTS
Engineering forms a considerable part of the broader manufacturing sector and the share of engineering production in overall manufacturing output is quite significant. As exports generally come from what is produced within a country, some correlation between manufacturing production growth and engineering export growth should exist.We briefly look at the trend in manufacturing growth as also engineering export growth to see if they move in tandem. It may be mentioned that manufacturing has 77.63% weightage in India’s industrial production.
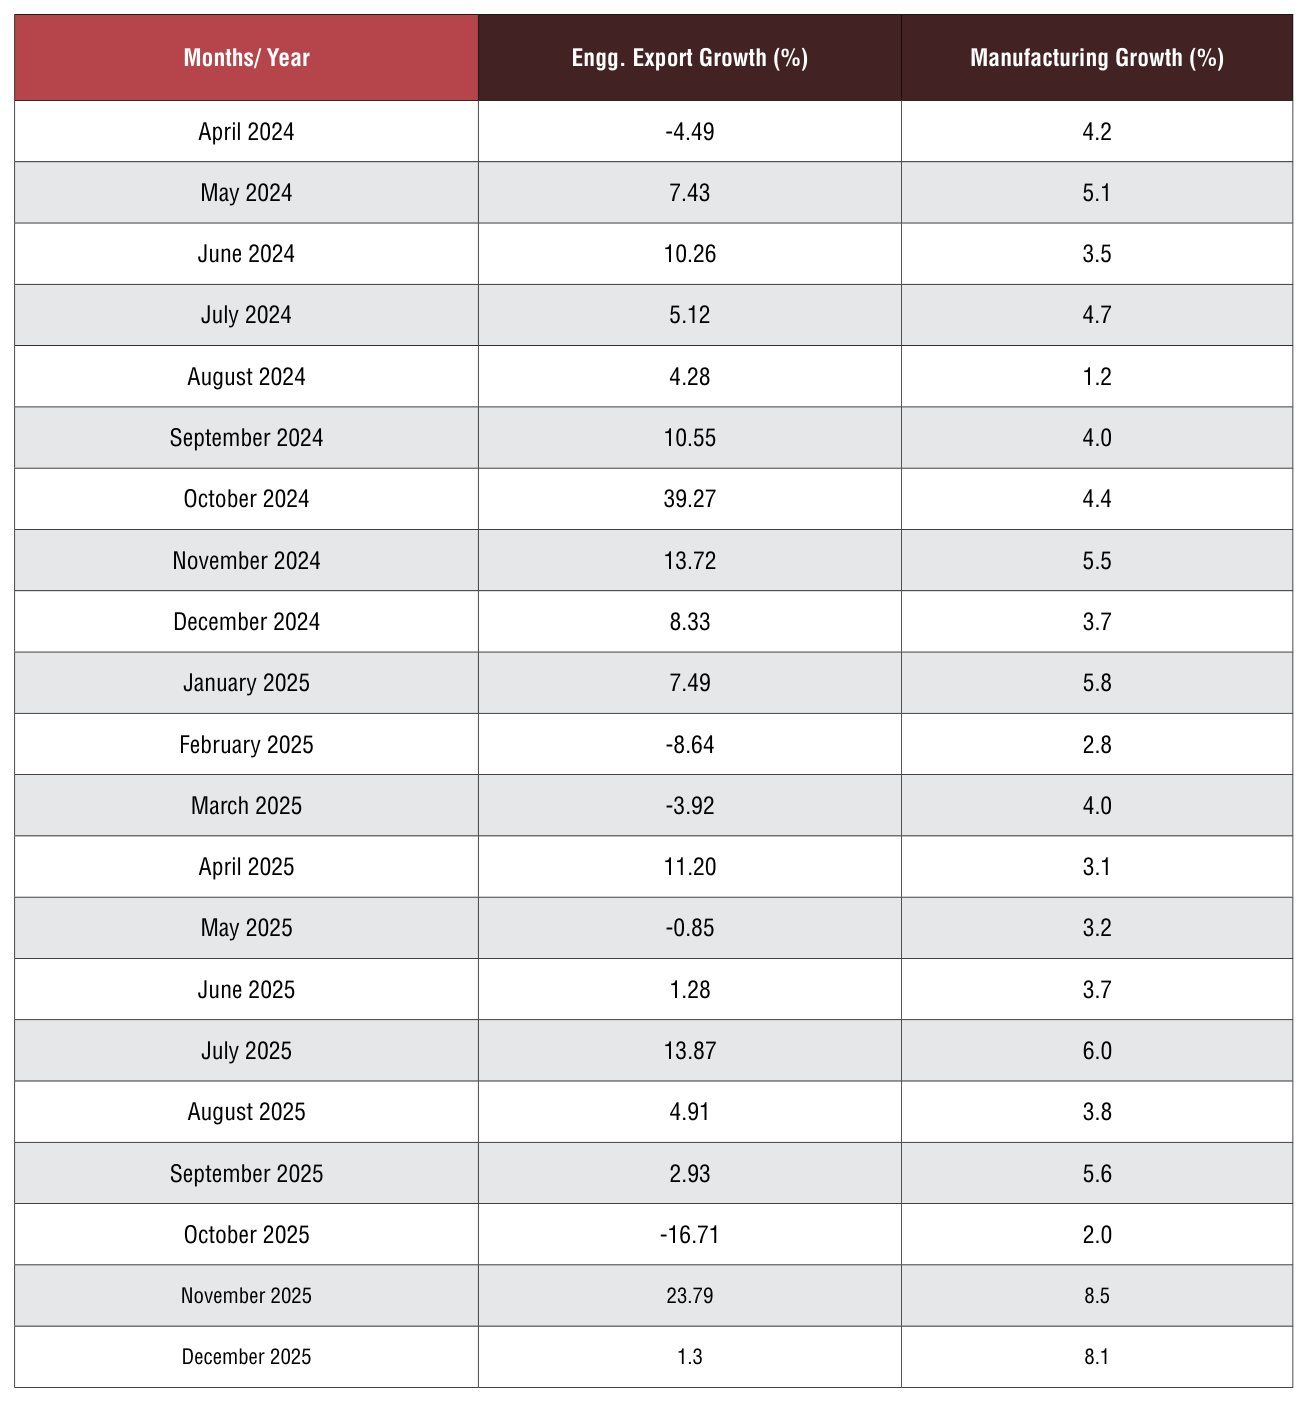
Engineering export growth and manufacturing output growth moved in the same direction in as many as nine out of twelve months in each of the fiscal years 2019-20 and 2020-21. During fiscal 2021-22, engineering export growth and manufacturing growth moved in the same direction in seven out of twelve monthswhile in each of fiscal 2022-23 and 2023-24, as many as10 out of 12 months saw engineering exports and manufacturing output moved in the same direction. In 2024-25, both moved in the same direction in eight out of 12 months.
The first two month of fiscal 2025‑26 saw engineering export growth and manufacturing output growth moved in the opposite direction.In April, engineering export growth surged to double digitandmanufacturing growth decelerated, while in May engineering export declined and manufacturing output growth inched up over the month. Then, In June, July and August 2025 however, both moved on the same direction.In June and July, both witnessed improvement in growth while in Aug 2025, both conceded moderation in growth. In September 2025 however, engineering growth continued to slowdown but manufacturing growth accelerated.October 2025 saw both going down with decline in engineering exports while Novbemebr 2025 witnessed surged in both with substantially higher growth. In December 2025 however, while engineering exports grew, the growth rate slowed down whereas the manufacturing growth rate was maintained.
The link between these two may not be established in one or two months, but a positive correlation may be seen if medium to long term trend is considered.
Table 7: Engineering exports growth vis-à-vis manufacturing growth from April 2024
Source: Department of Commerce and CSO
IMPACT OF EXCHANGE RATE ON INDIA’S EXPORTS
How did the exchange rate fare during January 2026 and what was the recent trend in Re‑Dollar movement? In or‑ der to get a clearer picture of the recent Re‑Dollar trend, not only we took the exchange rate of January 2026, but also considered monthly average exchange rate of Rupee vis‑à‑vis the US Dollar for each month of fiscal2023‑24, 2024‑25 and fiscal 2025‑26 as per the latest data published, as mere one‑month figure does not reflect any trend.The following two tables clearly depicts the short‑term trend.
Table 8: USD-INR monthly average exchange rate in 2025-26 vis-à-vis 2024-25 (As per latest data released by FBIL)
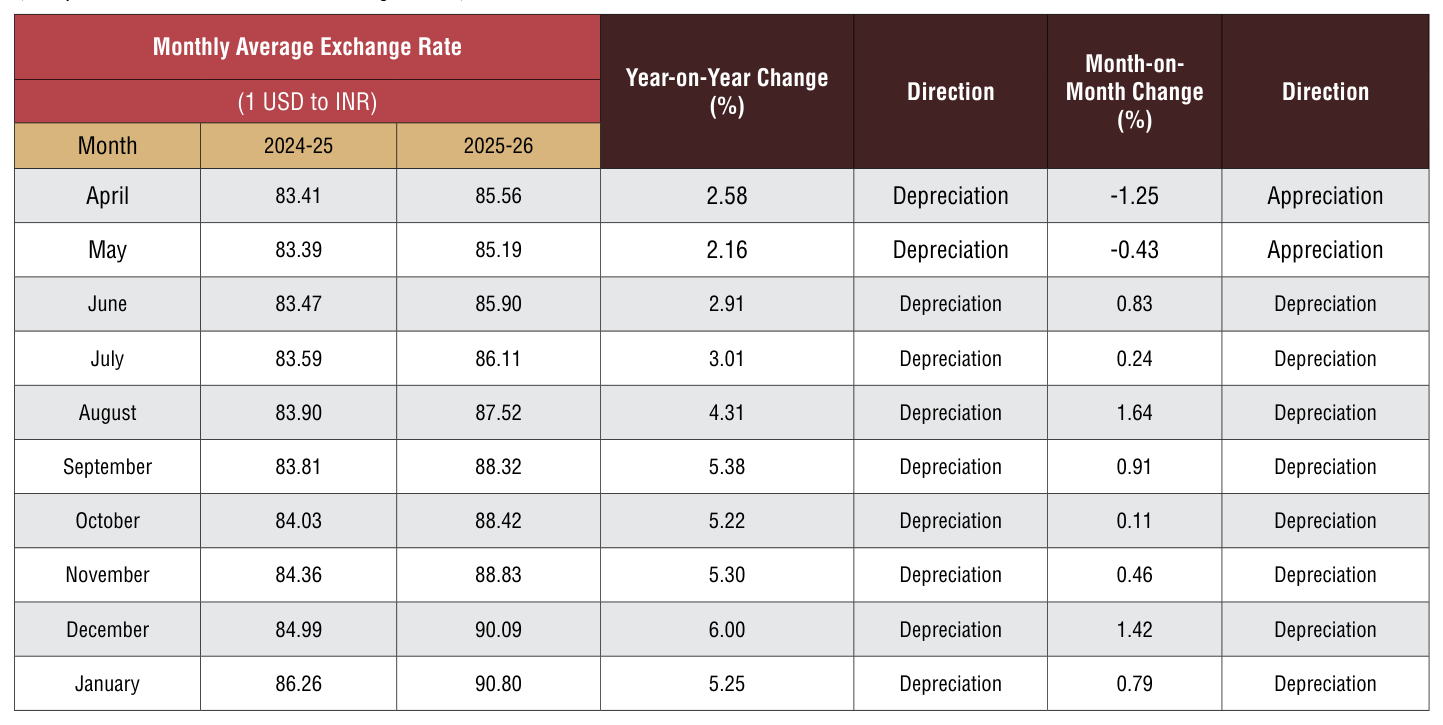
Indian Rupee continued to remain below 90 per US Dollar and conceded 5.25 percent depreciation vis-à-vis the greenback in January 2026: Depreciation of Indian Rupee continued vis‑à‑vis the US Dollar for the eighth straight month to January 2026 on a monthly while on a yearly basis, the depreciation continued since last fiscal.INR depreciated vis‑à‑vis the US Dollar by 0.78 percent in January 206 over the previous month. Despite of intermittent intervention by the RBI, uncertainty on trade deal with the USA and capital outflow from Indian markets continued to weigh on rupee. Increase in gold import was also sighted as one of the reasons for weakening of rupee.
Table 9: USD-INR monthly average exchange rate in 2024-25 vis-à-vis 2023-24 (As per latest data released by FBIL)
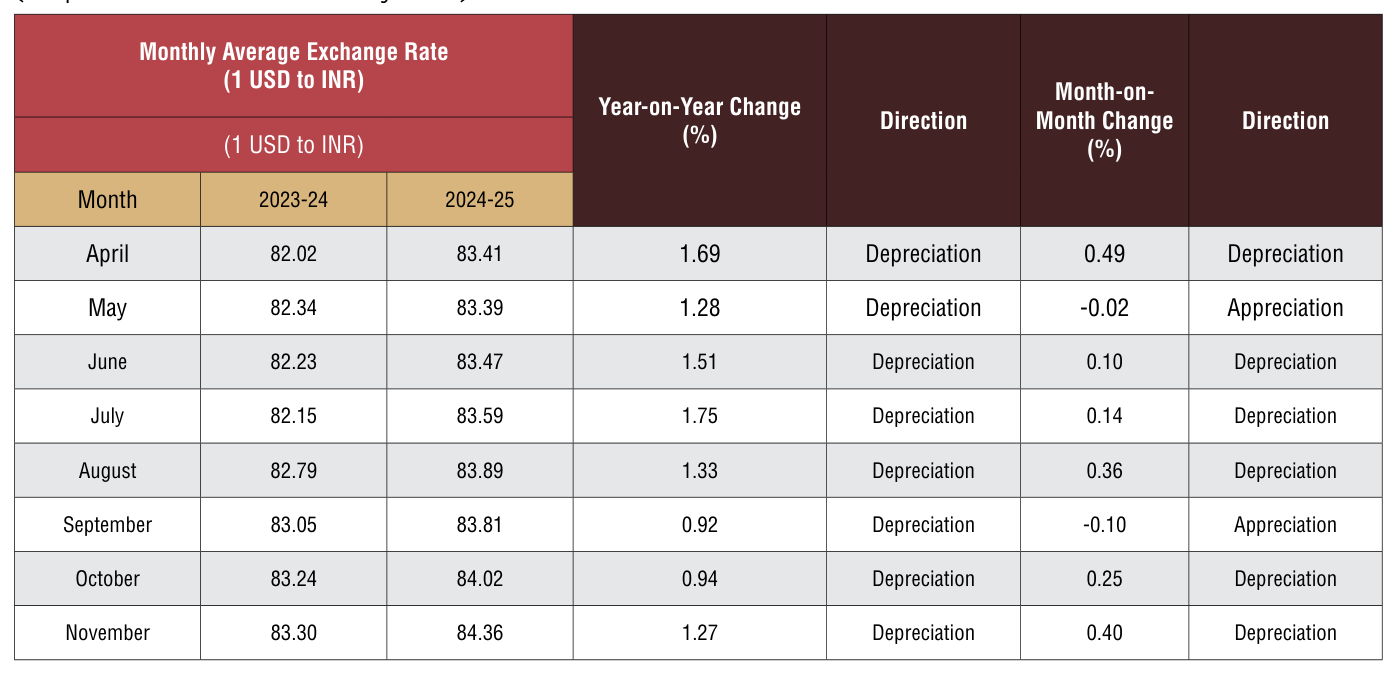
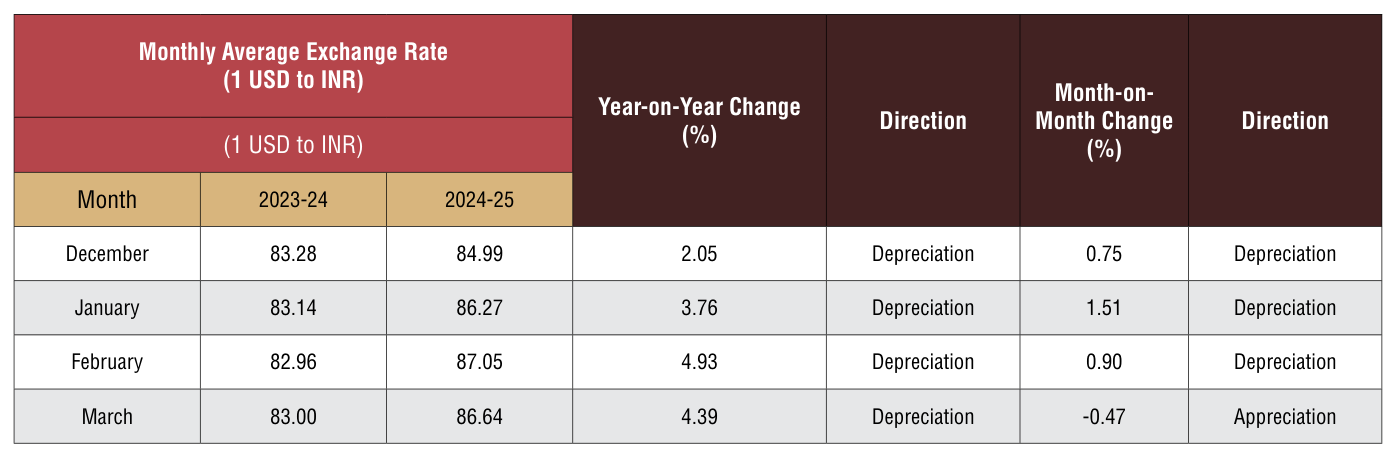
Fig 2: Trend of Rupee vis-a-vis US dollar from April 2021 (Monthly Average Rate of FBIL has been considered)
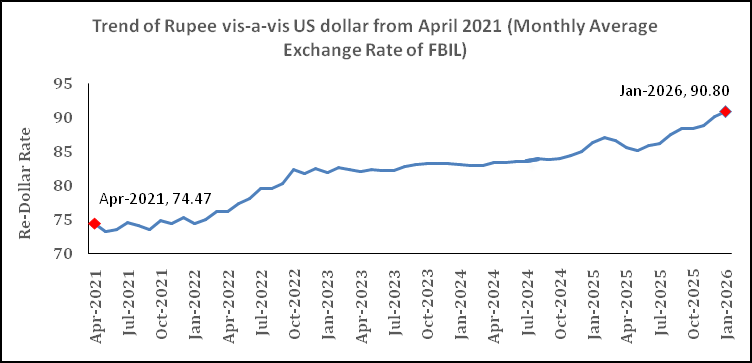
Source: FBIL
ANALYSIS OF INDIA’S ENGINEERING IMPORTS
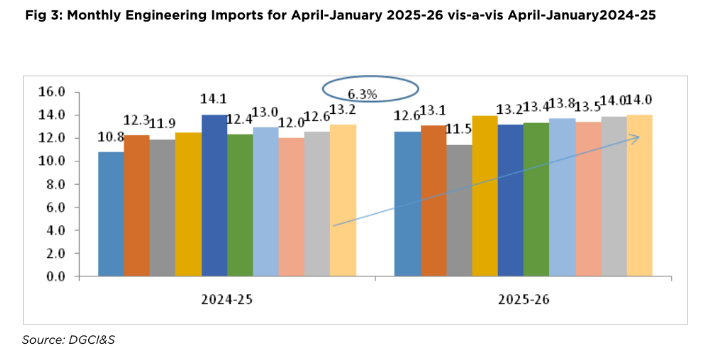
- India’s Engineering imports during January 2026 were valued at US$ 14.0 billion to US$ 13.2 billion in January 2025 registering a positive growth of 6.3percent in dollar terms.In cumulative terms (Apr‑Dec 2025), India’s imports increased by 8 percent.
- In January 2026, imports increased sharply for Copper and its products along with increase in Two and Three Wheelers, Auto tyres and tubes, Motor vehicles and cars, Copper ande products, Nuclear ractors and boilers etc, Tin and its products, etc.
- • In January 2026, import increase was mainly noted from WANA, South Asia, ASEAN, North America and Oceania.Iun cumulative terms, imports have increased from all regions barring Latin America, North America, Oceania and SSA
- The share of engineering imports in India’s total merchandise imports in Apr‑Jan 2026 was estimated at 21 percent.
- Almost 42% of India’s imports come from N E Asia and 20% from EU in April‑January 2026. The next major suppliers are ASEAN, North America and WANA
- 42.0% of India’s engineering imports come from N E Asia and 20.7 % from the EU. The next major suppliers are ASEAN (12.6%), North America (7.5%) andWANA (6.9%) during Apr‑ Dec 2025.
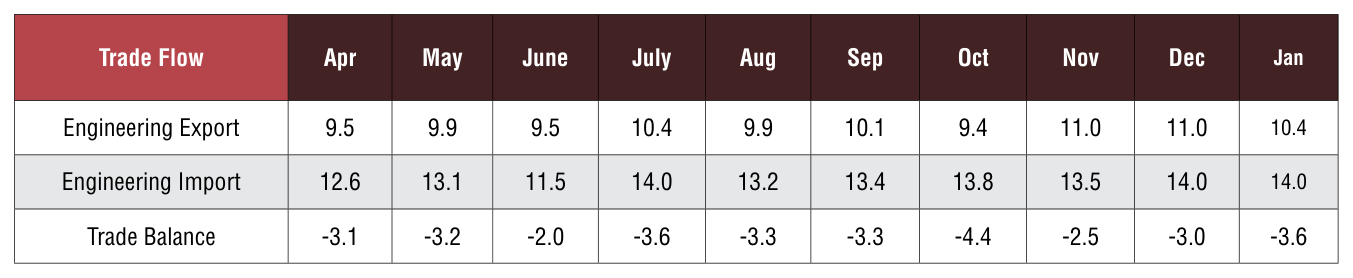
Trend in Engineering Trade Balance
Table 10: Monthly Trend in Engineering Trade Balance for the current FY 2025-26 ‑ Values in US$ Billions
We now present the trend in two‑way yearly trade for the engineering sector for the 2025‑26 depicted in the table below:
Source: DGCI&S, EEPC India Analysis
CONCLUSION

In January 2026, India’s engineering exports bounced back with a double digit growth rate after registering very slow growth last month. While low export base remains one of the major reason behind this growth, Indian engineering exports also bounced back in most of the regions.This is a very positive newsspecially at a time when the global trade is going through realignments pushed by changing geopolitics. As per the recent update by the UNCTAD, as we enter 2026, global trade is subjected to increasing pressure from several factors including slower growth, geopolitical fragmentation, accelerating digital and green transitions and tighter national regulations ‑ UNCTAD estimates global growth will remain subdued at 2.6 per cent in 2025 and 2026, despite potential gains from technologies such as artificial intelligence.
In this situation, we are hopegul that India’s engineering export performance will continue in a growth path. Finally, the recent schemes announced by the Government especially the Market Access Scheme is estimated to be a big enabler of Indian exports. This is crucial at a time when more Indian exporters are eager to participate in global exhibitions and exhibit their products to global markets.
ANNEXURE-I
ENGINEERING PRODUCT PANELS – COUNTRY-WISE ANALYSIS
Engineering Product Panel - Country Matrix
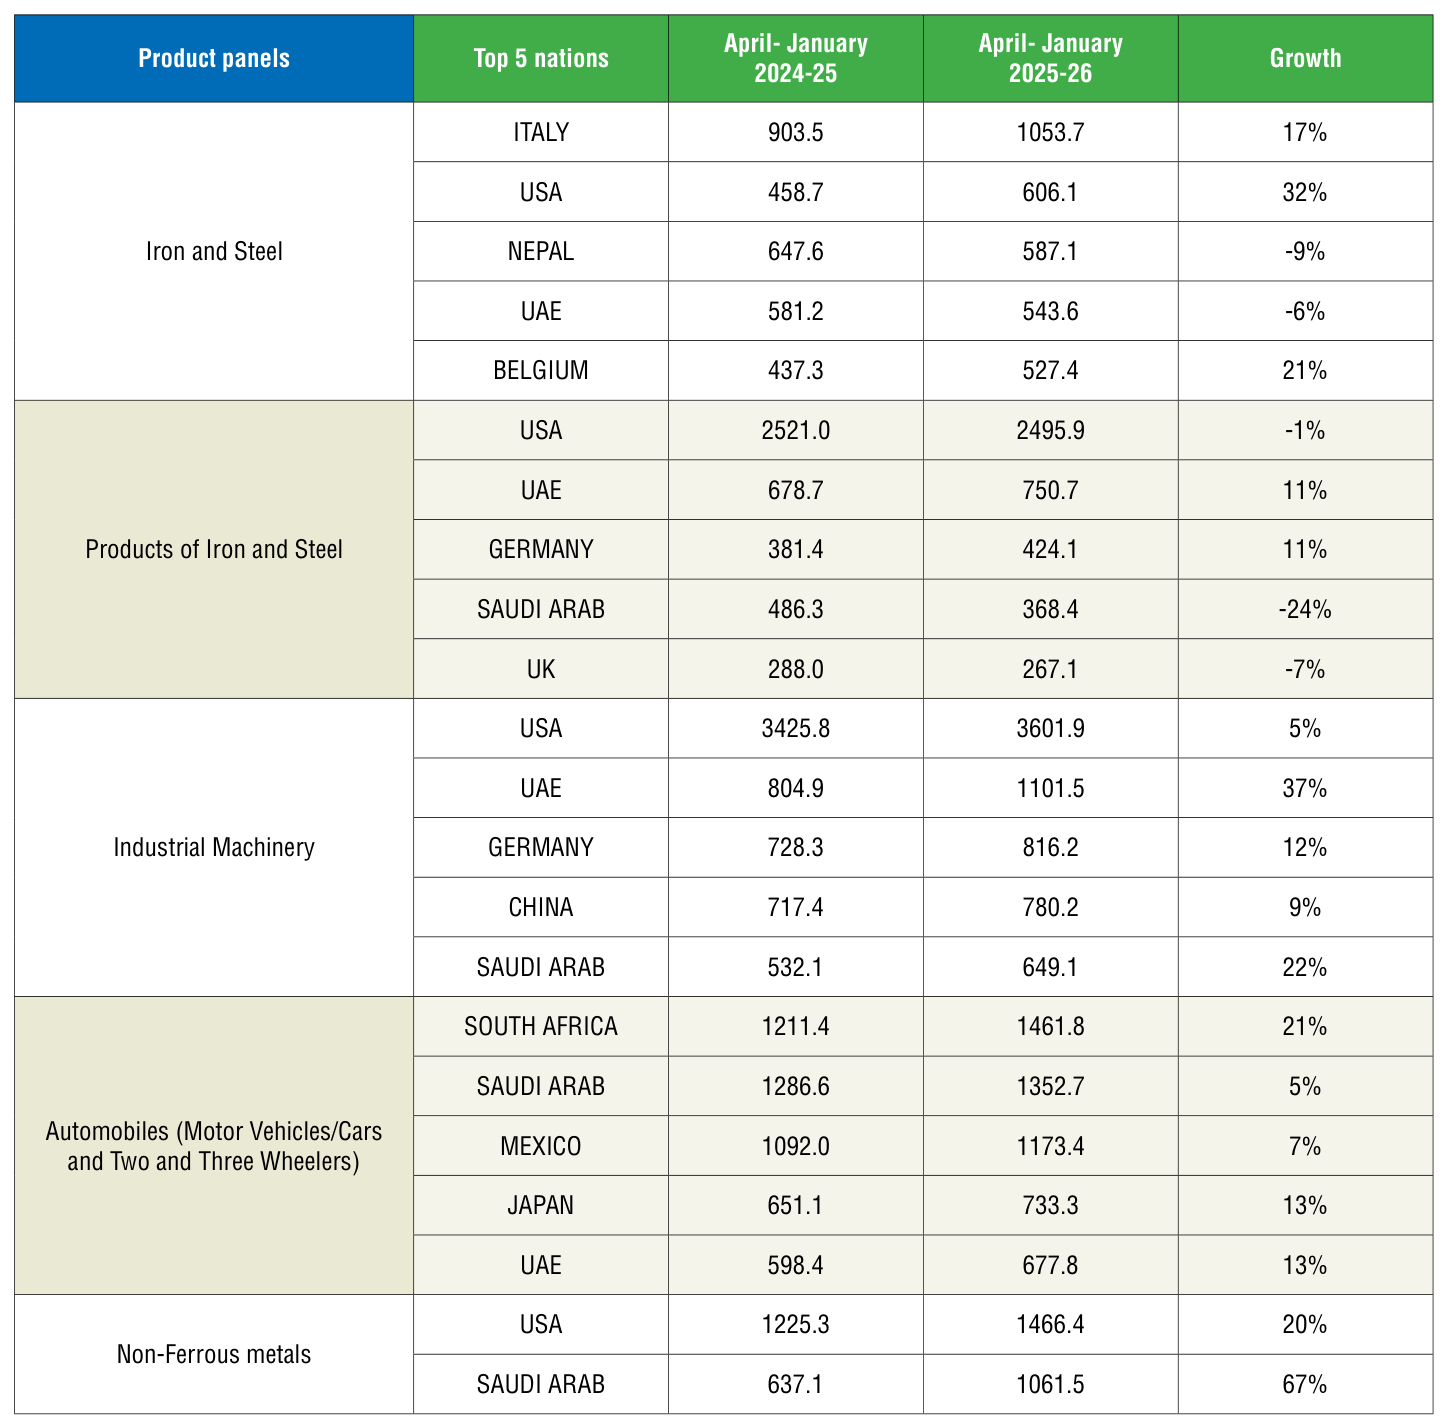
We now analyze the performance of some of the important products for the fiscal April‑January 2025‑26 vis‑à‑vis April‑ January 2024‑25. We have taken the major panels and computed the top importing countries to get an idea of the current trade pattern.
Engineering Product Panel - Country matrix Value in USD million
- In April‑January 2025, Italy, USA and Nepal ranked as the top three importers of Indian Iron and Steel, while the USA, UAE and Germany lead in import of products of Iron & Steel.
- The USA stood out as the primary importer of Indian ‘Industrial ma‑ chinery,’ making up 20% of India’s global exports in this category, followed by UAE and Germany with 6% ad 4% shares, respective‑ ly during April‑January 2025.
- South Africa, Saudi Arab, Mexico, Japan and UAE were top import‑ ers of India’s Automobiles during April‑January 2025 in India’s global exports respectively over the same period previous fiscal.
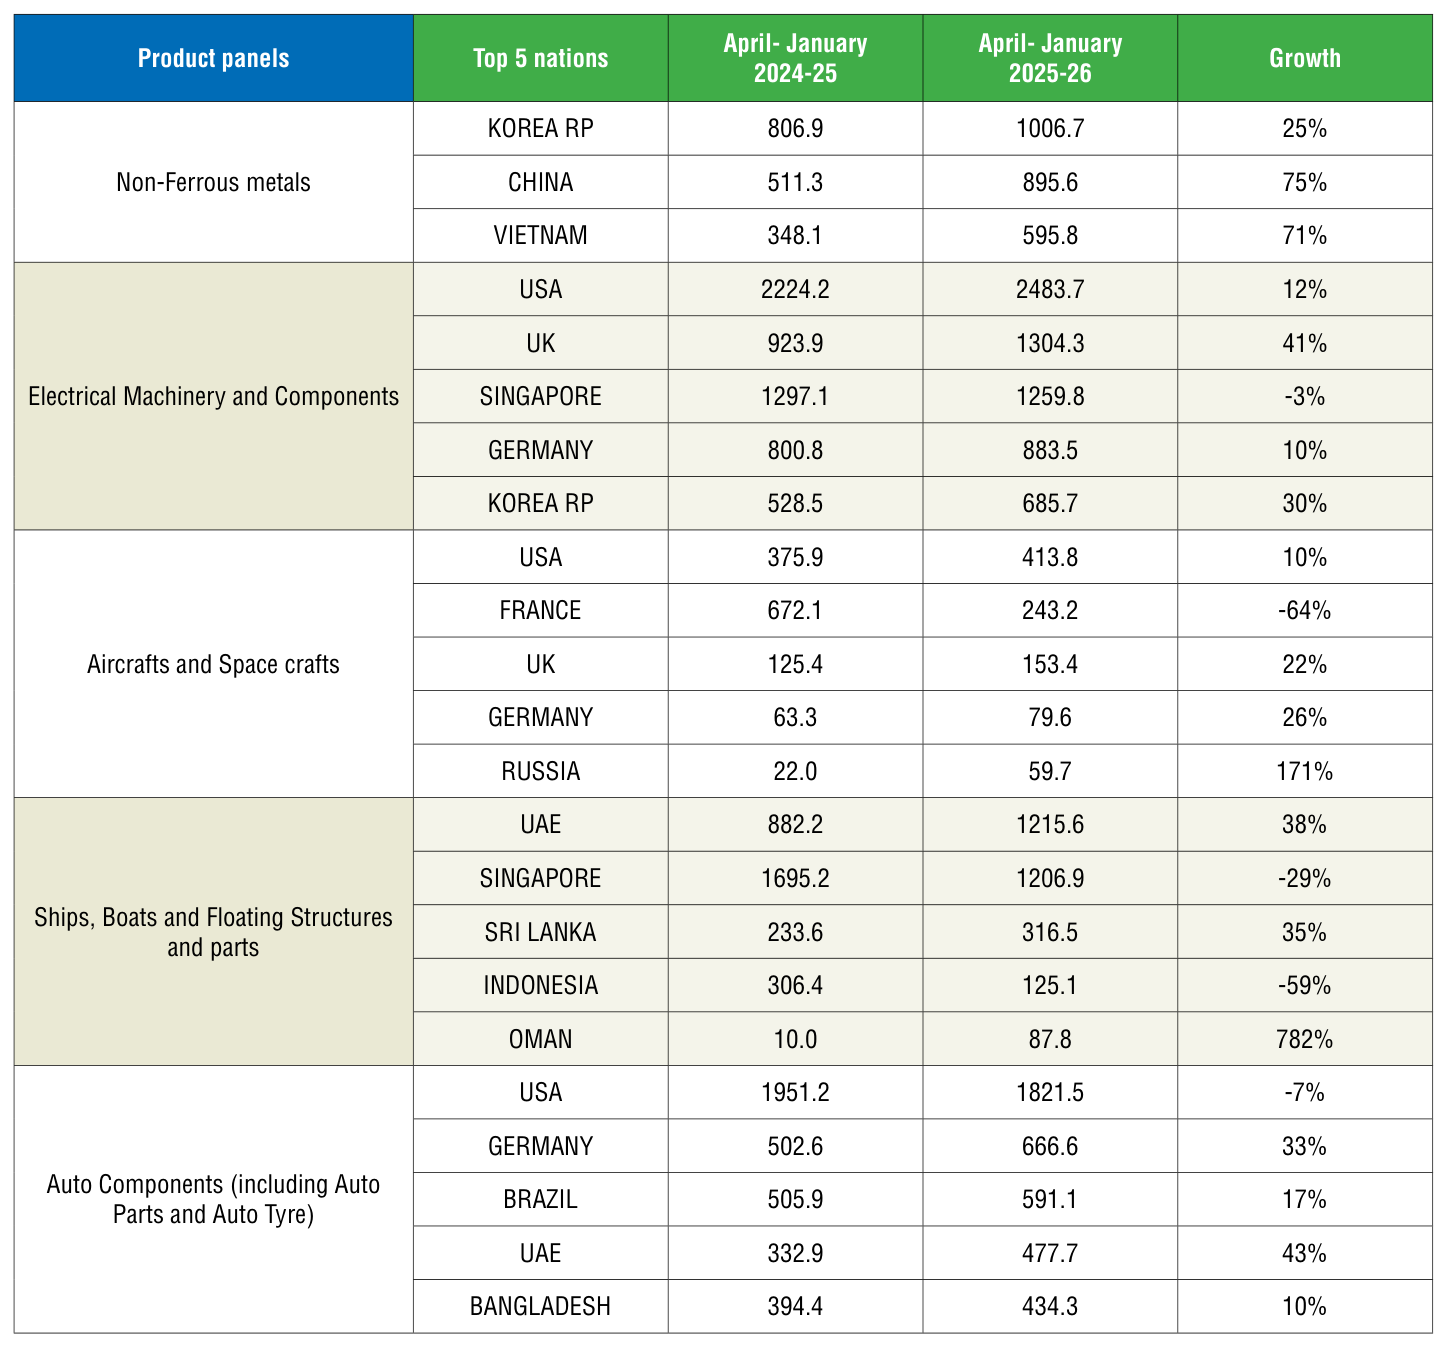
- USA, Saudi Arab, South Korea, China and Vietnam were the top importers of India’s Non‑fer‑ rous metals and products during April‑January 2025.

- USA, UK, Singapore and Ger‑ many were the top importers of Indian Electrical Machinery & Components during the same pe‑ riod with 20%, 10%, 10% and 7% shares respectively.
- USA, France,UK, Germany and Russia were the top importers of India’s Aircrafts and Spacecraft during April‑January 2025, mak‑ ing up to 70% of India’s total ex‑ port of Aircrafts and Spacecraft.
- UAE, Singapore and Sri Lanka became the largest importer of ships, boats and floating struc‑ tures followed by Indonesia and Oman during April‑January 2025.
- For the auto components’ prod‑ uct group, USA remained the top importer in April‑January 2025 followed by Germany, Brazil, UAE and Bangladesh, making up to 41% of India’s total export under this category.

© Copyright , All rights reserved. Design by Andreal