


VOL. 18, ISSUE NO. 11 | February 2026
Oversight


HIGHLIGHTS
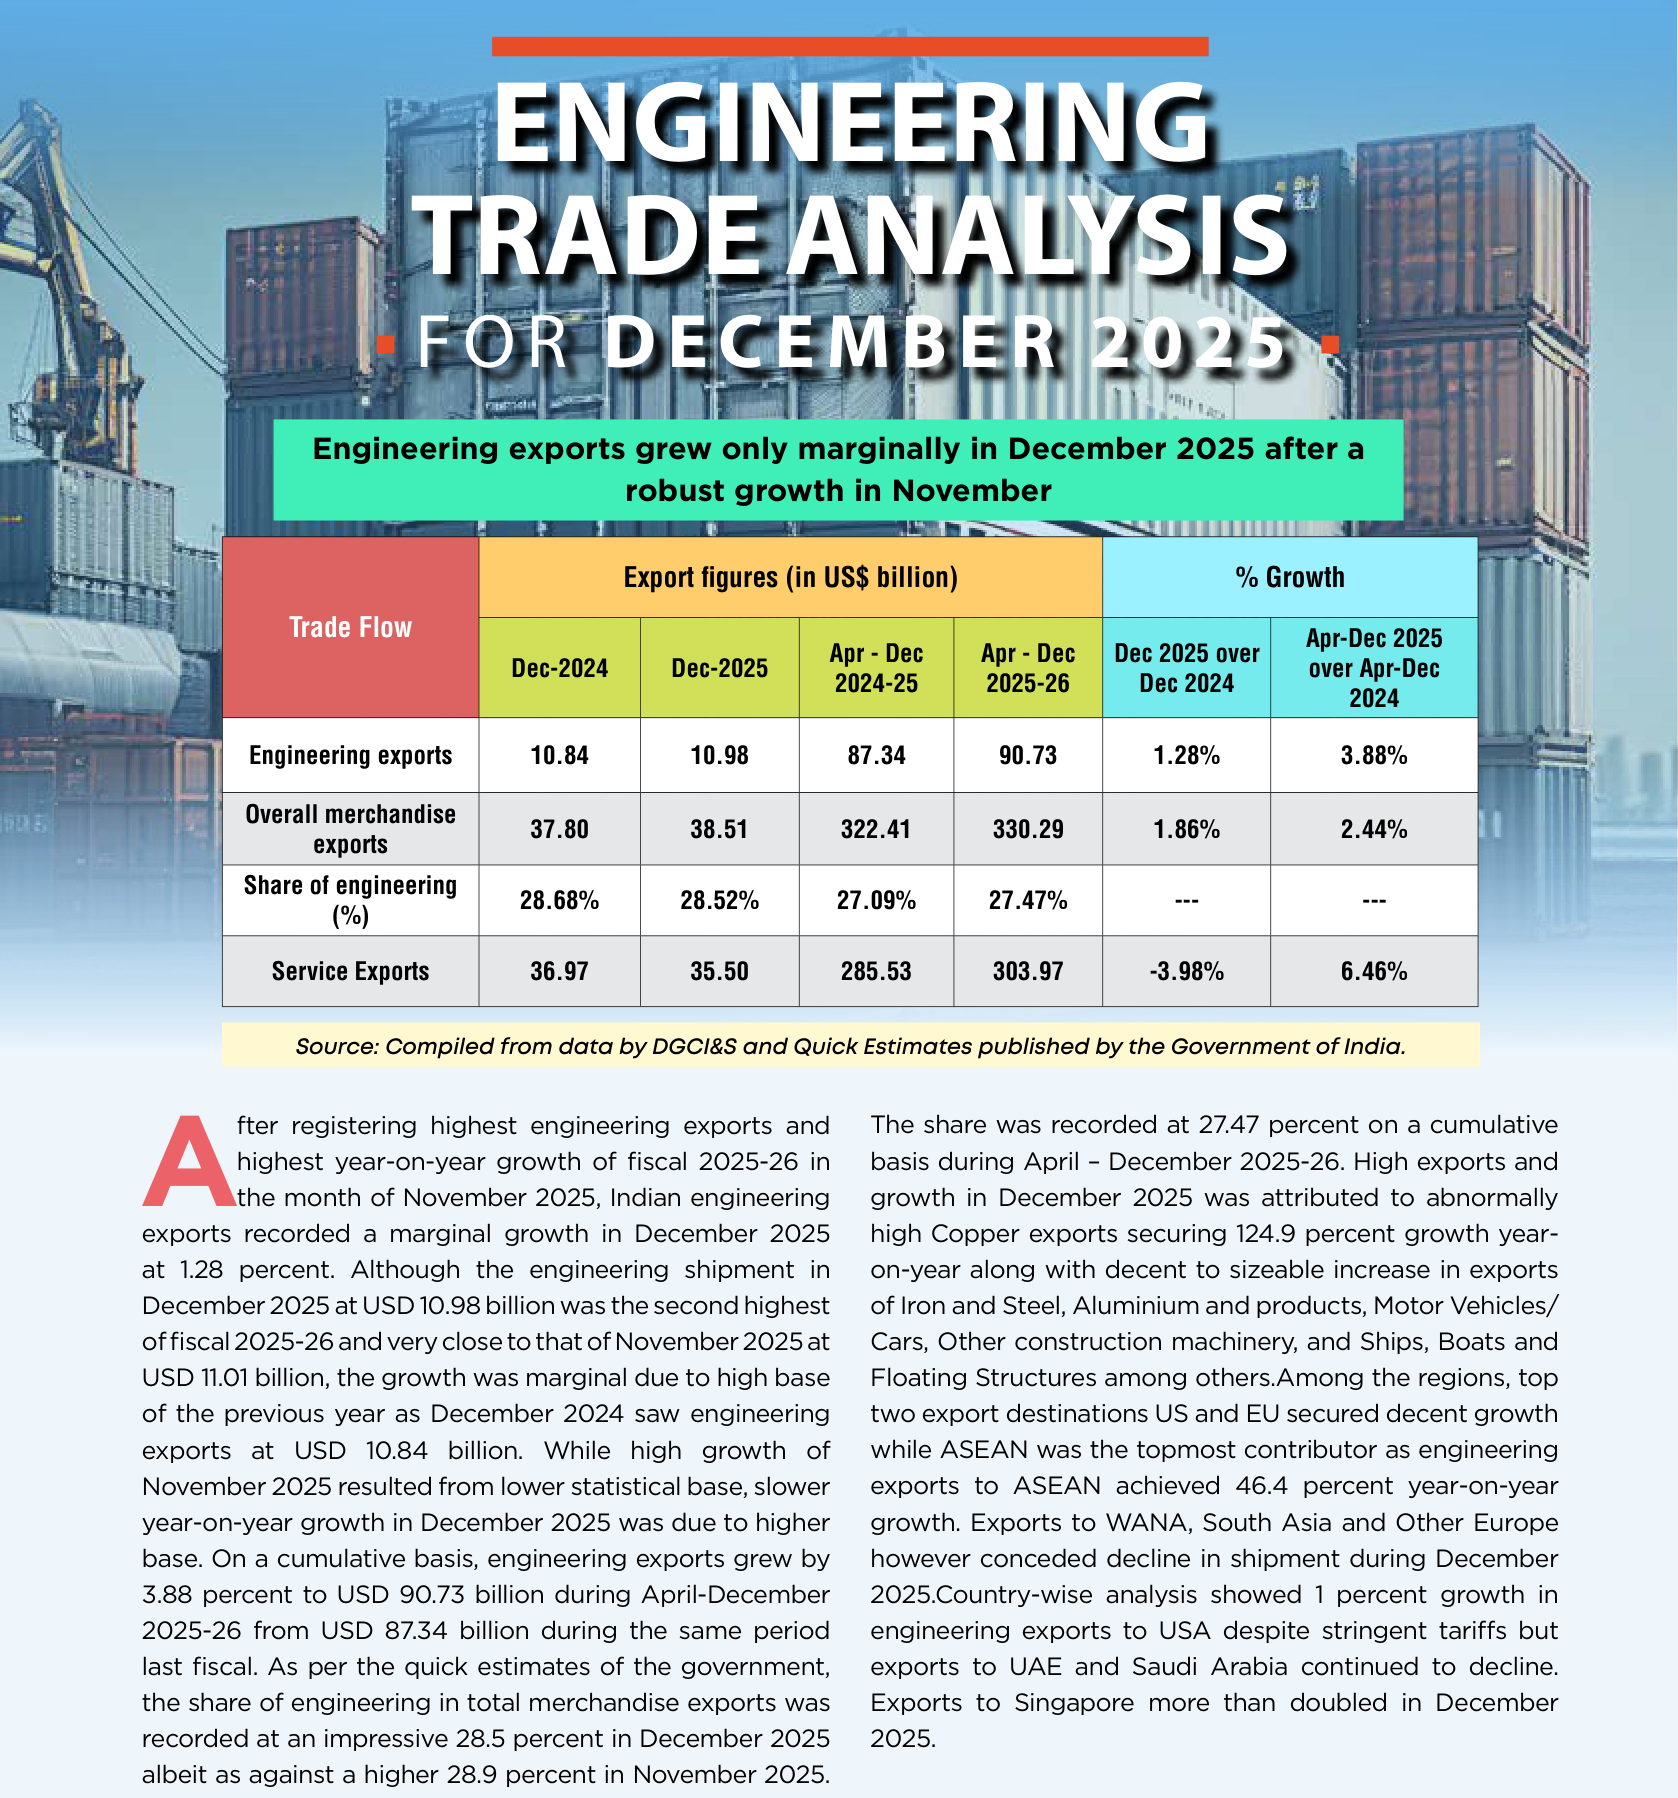
- After registering highest engineering exports and highest yearon-year growth of fiscal 2025-26 in the month of November 2025, Indian engineering exports recorded a marginal growth in December 2025 at 1.28 percent.
- Although the engineering shipment in December 2025 at USD 10.98 billion was the second highest of fiscal 2025-26 and very close to that of November 2025 at USD 11.01 billion, the growth was marginal due to high base of the previous year as December 2024 saw engineering exports at USD 10.84 billion.
- While slower year-on-year growth in December 2025 was due to higher base, high growth of November 2025 resulted from lower statistical base.
- On a cumulative basis, engineering exports from India grew by 3.88 percent to USD 90.73 billion during April-December 2025-26 from USD 87.34 billion during the same period last fiscal.
- As per the quick estimates of the government, the share of engineering in total merchandise exports was recorded at an impressive 28.5 percent in December 2025 albeit as against a higher 28.9 percent in November 2025.The share was recorded at 27.47 percent on a cumulative basis during April – December 2025-26.
- In December 2025, 29 out of 34 engineering panels witnessed positive year-on-year growth. While 5 engineering panels including zinc and its products, aircraft, spacecraft and parts, medical and scientific instrument, hand tools and cutting tools and prime mica and products witnessed decline in exports during December 2025 vis-à-visDecember 2024.
- On a cumulative basis, 31 out of 34 engineering panels recorded growth and remaining 3 engineering panels including Aircraft and Spacecrafts, Ships, boats and floating structures and project goods recorded negative growth during April-December 2025-26.
- Region wise, North America and EU remained the top two exporting regions for Indian engineering. Also, export growth was recorded in all regions in December 2025.In cumulative terms increase was noted in all regions barring WANA, ASEAN, Other Europe and CIS.
- Country-wise, USA remained the top destination followed by UAE and Saudi Arabiaalthough exports to both countries declined year-on-year in December 2025.On a cumulative basis too, decline was noted in UAE and Saudi Arabia.
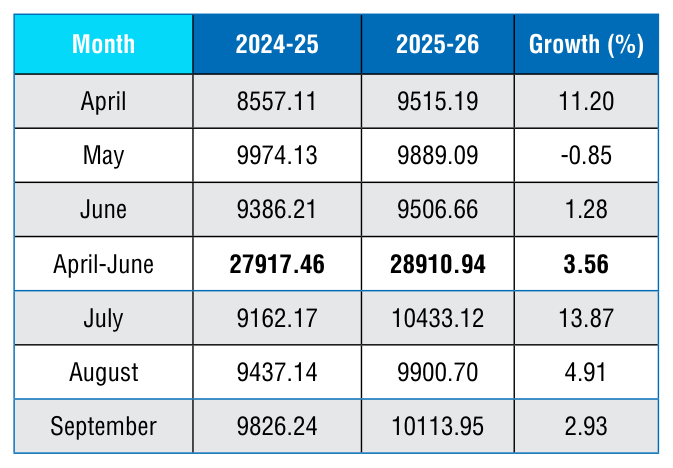
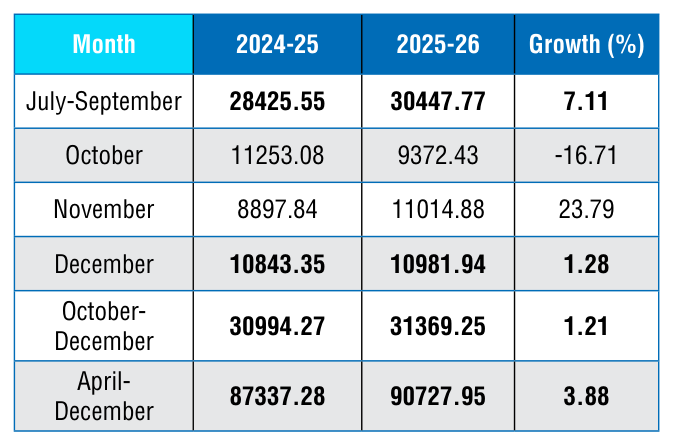
Engineering Exports: Monthly Trend
The monthly engineering export figures for 2025-26 vis-à-vis 2024-25 are shown below as per the latest DGCI&S estimates:
Table 1: Engineering Exports: Monthly Trend in 2025-26 (Values in US$ million)
Source: DGCI&S, Govt. of India
TOP 25 ENGINEERING EXPORT DESTINATIONS IN DECEMBER 2025
We now look at the export scenario of the top 25 nations that had highest demand for Indian engineering products during December 2025 over December 2024 as well as in cumulative terms during April-December 2025-26 vis-à-vis April-December 2024-25. The data clearly shows that top 25 countries contribute almost 75 % of total engineering exports.
Table 2: Engineering exports country-wise (Values in US$ Million)
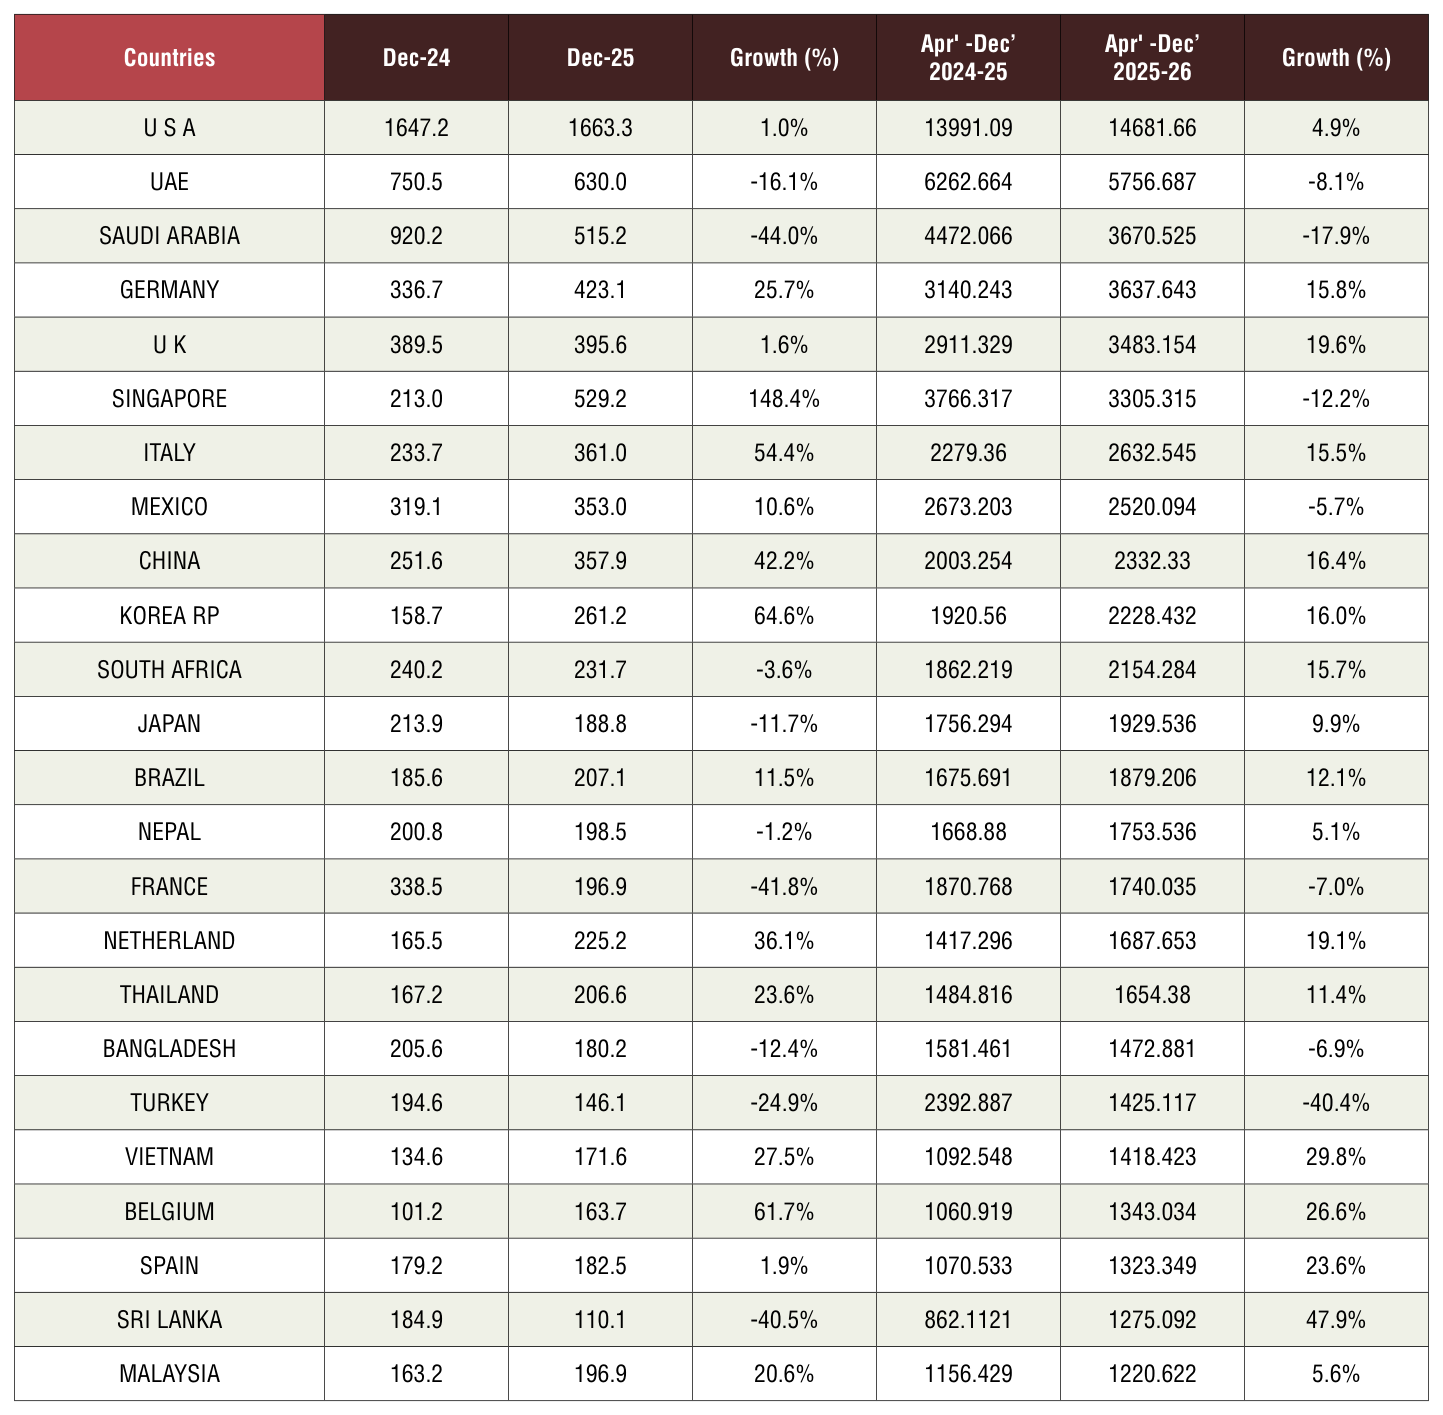
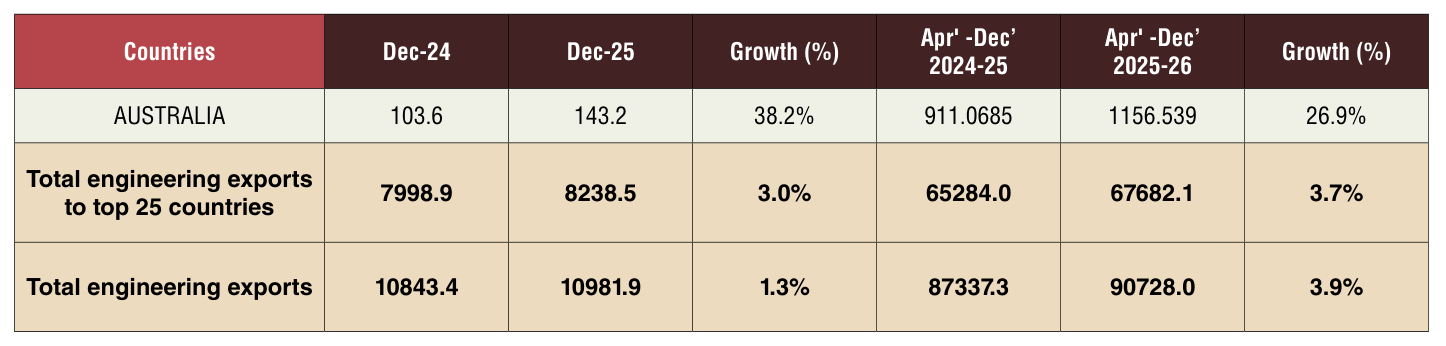
Table 1 - Page 77
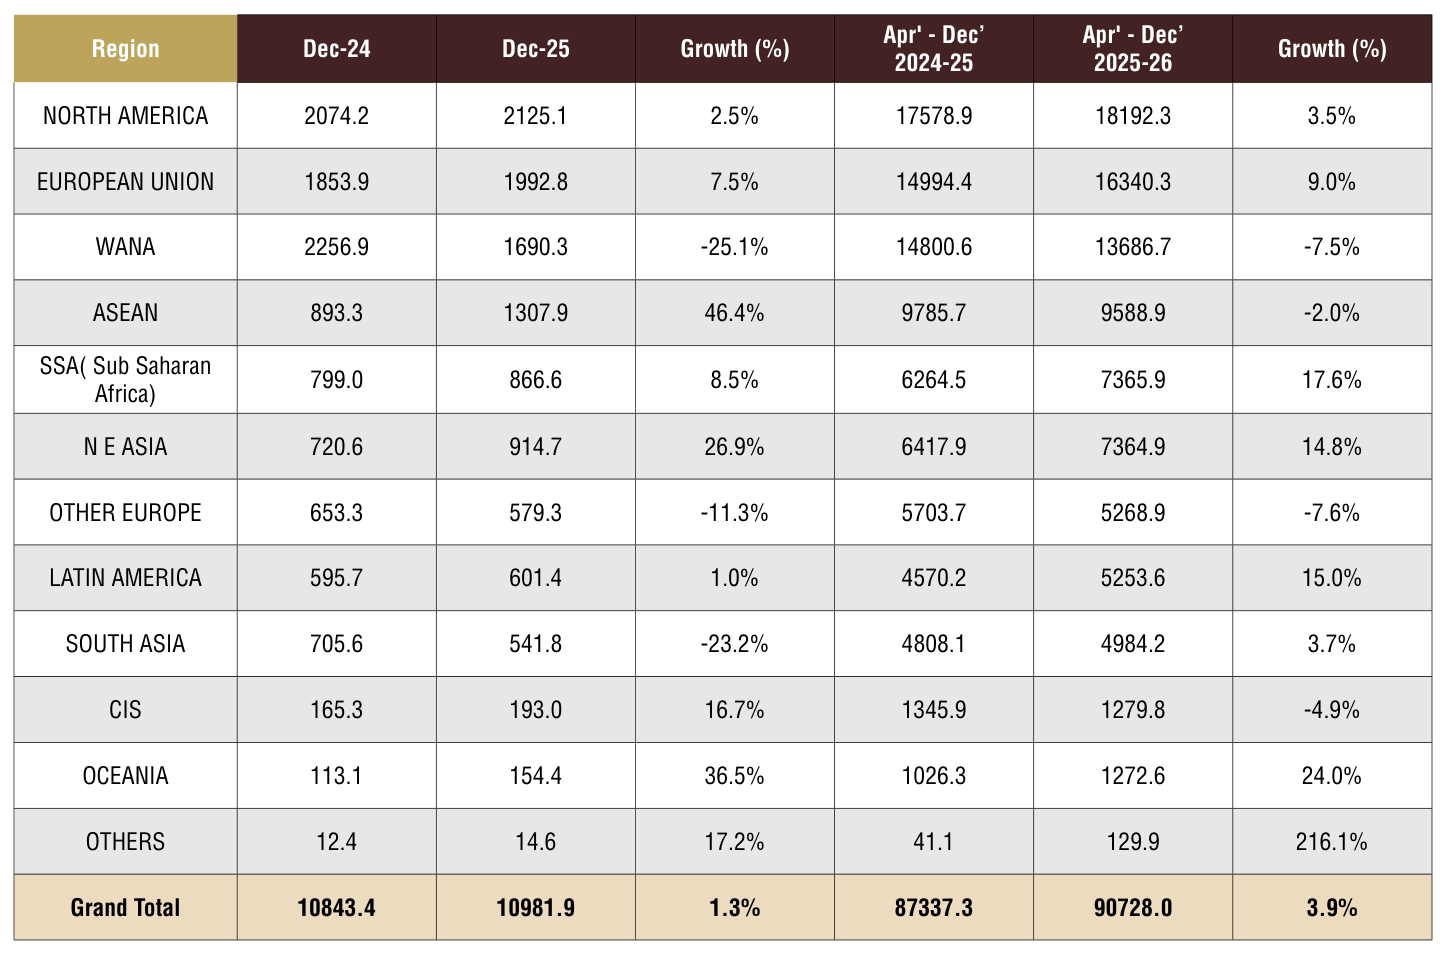
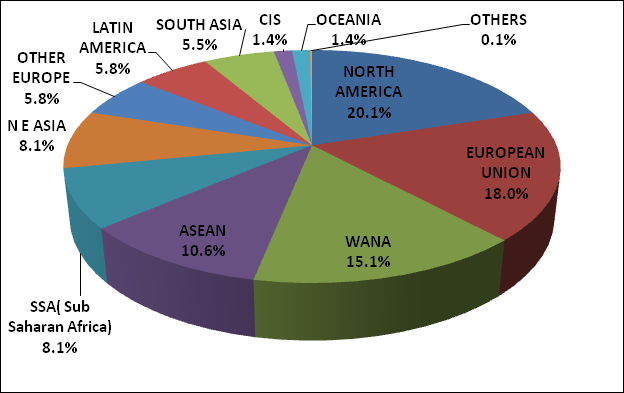
REGION WISE INDIA'S ENGINEERING EXPORTS
The following table depicts region wise India’s engineering exports for April-November 2025 as compared to April-November 2024
Table 3: Region wise engineering exports in April-December 2025-26 vis-à-vis April-December 2024-25
Source: DGCI&S
Note: Myanmar has been included in ASEAN and not in South Asia, since ASEAN is a formal economic grouping.
Region-wise observations:
- WANA: Exports to WANA declined on both monthly and cumulative basis. The decline in exports to WANA is mainly due to significant drop in exports to UAE (8.1% decline on a cumulative basis and 16.1% decline in monthly basis) and Saudi Arabia (17.9% decline on a cumulative basis and 44% decline in monthly basis). Panel-wise observation indicates the major decline is witnessed in aircraft, spacecraft and parts. The decline in exports can be attributed to volatility in MRO activities. The industry also feels that since the imposition of the US tariffs and increased compliance regarding origin of goods, it has become difficult for Indian exporters to use UAE as a base for export to US with tax benefits.This has also impacted our exports to UAE. The industry hopes that the recent FTA with Oman will be instrumental in increasing India’s exports to the region
- ASEAN: Exports declined on cumulative basis while in December 2025, exports actually recorded a growth of 46.4%. In December 2025, exports to almost all ASEAN countries including Singapore, Thailand, Vietnam and Malaysia recorded significant growth which is a positive indication.
- Other Europe: Mainly declined due to decline in exports to Turkey – geopolitical conflicts and diplomatic issues have impacted India’s prospects. In December 2025, India’s exports to Turkey declined by around 25% while in cumulative terms it declined by around 40%.
- South Asia: The decline was mainly due to decline in exports to Bangladesh (both monthly and cumulative exports declined by 25% and 40% respectively) and Sri Lanka where monthly exports declined by around 40% mainly due to decline in exports of aircrafts, spacecrafts and parts, cumulative exports stayed positive at 47% growth.
PANEL WISE INDIA’S ENGINEERING EXPORTS
In this section we look at the Engineering Panel wise exports for the month of December 2025 vis-à-vis December 2024 as well as cumulative exports for April-December 2025-26 vis-à-vis April-December 2024-25. These are indicated in the table below.
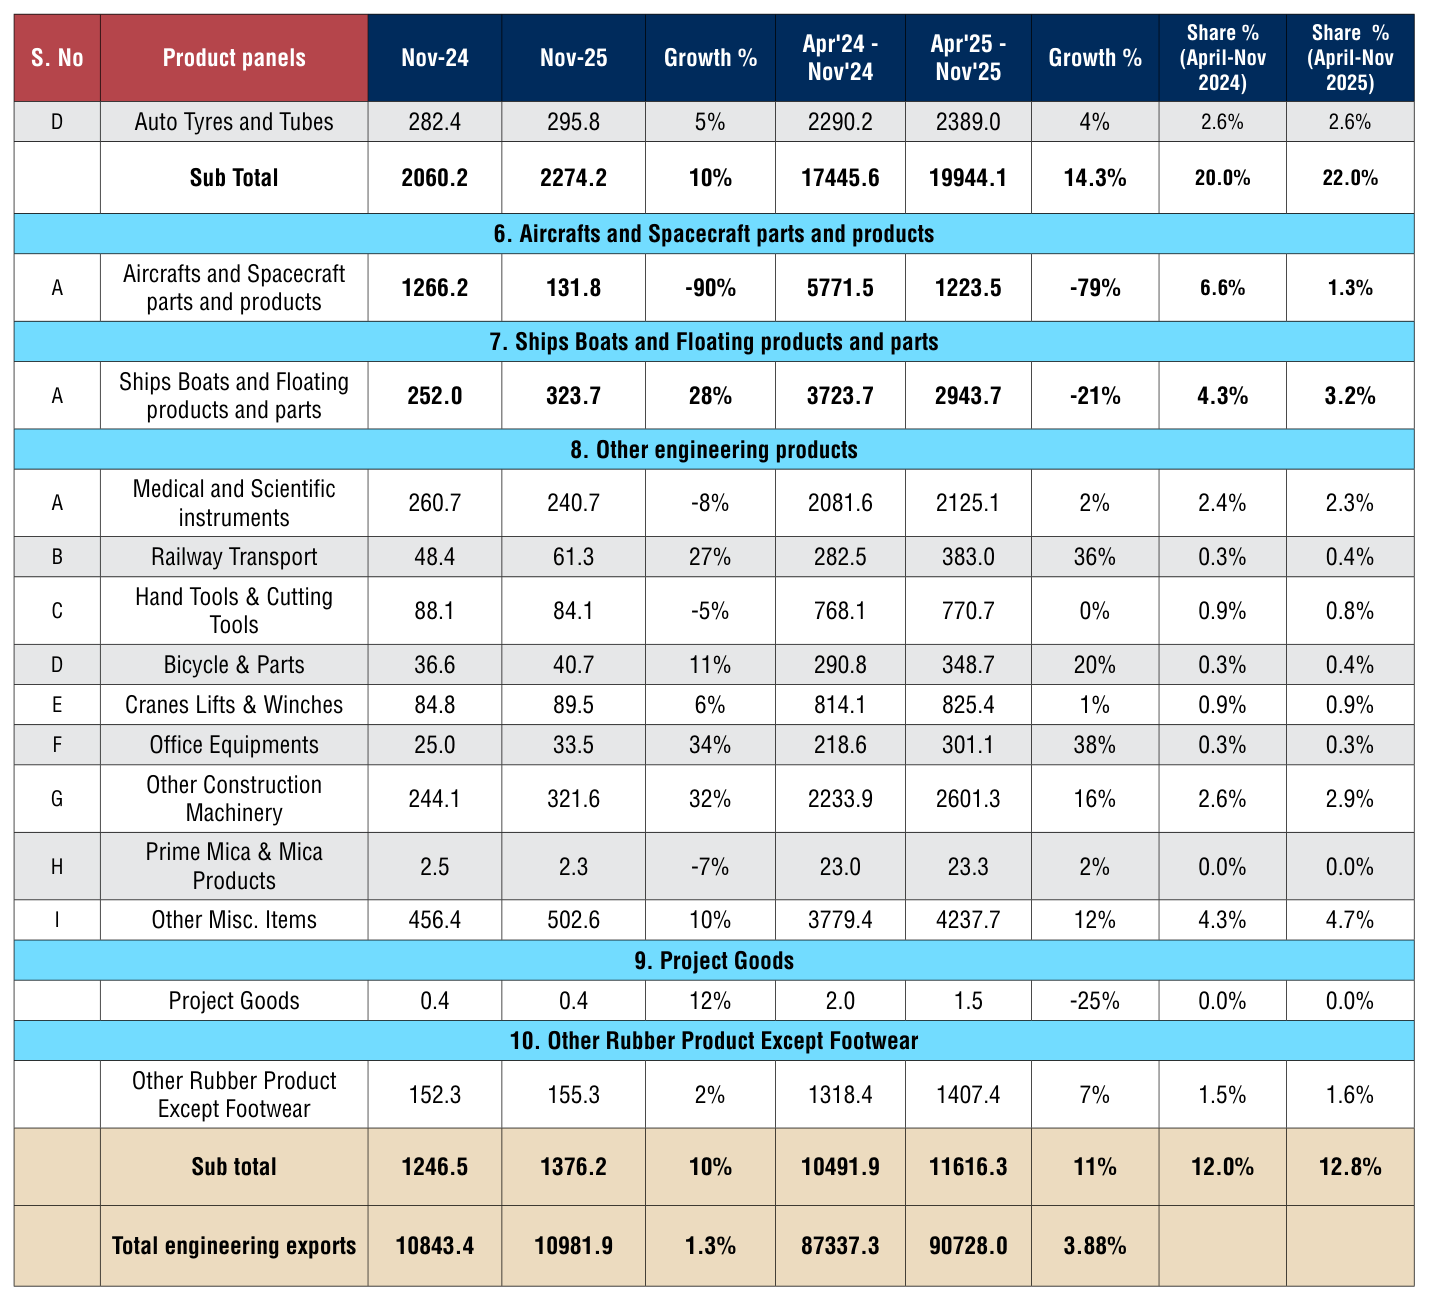
Table 4: Panel-wise Export Analysis for April-December 2025-26 vis-à-visApril-December 2024-25
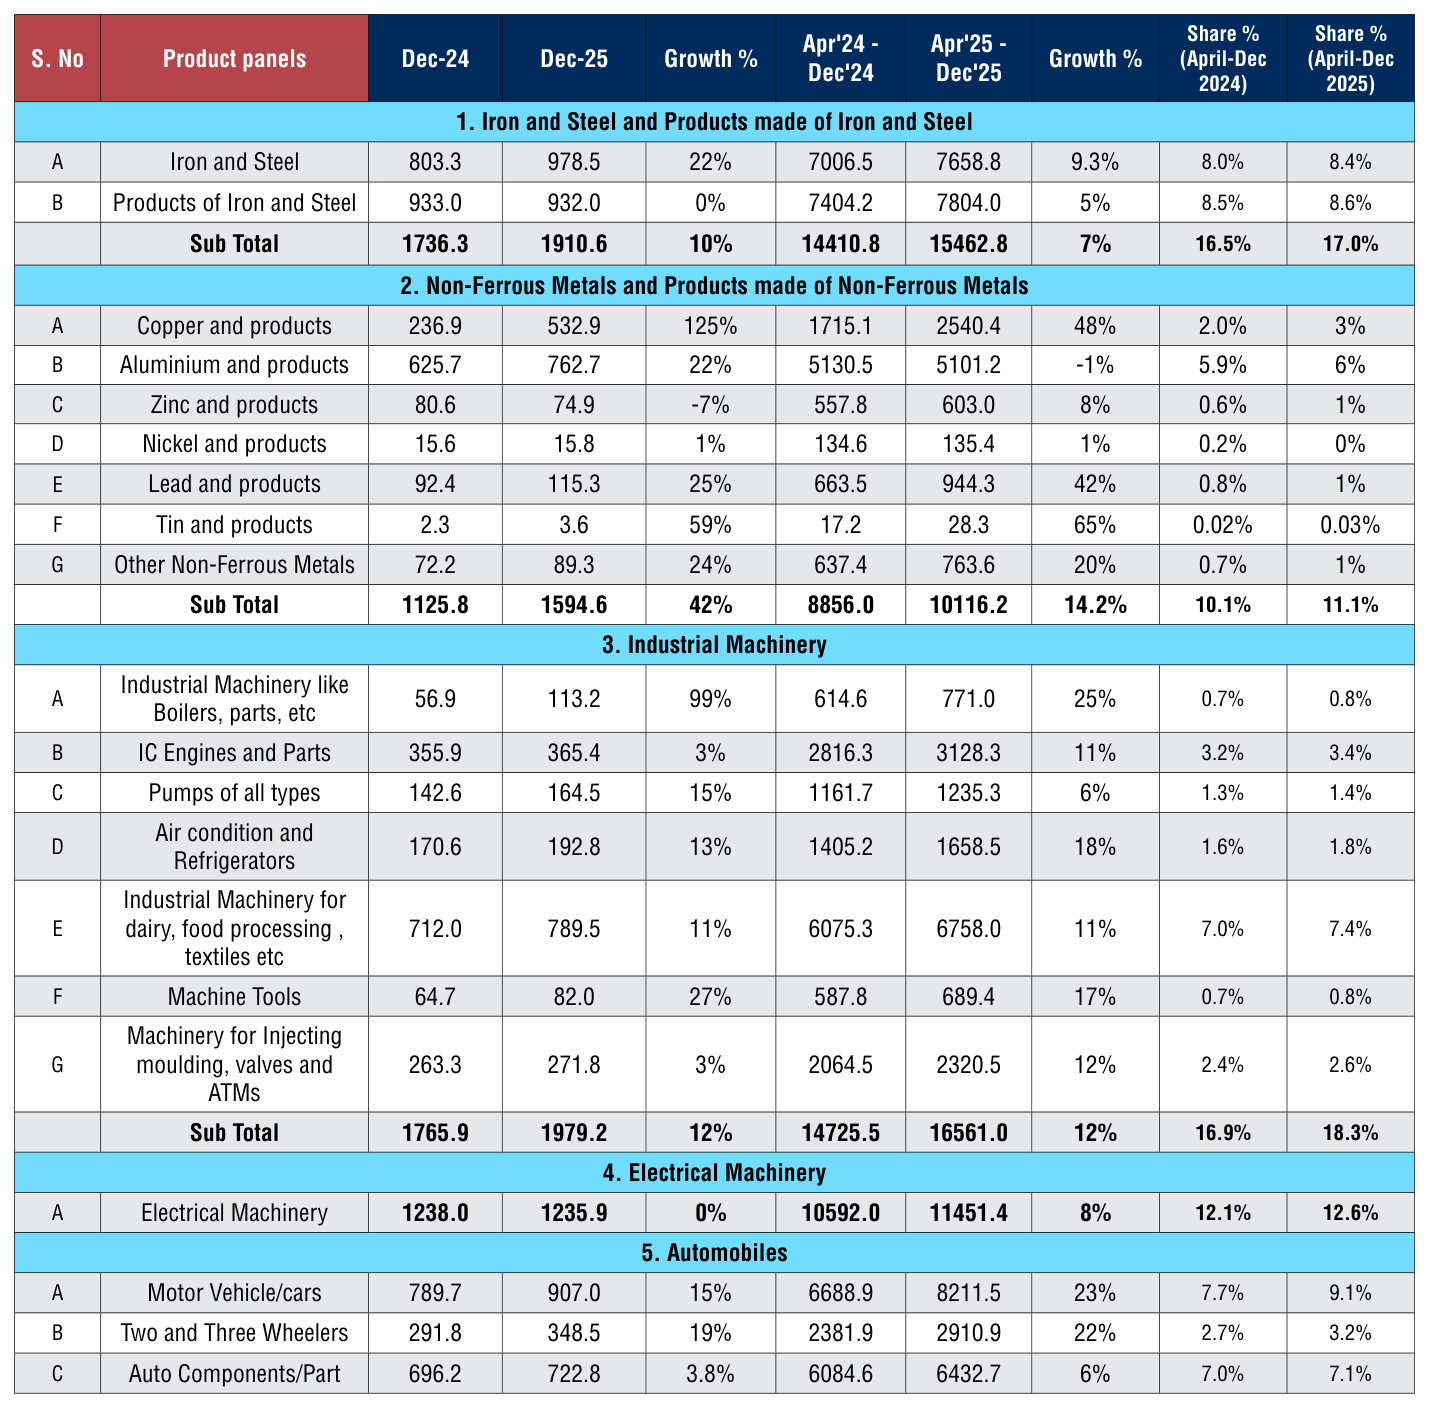
Sectoral Observations:
India’s engineering exports grew by about 3.9% in April–December 2025-26 to around US$90.73 billion, with mixed performance across panels:
- Exports of iron and steel rose by 9.3% during April–December 2025 26, supported by higher shipments of primary steel, while products of iron and steel grew at a slower 5%. Overall, India’s steel exports rose 7% to US$15.46 billion during April–December 2025 26, supported by strong demand from the USA, EU markets (Italy, Belgium, Germany, Spain) and select WANA destinations (Oman, Qatar). As reflected in the BigMint assessment, domestic steel prices remained firm towards end December, with billet, rebar and HRC prices edging up and cost support from higher iron ore, scrap and alloy prices, which helped sustain export competitiveness. However, export growth was partly offset by sharp declines in Saudi Arabia, the UK, Nepal, Russia and Mexico. Global price volatility and fluctuating raw material costs resulted in slower growth compared
- The non-ferrous metals panel emerged as a major growth driver, with exports rising by 14.2% to US$10.12 billion during April–December 2025 26. Among which,
i. Aluminium and aluminium products witnessed a marginal decline to US$5.10 billion from US$5.13 billion. India’s Apr– Dec 2025 26 aluminium export value dipped ~1% chiefly due to a sharp fall in shipments to a handful of markets—Turkey, Mexico, Korea, and Bangladesh—which outweighed strong gains to the USA, Vietnam, China, EU and WANA; a mild price/realisation softening in late Q3–Q4 further capped headline values.
ii. Copper and copper products surged to US$2.54 billion from US$1.72 billion, a sharp 48% increase. India’s exports of copper and products rose sharply by 48% to US$2.54 billion in April–December 2025 26, driven by strong demand from China, Saudi Arabia, Korea, the USA and key EU markets. The surge was further supported by higher global copper prices, with LME copper rallying sharply, which lifted export realisations. The price uptrend also pushed up domestic copper scrap and CCR prices by 5–9% w o w, boosting export values despite a brief slowdown in domestic spot trading as buyers adopted a wait and watch approach.
iii. Lead and lead products rose significantly to US$944 million (+42%), while tin products expanded to US$28 million (+65%), albeit on a low base.
- Exports of industrial machinery increased by 12% to US$16.56 billion during April–December 2025 26, driven by strong demand for boilers, processing machinery, and machine tools, reflecting rising global investment in automation and manufacturing. However, exports of IC engines and parts grew only moderately.

- Exports of electrical machinery grew by 8% to US$11.45 billion, supported by demand for power equipment, switchgear, and transmission-related products.Despite this, monthly exports showed stagnation.
- The automobile sector recorded robust growth of 14.3%, with exports reaching US$19.94 billion, led by South Africa, Mexico, UAE and Saudi Arabia, reflecting sustained demand for vehicles and components in emerging and West Asian markets. Sharp growth was also observed in Latin America (notably Colombia and Brazil) and Europe (Germany, Spain, UK). In South Asia, a strong rebound in Sri Lanka and Nepal boosted exports. However, shipments to Turkey, Indonesia and the USA moderated
- Exports of other engineering products rose by 11% to US$11.62 billion, supported by strong growth in railway transport equipment, office equipment, and construction machinery. In contrast, medical and scientific instruments saw a marginal decline
ENGINEERING EXPORTS – STATE-WISE ANALYSIS
State wise engineering export performance- Data as on 2025-26
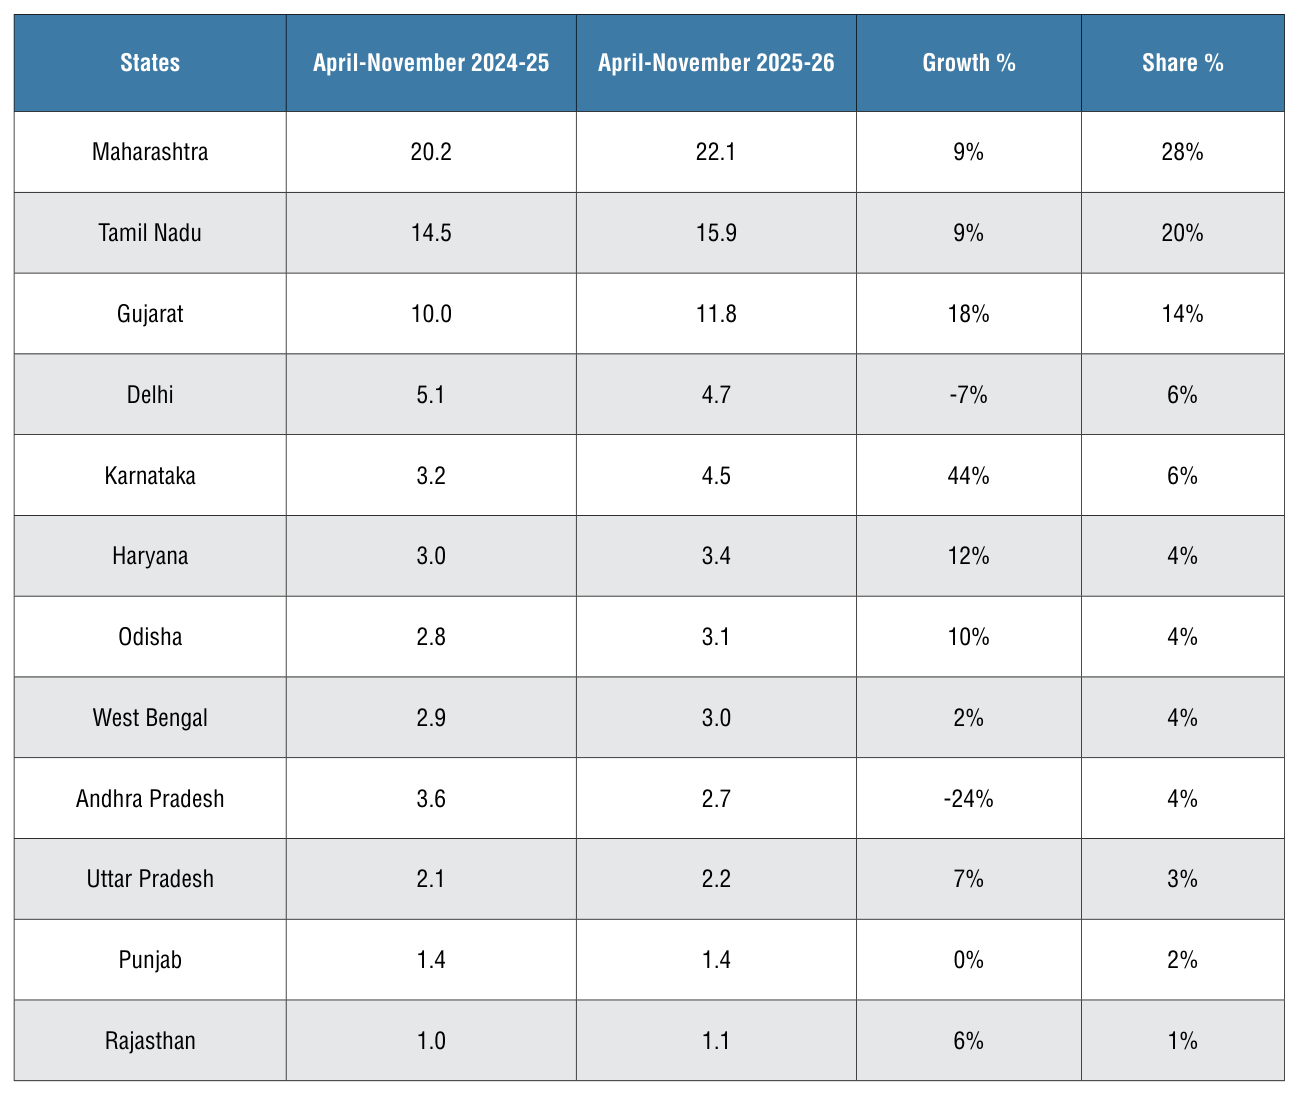
The table below indicates the exports from top Indian states. It is evident from the table that almost 95% of India’s exports is contributed by the listed 12 states. Within this almost more than 60 percent of exports is done by Maharashtra, Tamil Nadu and Gujarat together during April-November 2025-26.
Table 5: Top state wise engineering export performance – April-November 2024-25
Source: DGCIS Portal
Maharashtra leads with 22.1 billion USD in engineering exports (AprilNov 2025-26), up 9% from 20.2 billion USD, securing a 28% national share through its robust ecosystem in engineering goods. West Bengal recorded marginal 2% growth reaching US$ 3 billion, holding a 4% share. Odisha achieved 10% growth to 3.1 billion USD (4% share) during April-November 2025-26.Karnataka achieved the highest growth of 44% during April-November 2025-26 reaching US$ 4.5 billion holding a share of 6%. Delhi contracted 7% to US$4.7 bn (6% share) and Andhra Pradesh fell 24% to US$2.7 bn (4% share), while Punjab was flat. Overall, growth remains concentrated in the western–southern hubs.
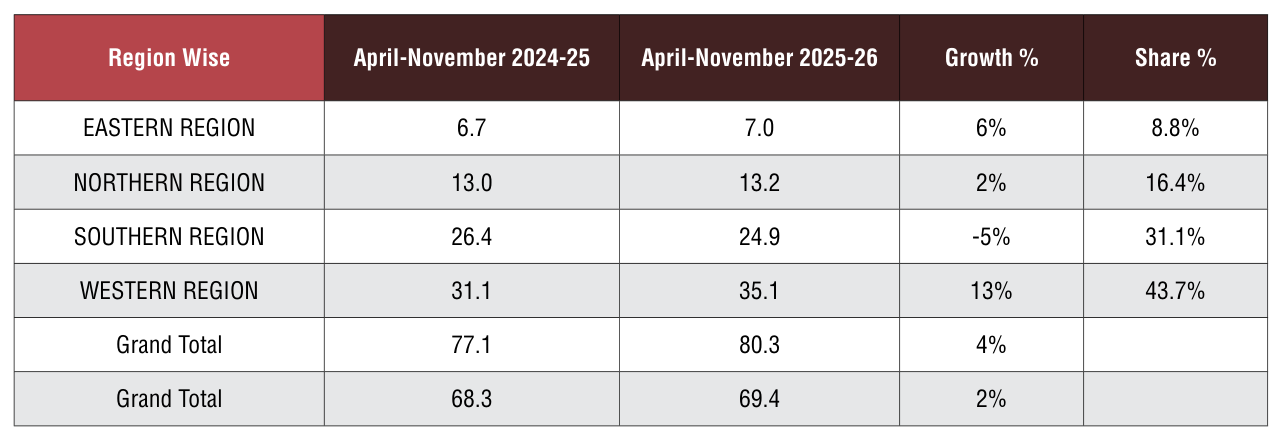
Table 6: India’s Region wise engineering exports - Value in US$ billion
Source: DGCIS Portal
India’s region-wise engineering exports (DGCIS) rose 4% to US$80.3 bn in Apr–Nov 2025 26, led by the Western Region at US$35.1 bn (+13%, 43.7% share), which more than offset a contraction in the Southern Region to US$24.9 bn (–5%, 31.1% share). The Northern Region inched up 2% to US$13.2 bn (16.4% share), while the Eastern Region posted steady growth of 6% to US$7.0 bn (8.8% share). Overall, exports remain highly concentrated in the West and South (~75% share), with the West acting as the primary growth engine this period.
CORRELATION BETWEEN MANUFACTURING OUTPUT AND ENGINEERING EXPORTS
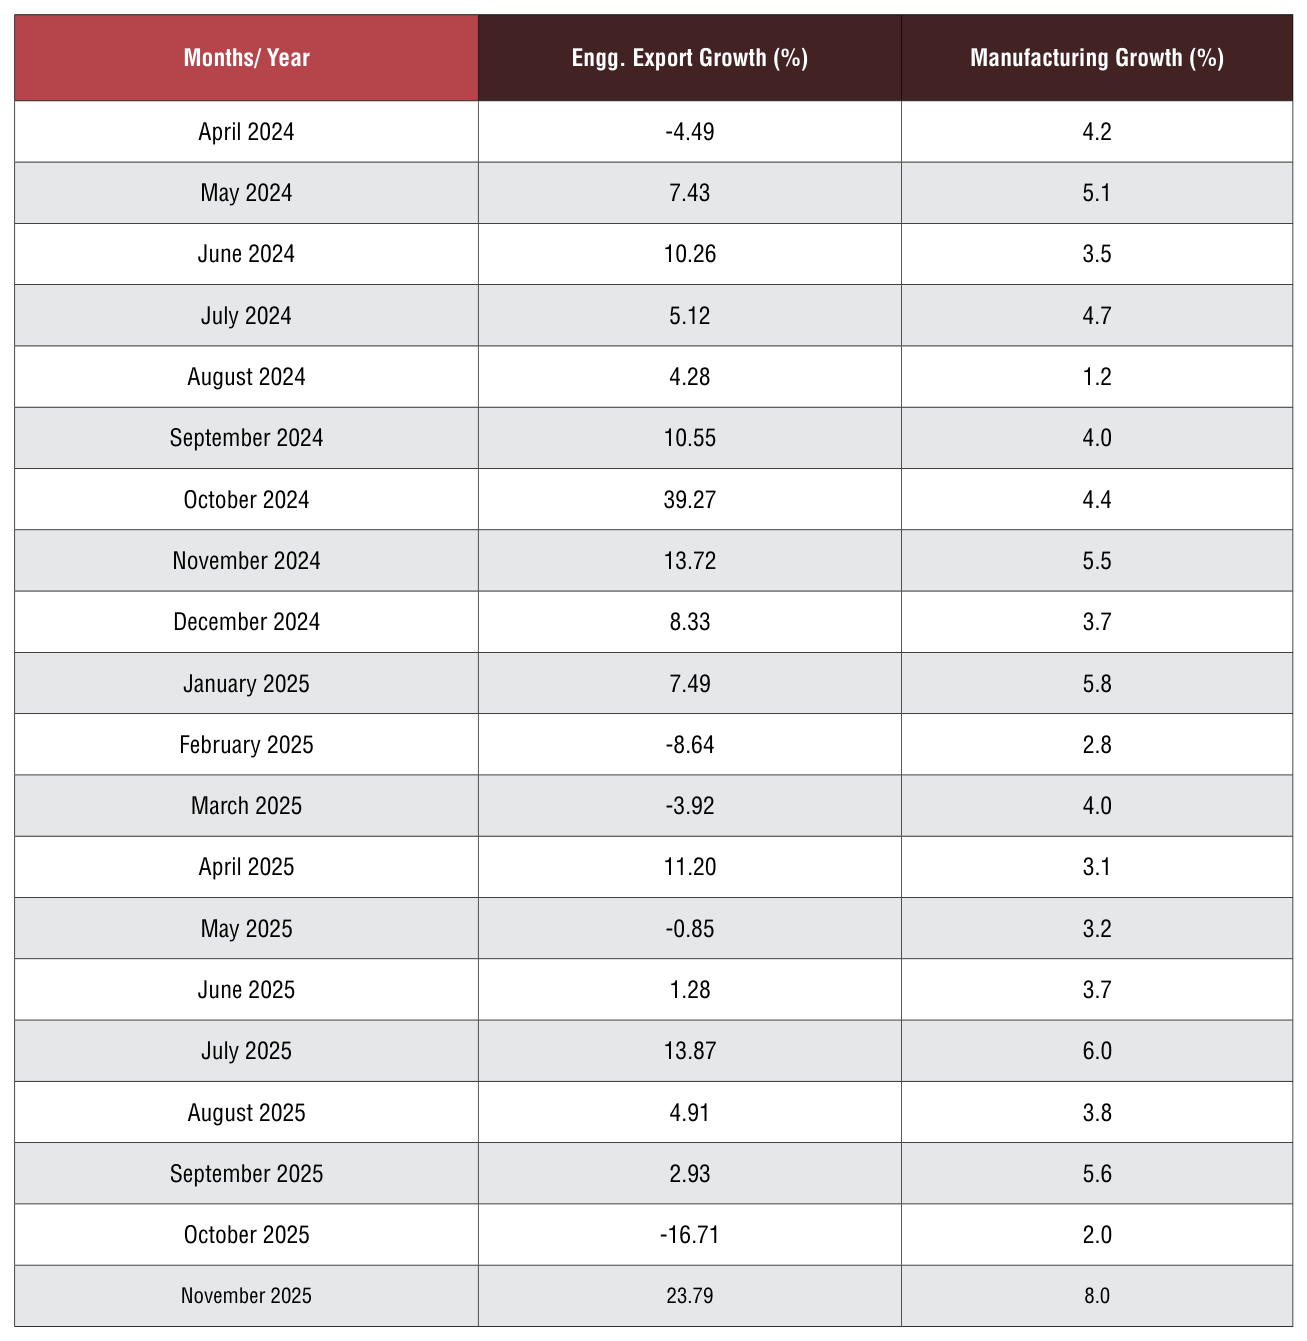
Engineering forms a considerable part of the broader manufacturing sector and the share of engineering production in overall manufacturing output is quite significant. As exports generally come from what is produced within a country, some correlation between manufacturing production growth and engineering export growth should exist. We briefly look at the trend in manufacturing growth as also engineering export growth to see if they move in tandem. It may be mentioned that manufacturing has 77.63% weightage in India’s industrial production.
Engineering export growth and manufacturing output growth moved in the same direction in as many as nine out of twelve months in each of the fiscal years 2019-20 and 2020-21. During fiscal 202122, engineering export growth and manufacturing growth moved in the same direction in seven out of twelve monthswhile in each of fiscal 2022-23 and 2023-24, as many as10 out of 12 months saw engineering exports and manufacturing output moved in the same direction. In 2024-25, both moved in the same direction in eight out of 12 months.
The first two month of fiscal 2025-26 saw engineering export growth and manufacturing output growth moved in the opposite direction. In April, engineering export growth surged to double digitandmanufacturing growth decelerated, while in May engineering export declined and manufacturing output growth inched up over the month. Then, In June, July and August 2025 however, both moved on the same direction.In June and July, both witnessed improvement in growth while in Aug 2025, both conceded moderation in growth. In September 2025 however, engineering growth continued to slowdown but manufacturing growth accelerated.
The link between these two may not be established in one or two months, but a positive correlation may be seen if medium to long term trend is considered.
Table 7: Engineering exports growth vis-à-vis manufacturing growth from April 2024
Source: Department of Commerce and CSO
IMPACT OF EXCHANGE RATE ON INDIA’S EXPORTS
How did the exchange rate fare during December 2025 and what was the recent trend in Re-Dollar movement?In order to get a clearer picture of the recent Re-Dollar trend, not only we took the exchange rate of December 2025, but also considered monthly average exchange rate of Rupee vis-à-vis the US Dollar for each month of fiscal2023-24, 2024-25 and fiscal 2025-26 as per the latest data published, as mere one-month figure does not reflect any trend. The following two tables clearly depicts the short-term trend.
Table 8: USD-INR monthly average exchange rate in 2025-26 vis-à-vis 2024-25 (As per latest data released by FBIL)
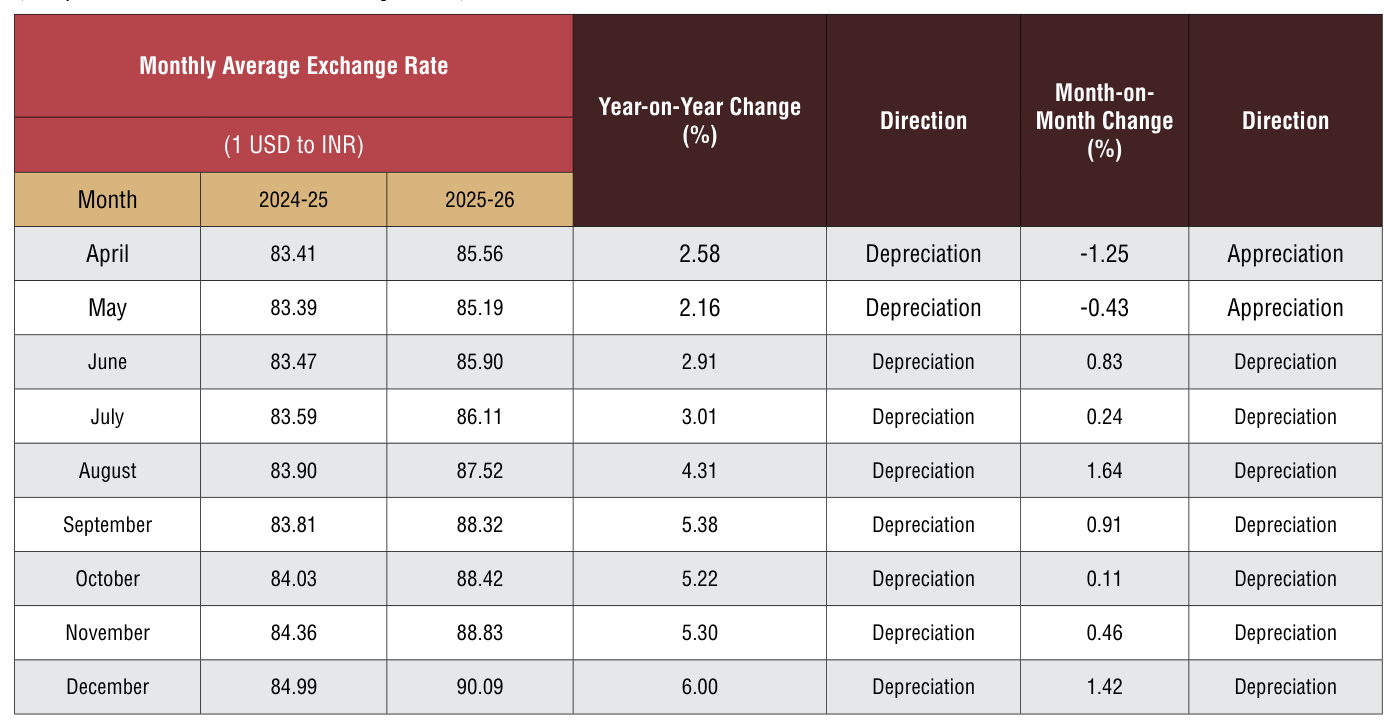
Indian Rupee slipped below 90 per US Dollar for the first time in history and conceded 6 percent depreciation vis-à-vis the greenback in the Calendar year 2025: Depreciation of Indian Rupee continued vis-à-vis the US Dollar for the seventh straight month to December 2025 on a monthly while on a yearly basis, the depreciation continued since last fiscal.INR depreciated vis-à-vis the US Dollar by 1.42 percent in December 2025 over the previous month. Despite of intermittent intervention by the RBI, uncertainty on trade deal with the USA and capital outflow from Indian markets continued to weigh on rupee. Increase in gold import was also sighted as one of the reasons for weakening of rupee.
Table 9: USD-INR monthly average exchange rate in 2024-25 vis-à-vis 2023-24 (As per latest data released by FBIL)
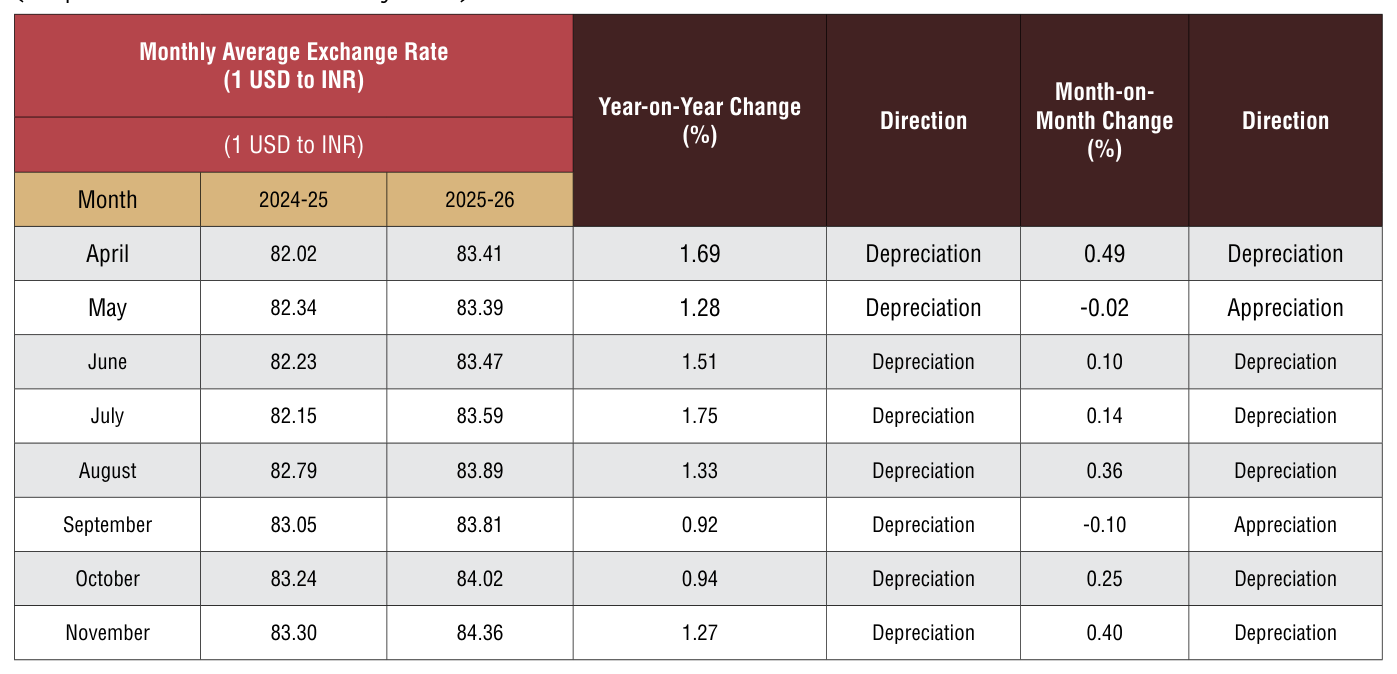
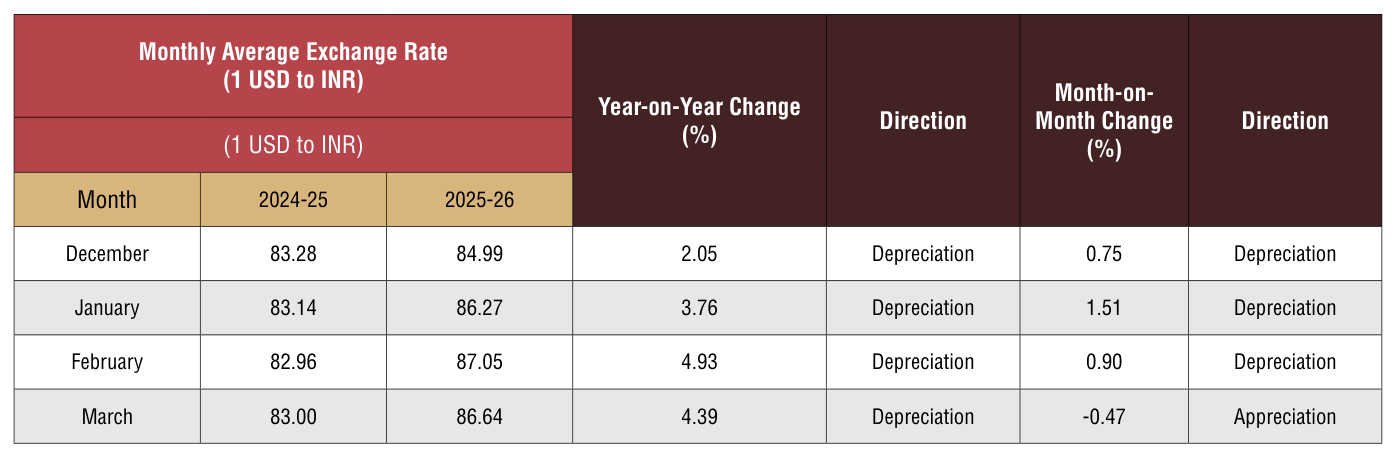
Fig 2: Trend of Rupee vis-a-vis US dollar from April 2021 (Monthly Average Rate of FBIL has been considered)
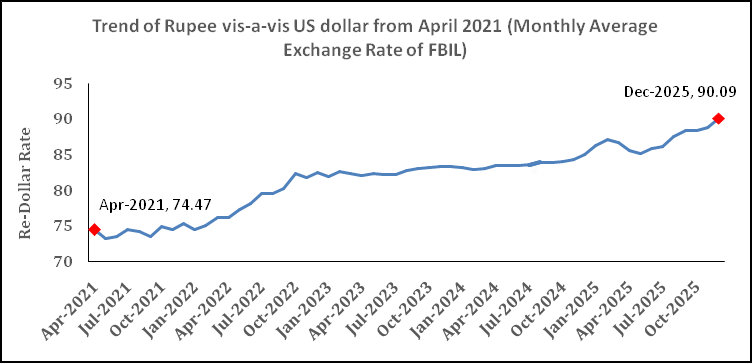
Source: FBIL
ANALYSIS OF INDIA’S ENGINEERING IMPORTS
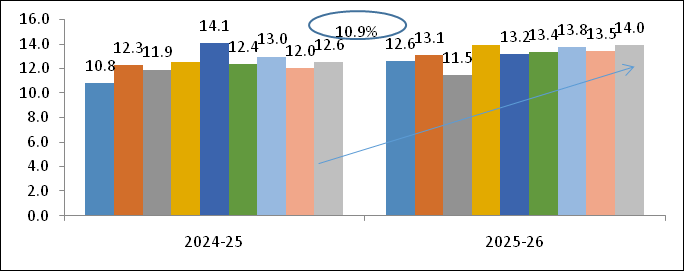
- India’s Engineering imports during December 2025 were valued at US$ 14.0 billion compared to US$ 12.6 billion in December 2024 registering a positive growth of 10.9 percent in dollar terms. In cumulative terms (Apr-Dec 2025), India’s imports increased by 8.2 percent.
- In December 2025, imports increased sharply for Copper and its products along with increase in Two and Three Wheelers, Other Construction Machinery, Aluminium and its products, Electric machinery &equipments, Industrial Machinery for dairy, Medical & Scientific and etc.
- In December 2025, import increase was mainly noted from NE Asia ,ASEAN, EU, South Asia, Latin America and CIS.In cumulative terms, imports increased from all regions barring North America, Oceania and Latin America.
- The share of engineering imports in India’s total merchandise imports in Apr-Dec 2025 was estimated at 21 percent.
- 42.0% of India’s engineering imports come from N E Asia and 20.7 % from the EU. The next major suppliers are ASEAN (12.6%), North America (7.5%) andWANA (6.9%) during AprDec 2025.

Fig 3: Monthly Engineering Imports for April-December 2025-26 vis-a-vis April-December2024-25
Source: DGCI&S
TREND IN ENGINEERING TRADE BALANCE
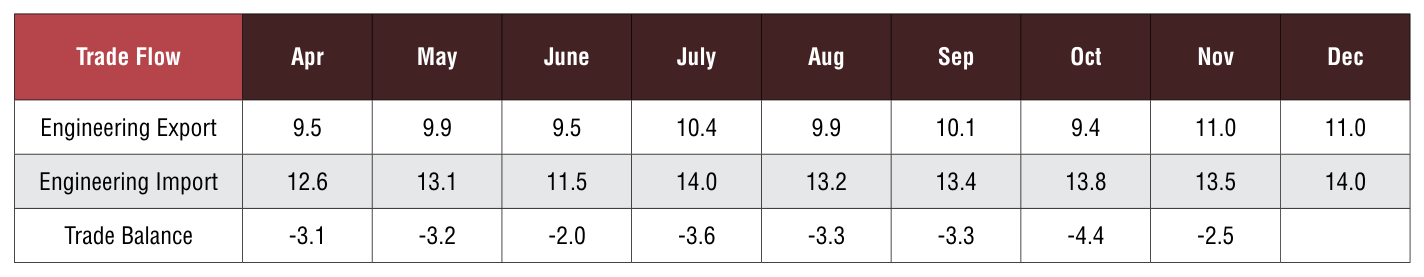
We now present the trend in two-way yearly trade for the engineering sector for the 2025-26 depicted in the table below:
Table 10: Monthly Trend in Engineering Trade Balance for the current FY 2025-26 - Values in US$ Billions
Source: DGCI&S, EEPC India Analysis
CONCLUSION
India’s engineering exports continued its growth run in December 2025 registering a growth of 1.28%. Despite growing protectionsm in the developed countries, India’s engineering exports to US and major EU economies remained positive which is a significantly positive indicator at this difficult time. As per the recent update by the UNCTAD, as we enter 2026, global trade is subjected to increasing pressure from several factors including slower growth, geopolitical

fragmentation, accelerating digital and green transitions and tighter national regulations - UNCTAD estimates global growth will remain subdued at 2.6 per cent in 2025 and 2026, despite potential gains from technologies such as artificial intelligence. The various policies and steps adopted by the Government of India has assumed importance at this critical juncture. The FTA with EU is expected to result in significant gains for the exporting community.The Government also announced The Market Access Support (MAS) scheme under the Export Promotion Mission - Niryat Disha notified on 31 December 2025 - testament to this commitment as it accords priority consideration to several product and services sectors of national importance including agriculture, food processing, construction, etc. Engineering goods especially machineries and parts have significant contribution in these sectors. Hence it is expected that the MAS scheme would also help uplift engineering exports.
ANNEXURE-I
ENGINEERING PRODUCT PANELS – COUNTRY-WISE ANALYSIS
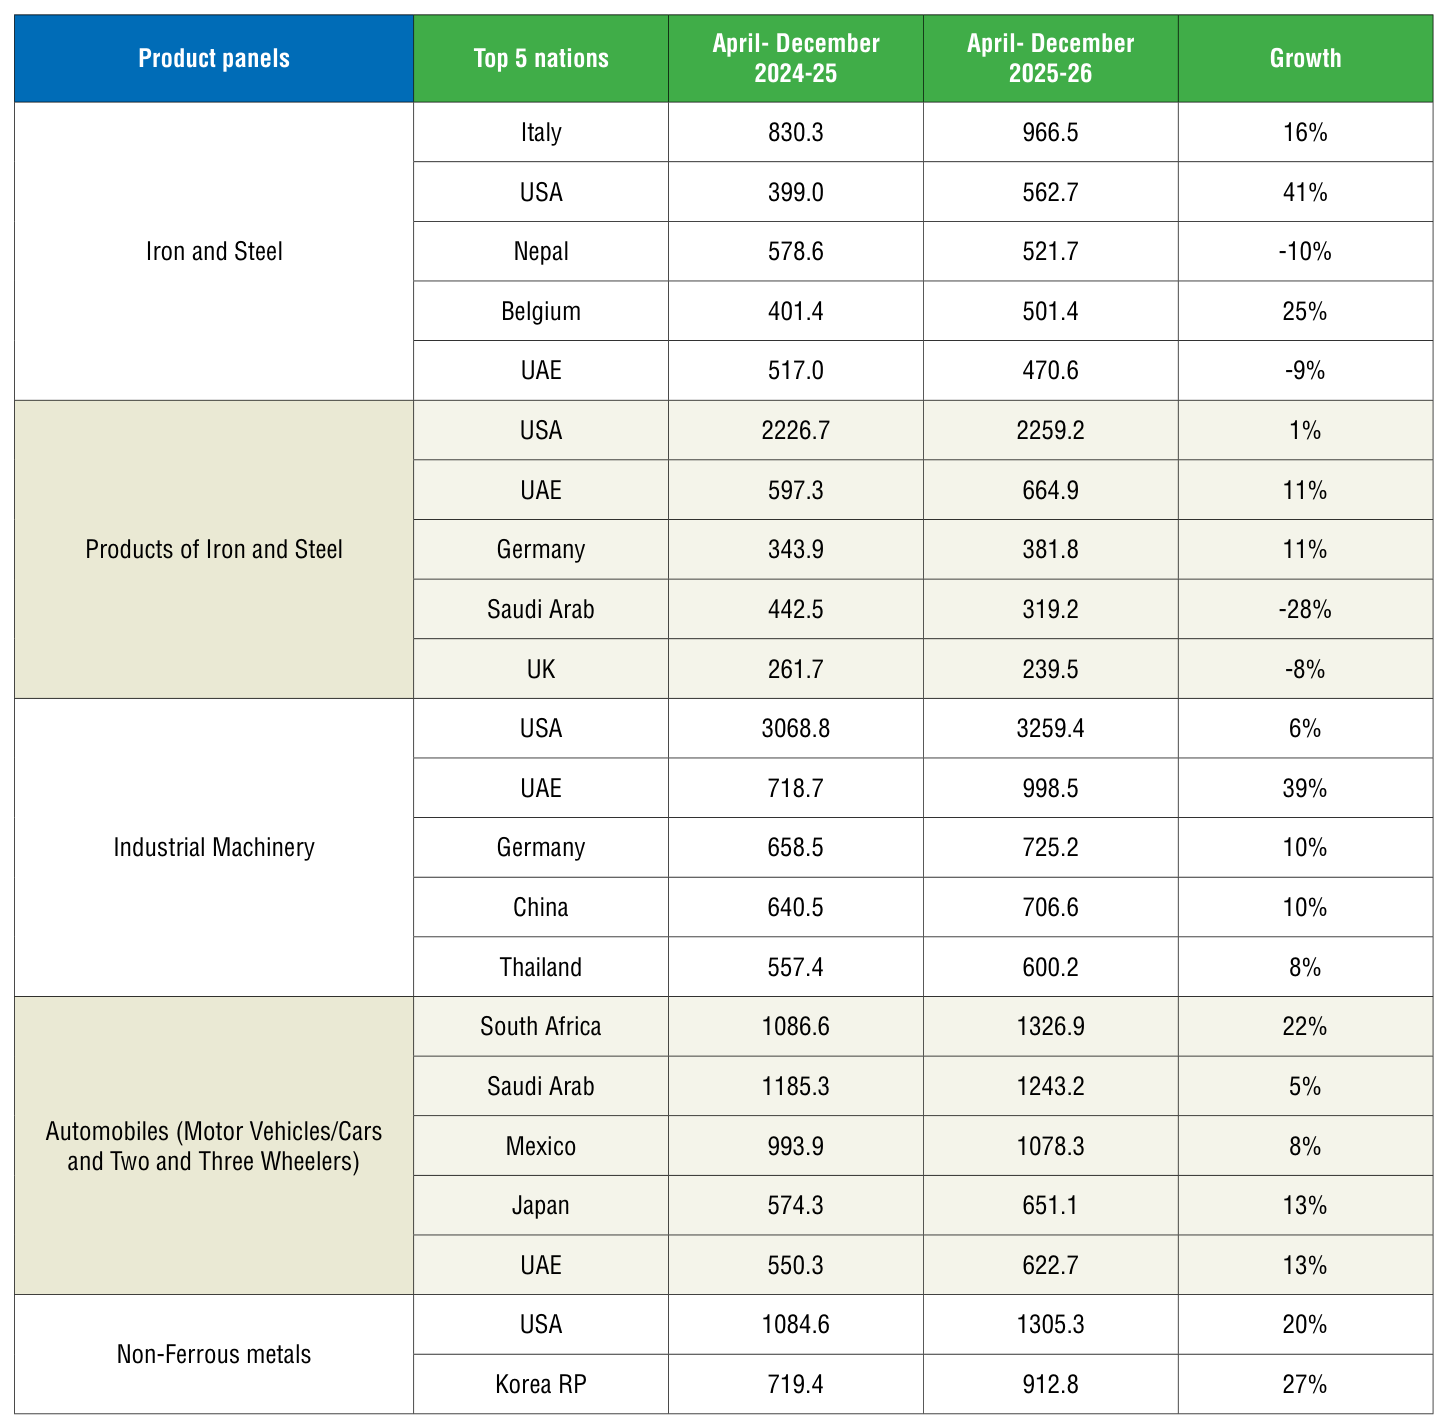
We now analyze the performance of some of the important products for the fiscal April-November 2025-26 vis-àvis April-November 2024-25. We have taken the major panels and computed the top importing countries to get an idea of the current trade pattern.
Engineering Product Panel - Country Matrix
Engineering Product Panel - Country matrix
Source: DGCI&S
- In April-December 2025, Italy, USA andNepal ranked as the top three importers of Indian Iron and Steel, while the USA, UAE and Germany lead in import of products of Iron & Steel.
- The USA stood out as the primary importer of Indian ‘Industrial machinery,’ making up 20% of India’s global exports in this category, followed by UAE and Germany with 6% ad 4% shares, respectively during April-December 2025.
- South Africa, Saudi Arabia, Mexico, Japan and UAE were top importers of India’s Automobiles during April-December 2025 in India’s global exports respectively over the same period previous fiscal.
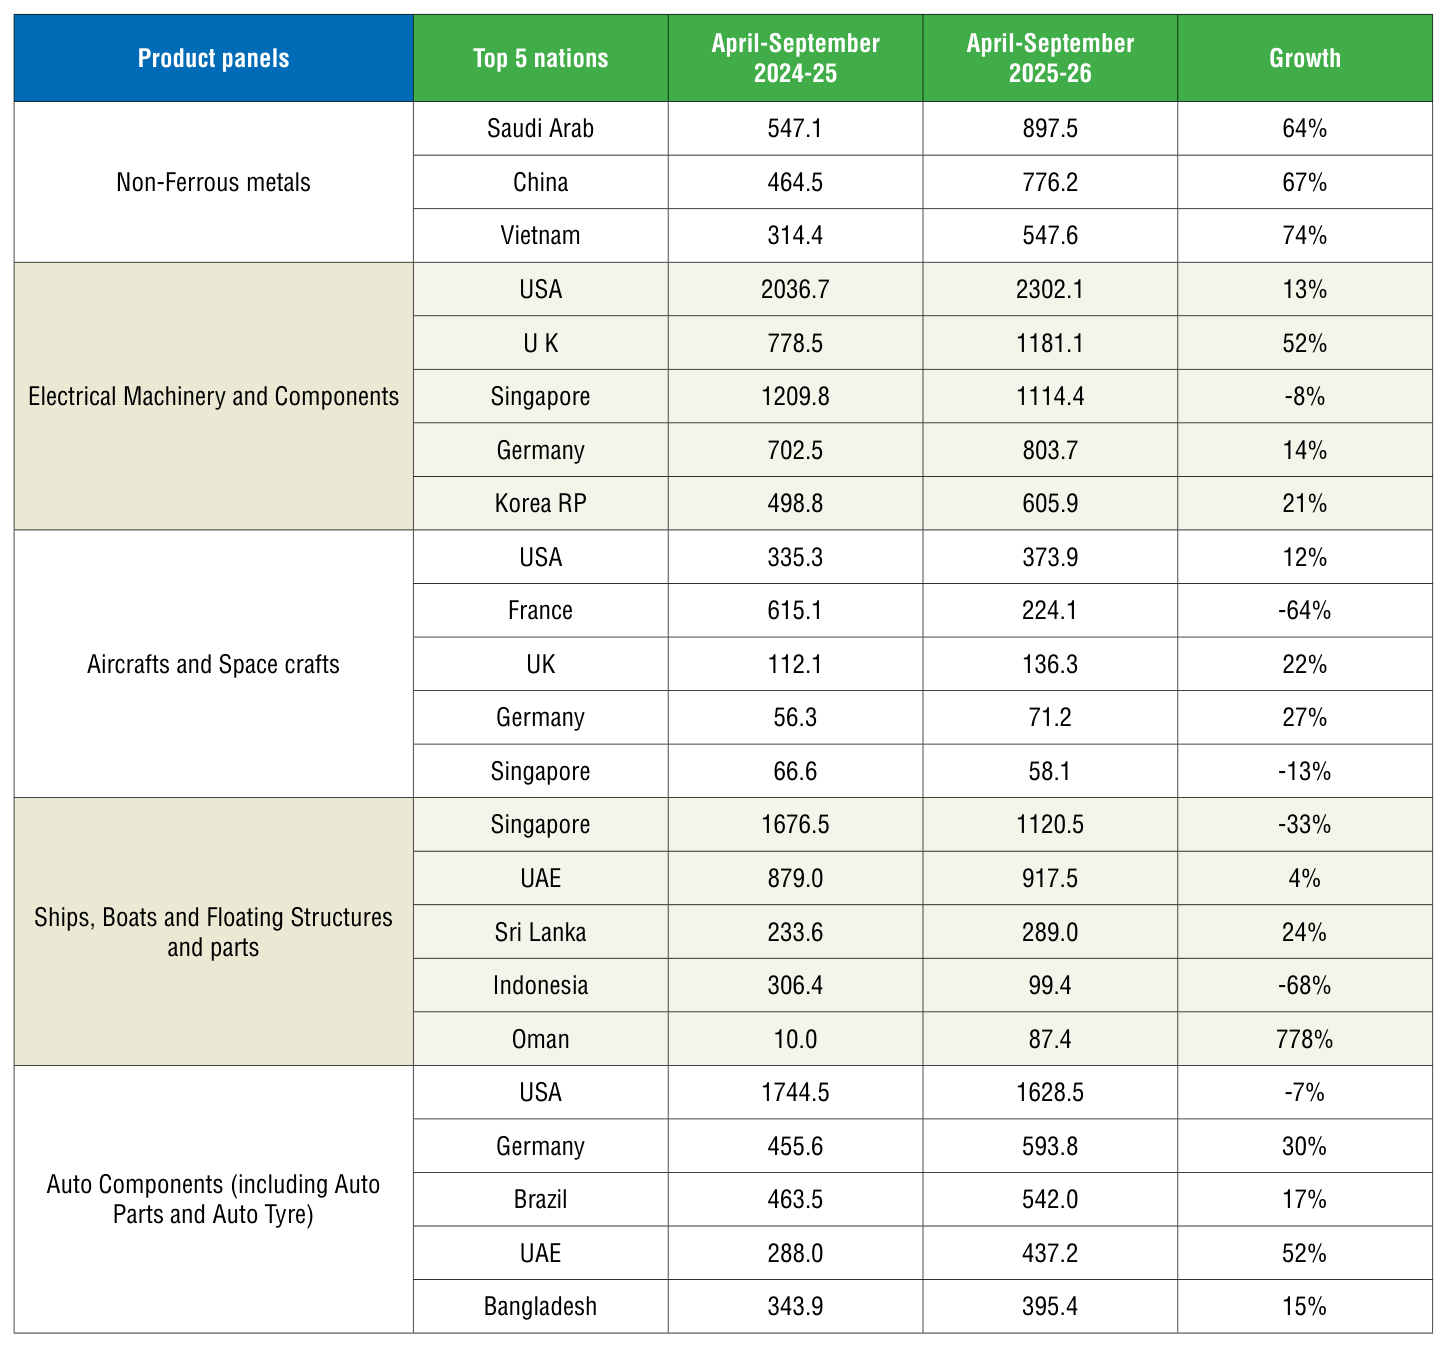
- USA, South Korea, Saudi Arab,China and Vietnam were the top importers of India’s Non-ferrous metals and products during April-December 2025.

- USA, UK, Singapore and Germany were the top importers of Indian Electrical Machinery & Components during the same period with 20%, 10%, 10% and 7% shares respectively.
- USA, France,UK, Germany and Singapore were the top importers of India’s Aircrafts and Spacecraft during April-December 2025, making up to 71% of India’s total export of Aircrafts and Spacecraft.
- Singapore, UAE and Sri Lanka became the largest importer of ships, boats and floating structures followed by Indonesia and Oman during April-December 2025.
- For the auto components’ product group, USA remained the top importer in April-December 2025 followed by Germany, Brazil, UAE and Bangladesh, making up to 41% of India’s total export under this category.
© Copyright , All rights reserved. Design by Andreal