


VOL. 18, ISSUE NO. 10 | January 2026
Oversight


Highlights
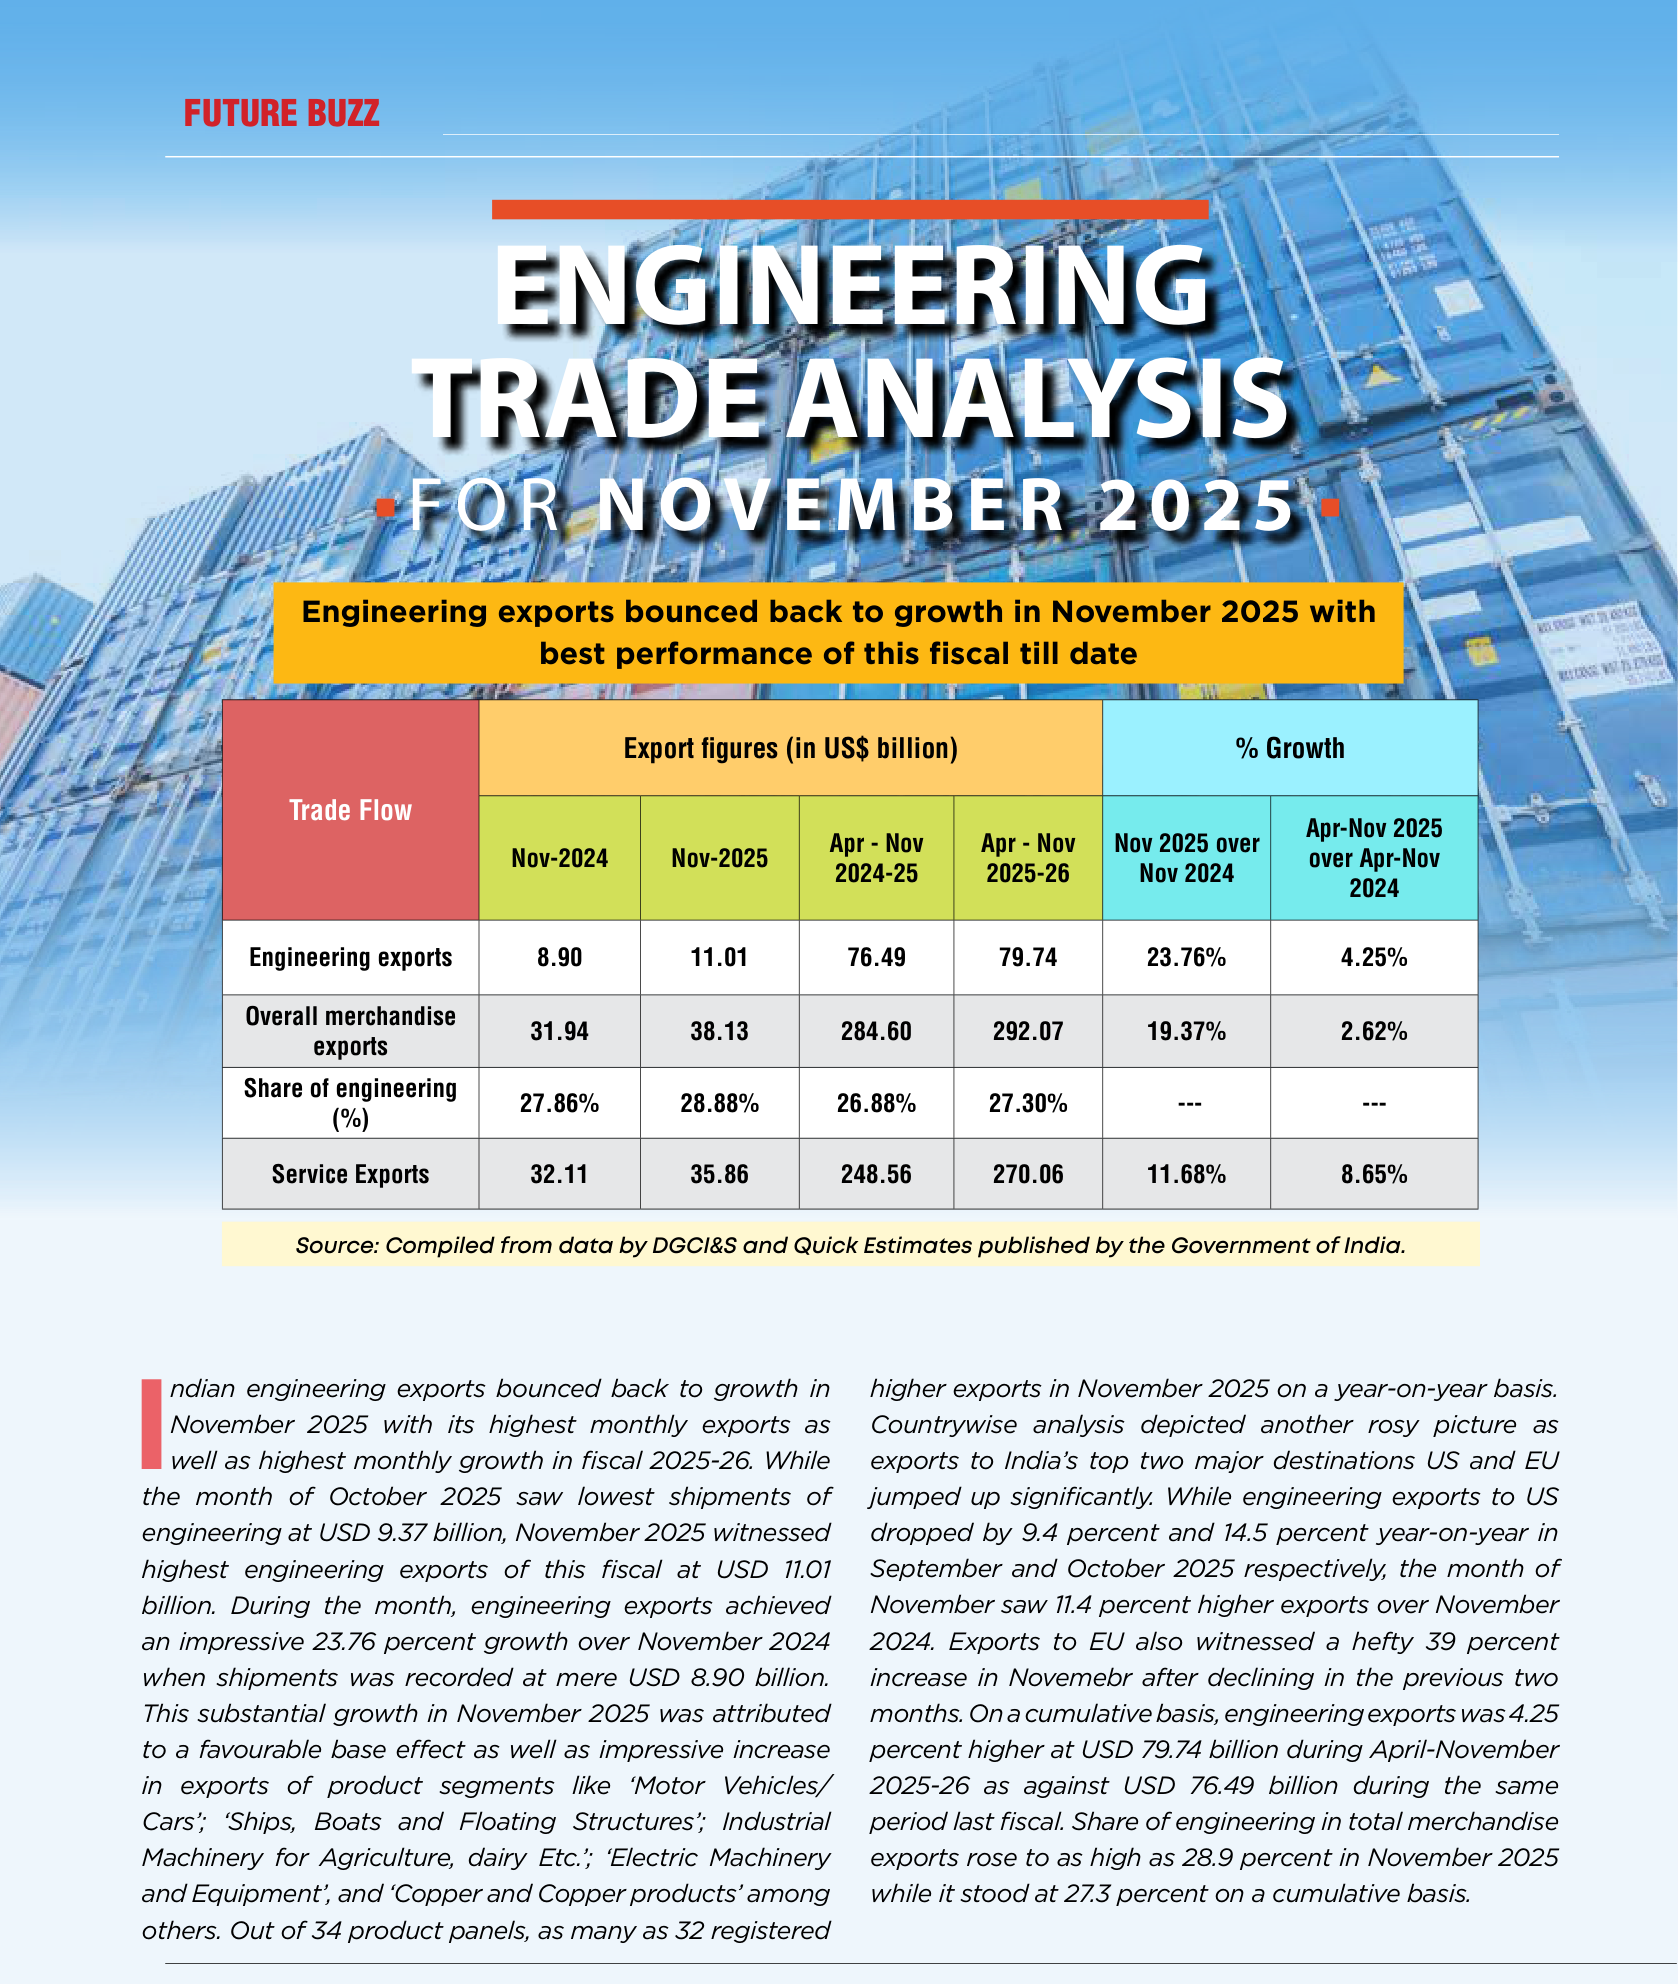
- Indian engineering exports bounced back to growth in No‑ vember 2025 with its highest monthly exports as well as high‑ est monthly growth in fiscal 2025‑26.
- While the month of October 2025 saw lowest shipments of engineering at USD 9.37 billion, November 2025 witnessed high‑ est engineering exports of this fiscal at USD 11.01 billion. During the month, engineering exports achieved an impressive 23.76 per‑ cent growth over November 2024 when shipments was recorded at mere USD 8.90 billion.
- This substantial growth in No‑ vember 2025 was attributed to a favourable base effect, high ex‑ port growth of selected product segments, and sizeable increase in shipments to US and EU, India’s two topmose destinations for en‑ gineering exports.
- On a cumulative basis, engineer‑ ing exports from India was 4.25 percent higher at USD 79.74 bil‑ lion during April‑November 2025‑ 26 as against USD 76.49 billion during the same period last fiscal.
- As per the quick estimates of the government, the share of engi‑ neering in total merchandise ex‑ ports was recorded at as high as 28.9 percent in November 2025 as against 27.27 percent in Octo‑ ber 2025. The share was recorded at 27.30 percent on a cumulative basis during April – November 2025‑26.
- In November 2025, 32 out of 34 engineering panels witnessed positive year‑on‑year growth. While only 2 engineering panels i,e aircraft, spacecraft and parts and prime mica and products wit‑ nessed decline in exports during November 2025 vis‑à‑vis Novem‑ ber 2024.
- On a cumulative basis, 30 out of 34 engineering panels recorded growth and remaining 4 engi‑ neering panels including Alumin‑ ium and products, Aircraft and Spacecrafts and Ships, boats and floating products and project goods recorded negative growth during April‑November 2025‑26.
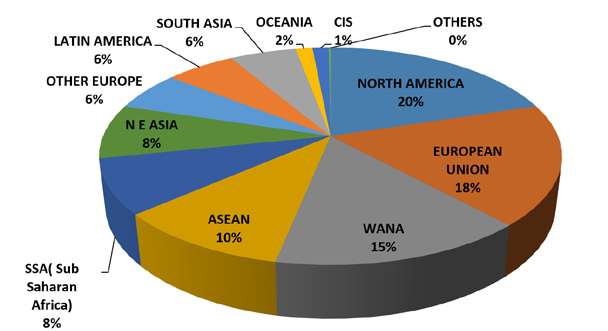
- Region wise, North America and EU remained the top two ex‑ porting regions for Indian engi‑ neering. Also, export growth was recorded in all regions in Novem‑ ber 2025. In cumulative terms increase was noted in all regions barring WANA, ASEAN, Other Europe and CIS.
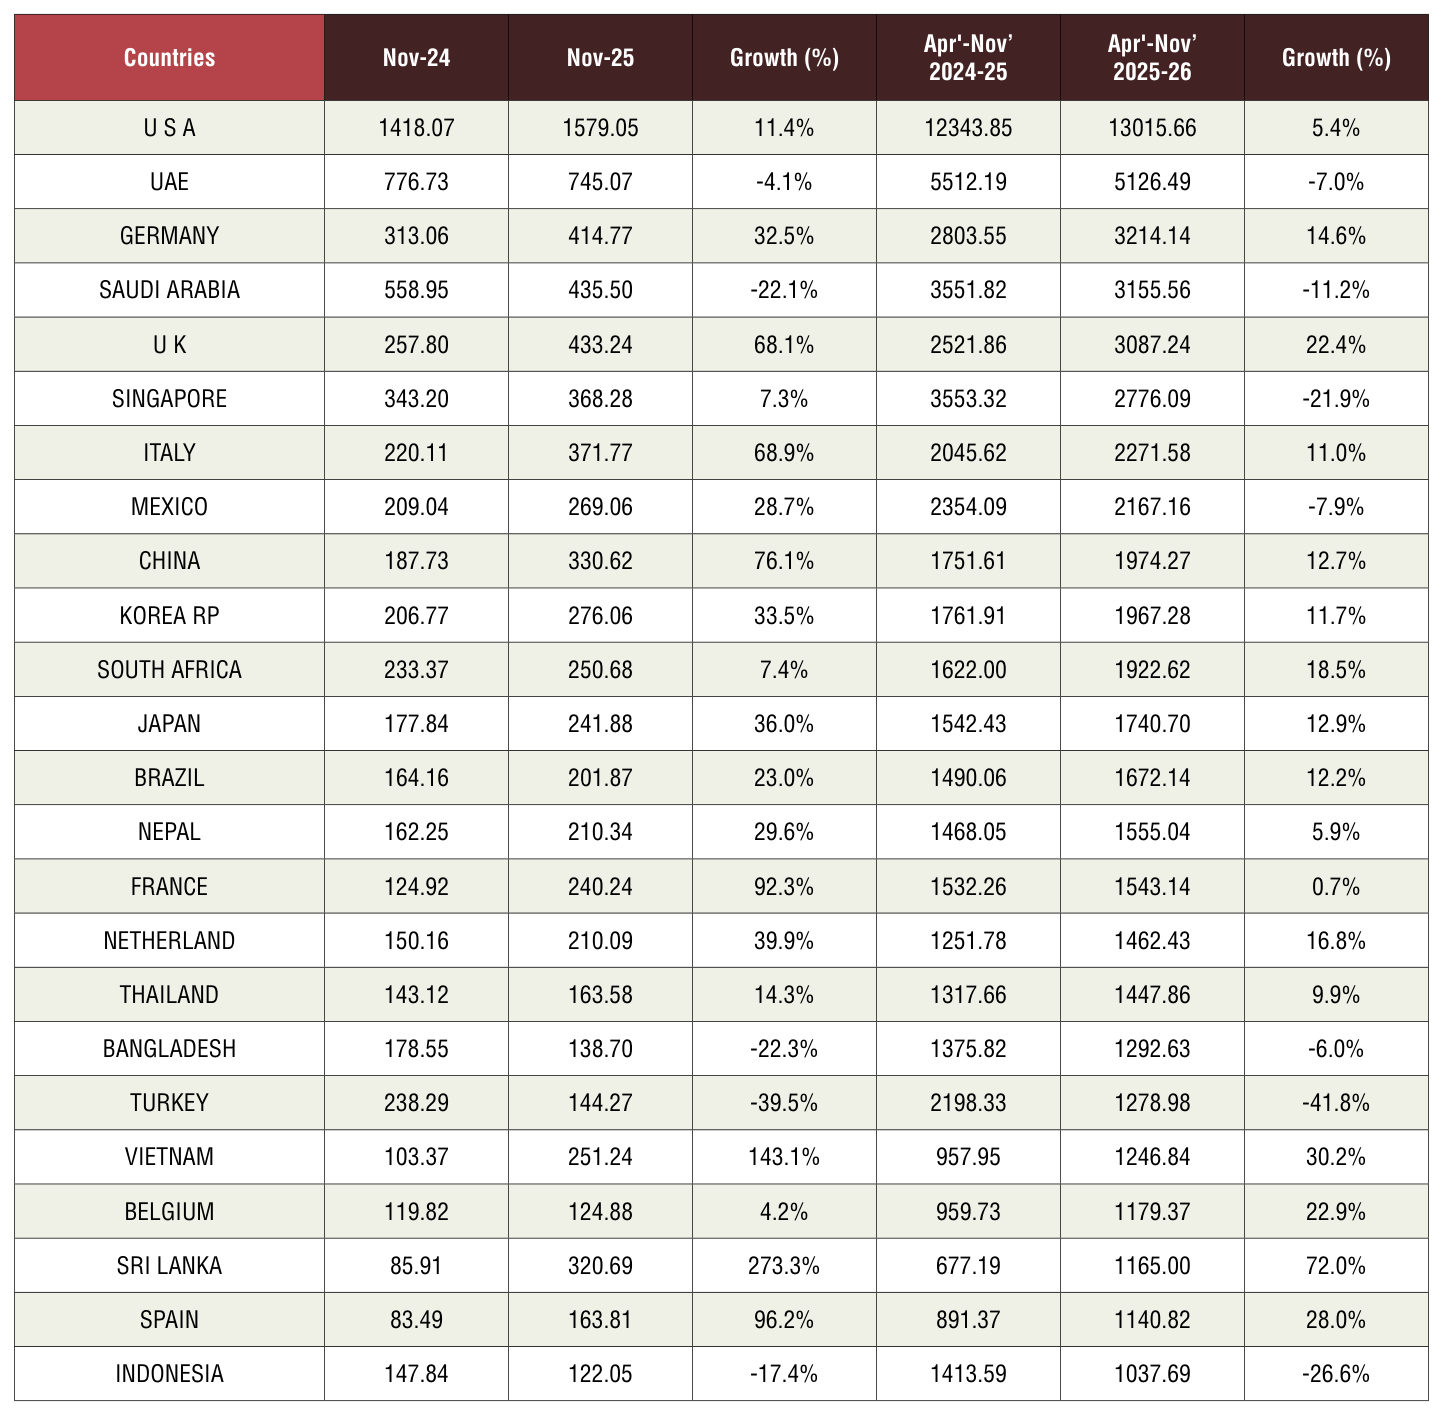
- Country‑wise, USA remained the top destination followed by UAE and Germany but exports to UAE declined year‑on‑year in Novem‑ ber 2025. Decline was also noted in Saudi Arabia. On a cumulative basis too, decline was noted in UAE and Saudi Arabia.
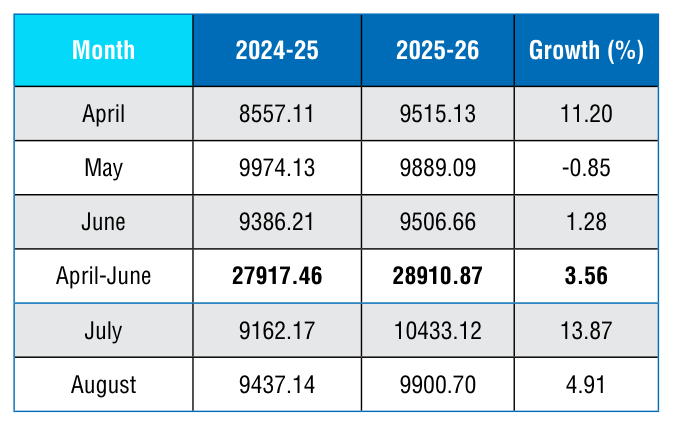
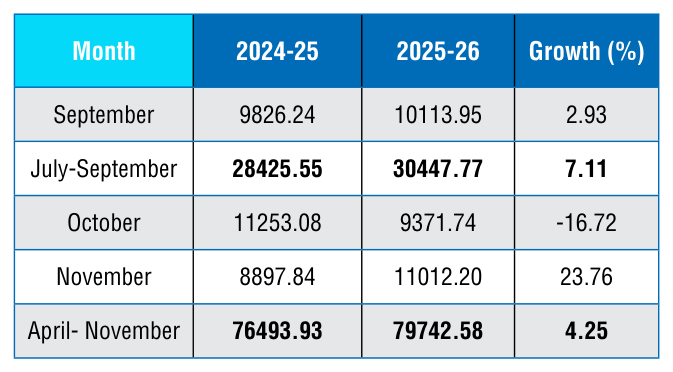
Engineering Exports: Monthly Trend
The monthly engineering export figures for 2025‑26 vis‑à‑vis 2024‑25 are shown below as per the latest DGCI&S estimates:
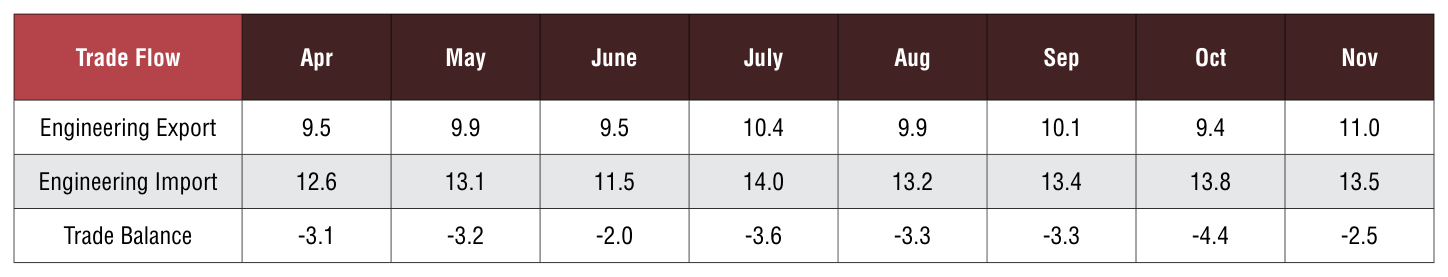
Table 1: Engineering Exports: Monthly Trend in 2025-26 (Values in USD Million)
Source:DGCI&S,Govt.ofIndia
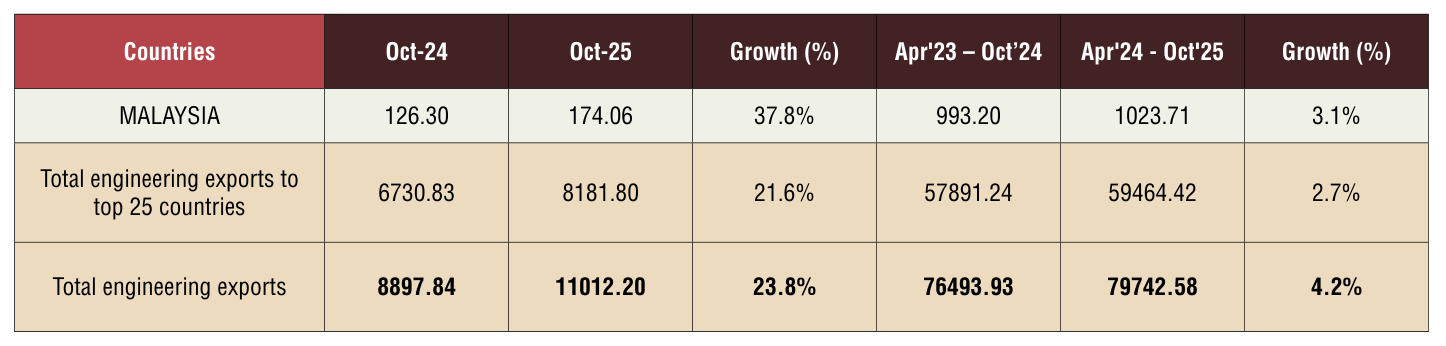
TOP 25 ENGINEERING EXPORT DESTINATIONS IN NOVEMBER 2025
We now look at the export scenario of the top 25 nations that had highest demand for Indian engineering products during November 2025 over November 2024 as well as in cumulative terms during April‑November 2025‑26 vis‑à‑vis April‑November 2024‑25. The data clearly shows that top 25 countries contribute almost 75% of total engineering exports.
Table 2: Engineering exports country-wise
Source:DGCI&S
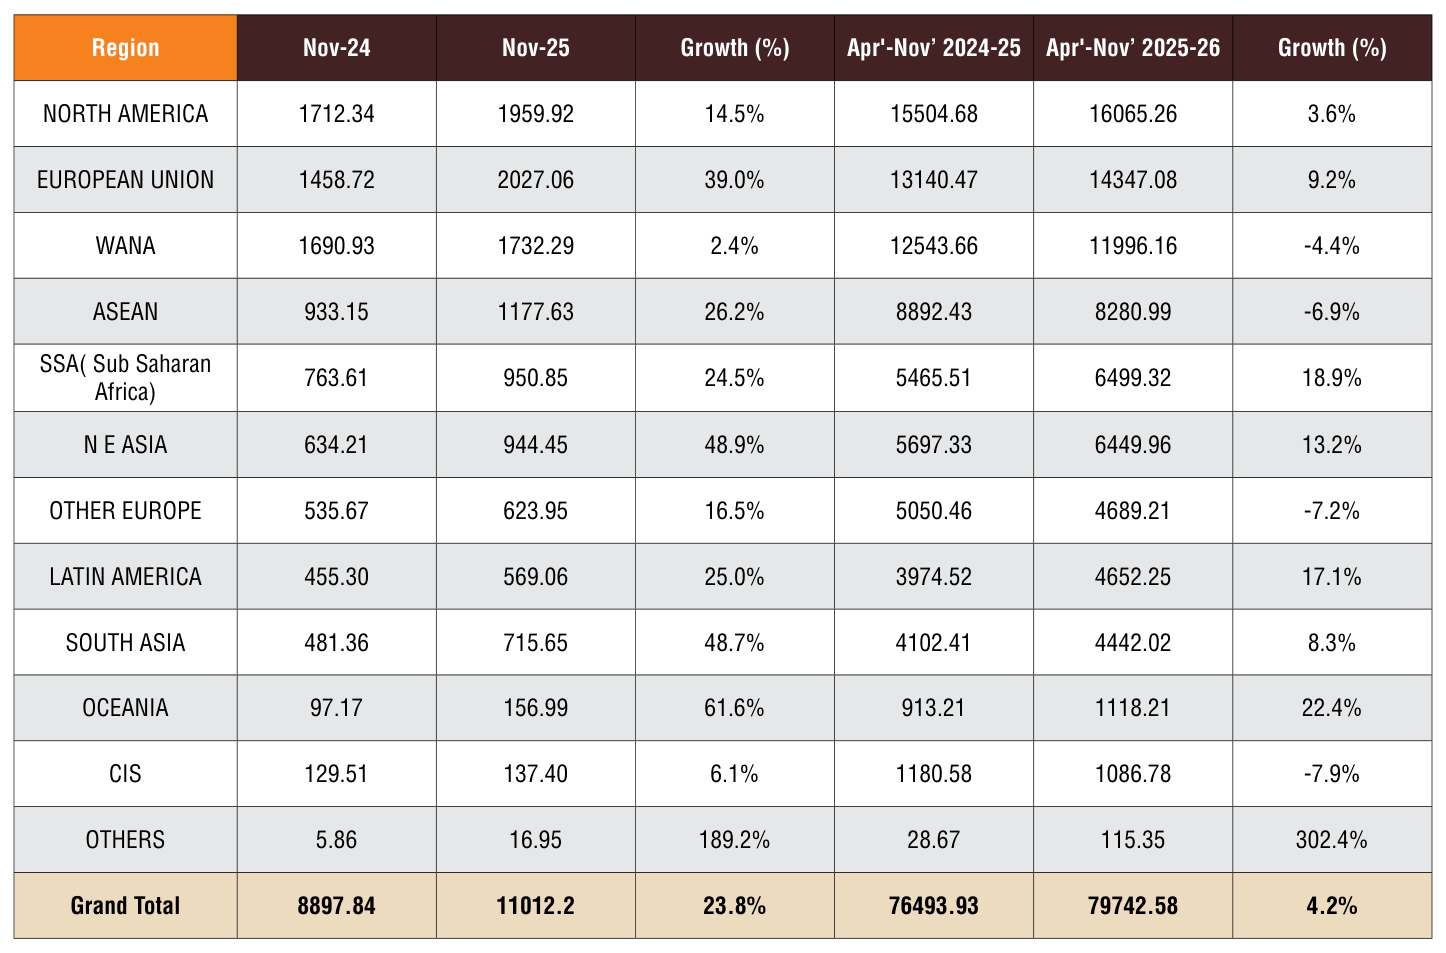
REGION WISE INDIA’S ENGINEERING EXPORTS
The following table depicts region wise India’s engineering exports for April‑November 2025 as compared to April‑November 2024
Table 3: Region wise engineering exports in April-November 2025-26 vis-à-vis April-November 2024-25
Source:DGCI&S
Note: Myanmar has been included in ASEAN and not in South Asia, since ASEAN is a formal economic grouping.
- WANA: The decline in exports is on a cumulative basis, i,e April‑November 2025. The de‑ cline in exports to WANA is mainly due to significant drop in exports to UAE (7% decline on a cumulative basis and 4.1% decline in monthly basis) and Saudi Ara‑ bia (11.2% decline on a cumulative basis and 22% decline in month‑ ly basis). Panel‑wise the major decline is witnessed in aircraft, spacecraft and parts – exports to UAE and Saudi Arabia declined by more than 98% in April‑No‑ vember 2025 compared to the last year. The decline in exports can be attributed to volatility in MRO activities. The industry also feels that since the imposition of the US tariffs and increased com‑ pliance regrading origin of goods, it has become difficult for Indian exporters to use UAE as a base for export to US with tax benefits. This has also impacted our ex‑ ports to UAE. The industry hopes that the recent FTA with Oman will be instrumental in increasing India’s exports to the region
- ASEAN: Again the decline in ex‑ ports is on a cumulative basis while in November 2025, exports to ASEAN actually recorded a growth of 26.2% which is sig‑ nificantly positive for us. In November 2025, exports to almost all ASEAN countries including Singapore, Vietnam and Malay‑ sia recorded significant growth.Singinificant decline was noted in Indonesia in areas such as motor vehicles/ cars, iron and steel and copper.
- Other Europe: Mainly declined due to decline in exports to Tur‑ key – geopolitical conflicts and diplomatic issues have impacted India’s prospects. In November 2025, India’s exports to Turkey declined by around 40% while in cumulative terms it declined by more than 40%
Figure 1: Region-wise shares of India’s engineering exports during April-November 2025-26
Source:DGCI&S

PANEL WISE INDIA’S ENGINEERING EXPORTS
In this section we look at the Engineering Panel wise exports for the month of September 2025 vis‑à‑vis September 2024 as well as the cumulative exports for April-November 2025-26 vis-à-vis April-November 2024-25. These are indicated in the tables below.
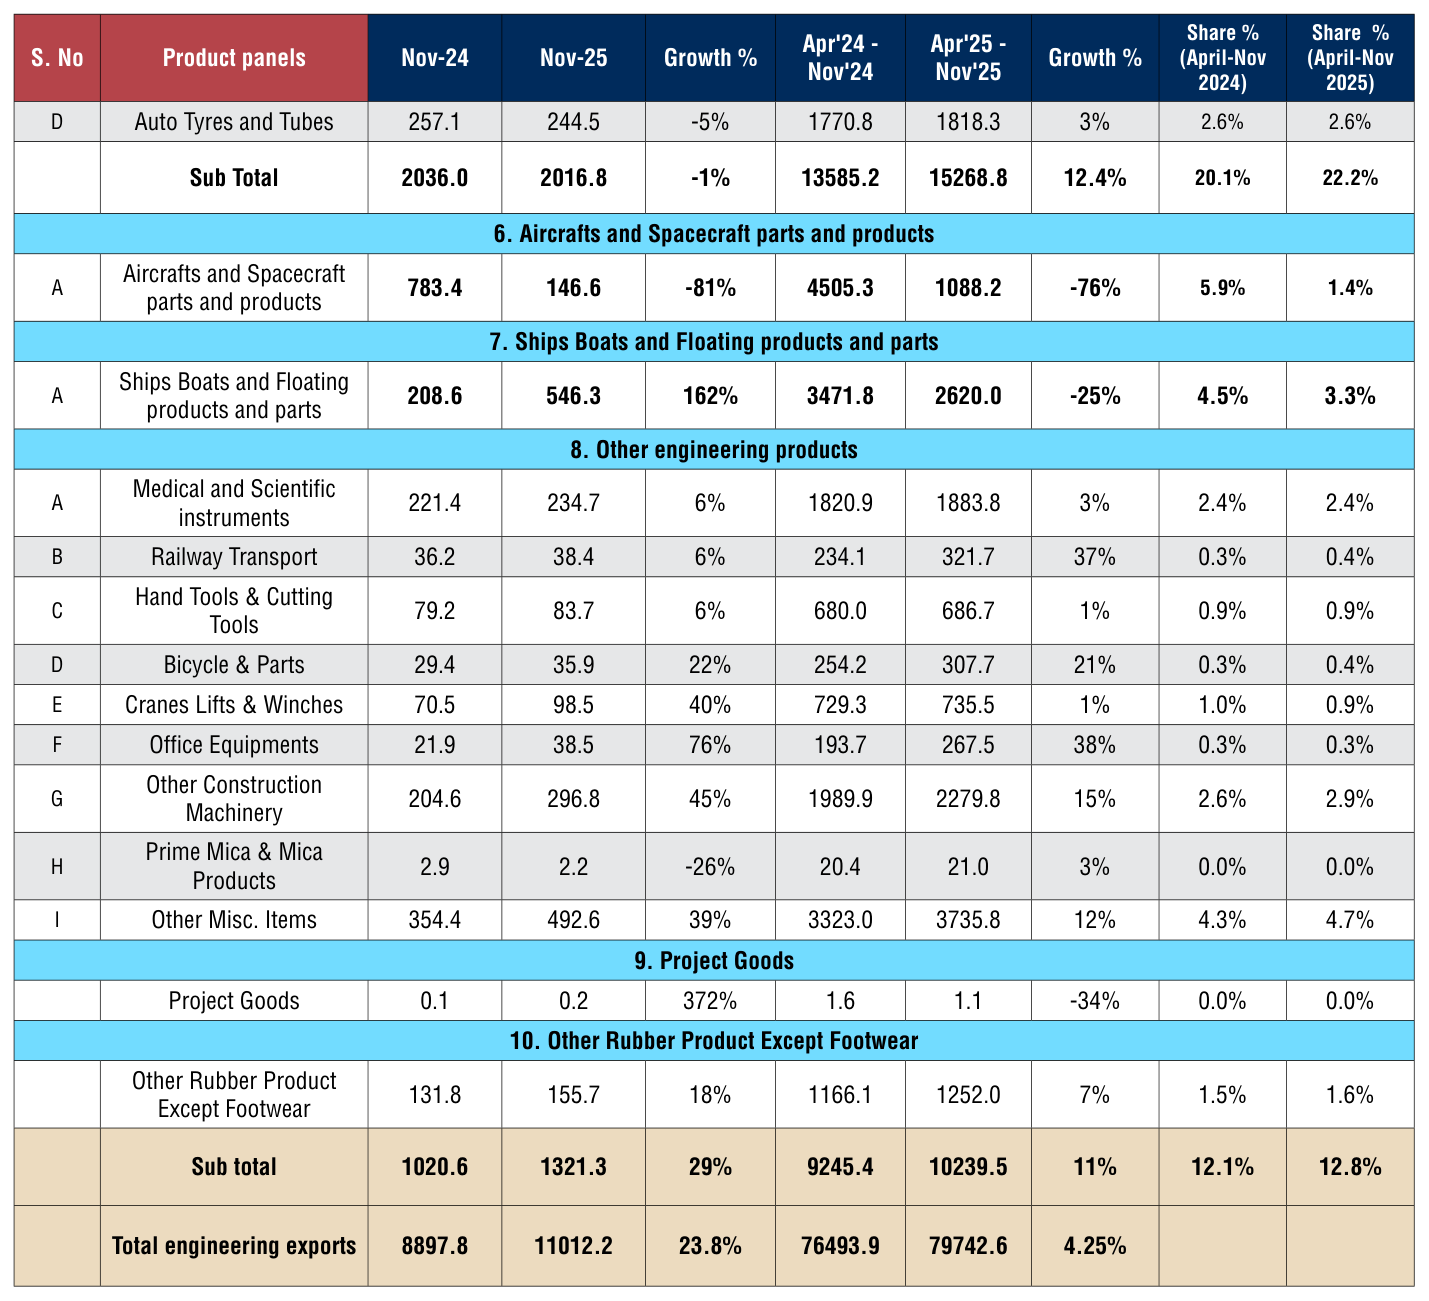
Table 4: Panel-wise Export Analysis for April-November 2025-26 vis-à-vis April-November 2024-25 (Value in US$ million)
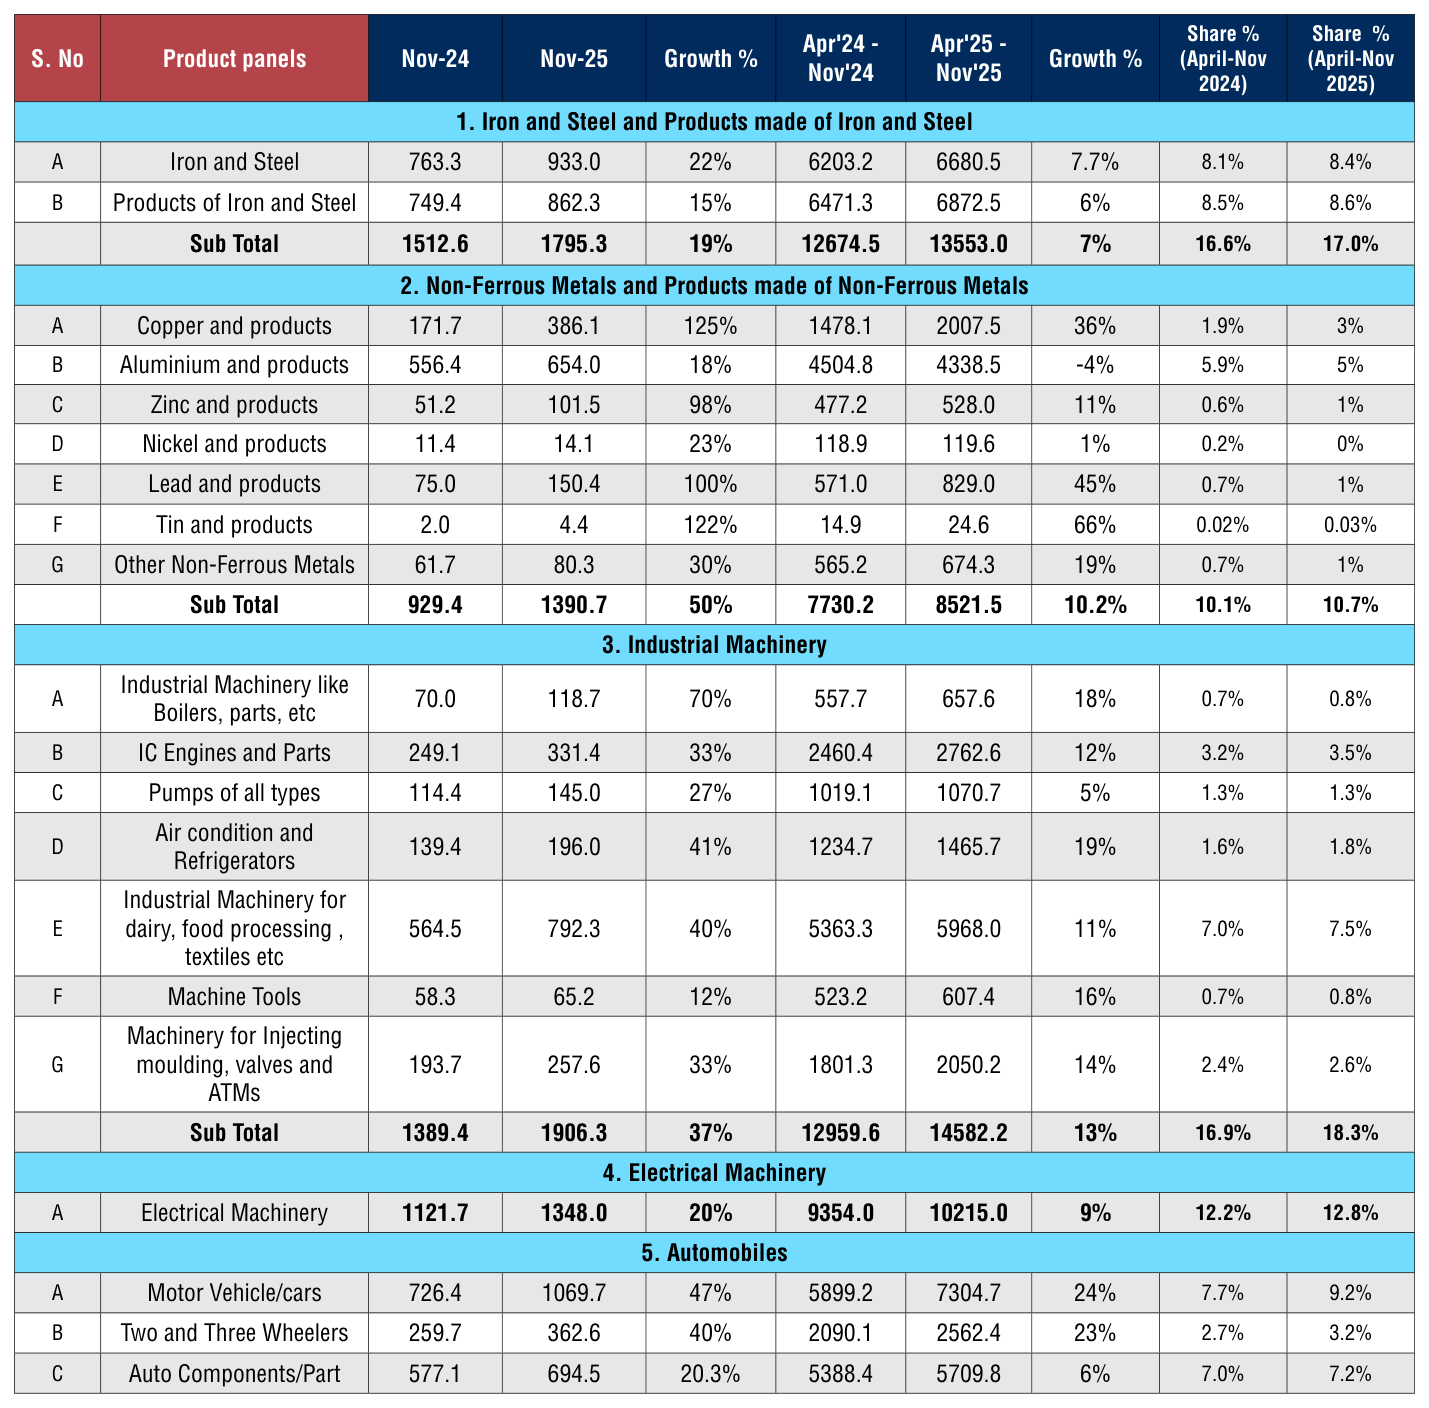
Sectoral Observations:
India’s engineering exports grew by about 4.25% in April–November 2025‑26 to around US$79.5 billion, with mixed performance across panels:
- Iron and steel (including prod‑ ucts) grew about 7%, and their share in total exports inched up from 16.6% to 17.%, indicating moderately stronger demand for metal‑based engineering goods. November alone saw a strong 19% YoY increase, supported by higher shipments of both raw steel.
- Non ferrous metals rose roughly by 10.2%, reaching US$8.52 bil‑ lion during April‑Nov 2025‑26. The share improved from 10.1% to 10.7%, driven by exceptional per formance in copper (+36%) and lead (+45%), while zinc and tin also posted healthy gains. How‑ ever, aluminium exports declined by 4%, pulling down overall mo‑ mentum.
- Industrial machinery maintained robust growth of 13%. Its share increased from 16.9% to 18.3%, supported by strong demand for machinery used in food process ing, textiles, and dairy, as well as IC engines, injection mould‑ ing equipment, and refrigera‑ tion units. November witnessed a sharp 37% YoY surge. While exports of electrical machinery grew by 9%, reaching US$10.22 billion from US$9.35 billion, with its share moving up to 12.8%.
- Automobile exports posted a sig‑ nificant rise of 14.8%, climbing to US$17.67 billion from US$15.39 billion, with the share increasing from 20.1% to 22.2%. Motor vehi‑ cles and two/three wheelers led the growth, supported by strong demand in overseas markets, while auto components and tyres registered moderate gains.
- Aircraft, spacecraft, and Ship and Boats exports contracted sharply (around 76% and 25% respectively), pulling down their contribu‑ tion to total engineering exports.
- Other engineering products in‑ cluding railway equipment, office machinery, bicycles, and con‑ struction machinery) grew about 11%, while medical instruments and hand tools showed marginal gains, nudging their share up to 12.8%.
ENGINEERING EXPORTS – STATE-WISE ANALYSIS
State wise engineering export performance- Data as on 2025-26
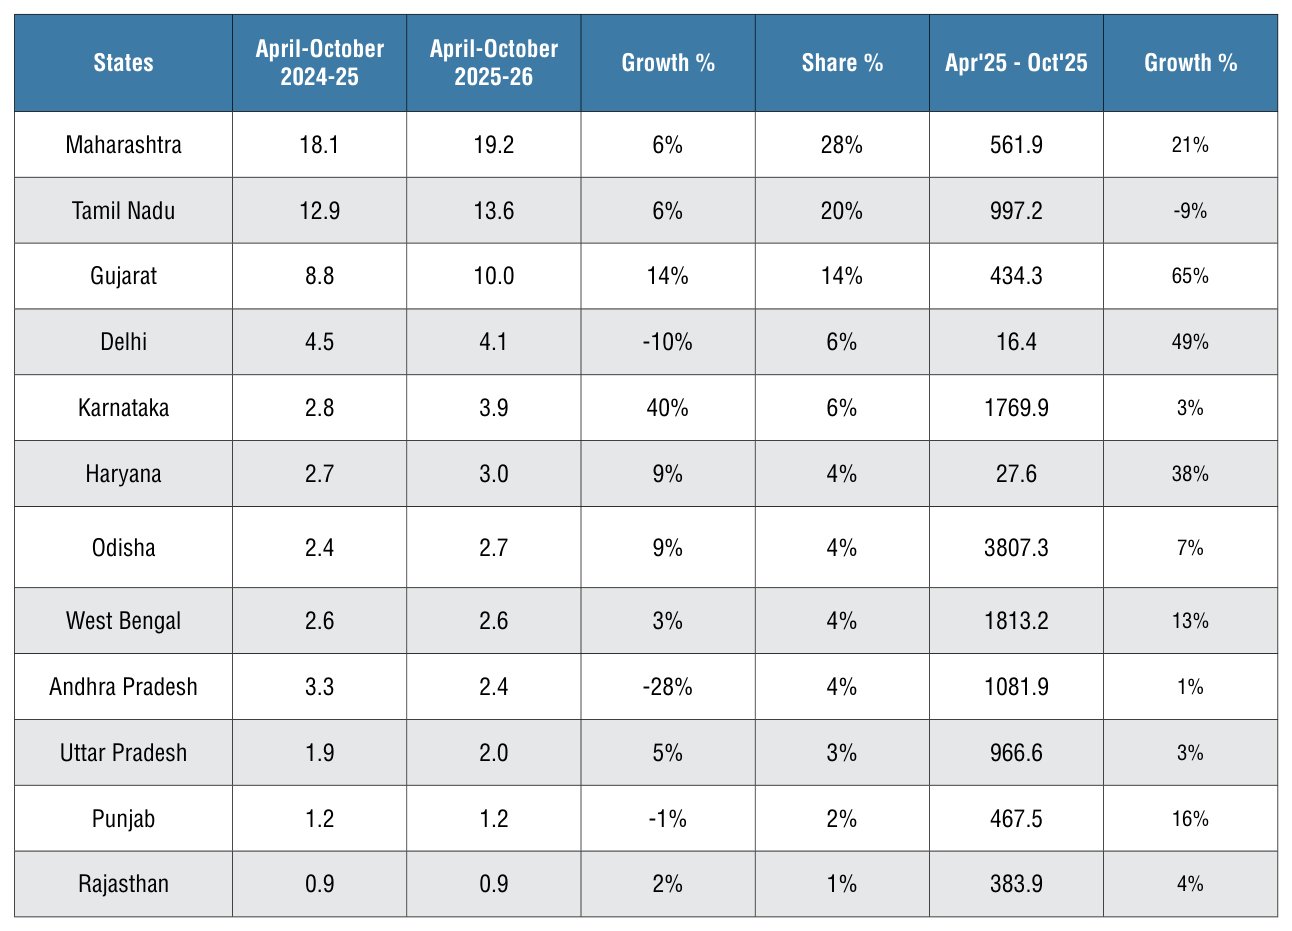
The table below indicates the exports from top Indian states. It is evident from the table that almost 95% of India’s exports is contributed by the listed 12 states. Within this almost more than 55 percent of exports is done by Maha‑ rashtra, Tamil Nadu and Gujarat together during April‑October 2025‑26.
Table 5: Top state wise engineering export performance – April-September 2024-25
Source: DGCIS Portal
Maharashtra leads with 19.2 billion USD in engineering exports (April‑ Oct 2025‑26), up 6% from 18.12 billion USD, securing a 28% national share through its robust ecosystem in engineering goods. West Bengal recorded marginal 3% growth reaching US$ 2.6 billion, holding a 4% share. Odisha achieved 9% growth to 2.7billion USD (4% share) during April‑October 2025‑26.Karnataka achieved the highest growth of 40% during April-October 2025‑26 reaching US$ 3.9 billion holding a share of 6%.This concentration underscores the industrial hubs’ pivotal role in sustaining India’s engineering export momentum amid global demand.
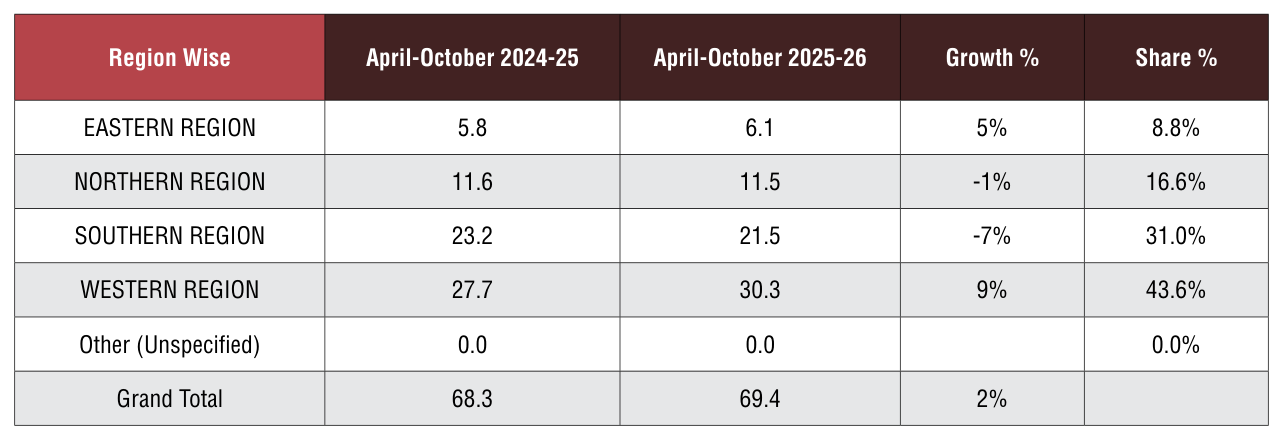
Table 6: India’s Region Wise Engineering Exports - Value in US$ billion
Source: DGCIS Portal
India’s engineering exports reached US$69.4 billion during April– October 2025–26, registering a modest 2% growth over US$68.3 billion in the same period last year.The Western Region dominated with a 43.6% share (US$30.3 billion), driven by strong performance from Maharashtra and Gujarat’s manufacturing hubs.The Southern Region contributed US$21.5 billion, accounting for 31% of total exports, supported by robust shipments of automobiles, machinery, and electrical equipment from Tamil Nadu and Karnataka. The Northern Region maintained a steady share at 16.6% (US$11.5 billion), led by industrial machinery and auto components from states like Haryana and Punjab. The Eastern Region, though smaller in scale, posted US$6.1 billion exports, up 5.8%, reflecting growing demand for steel and non‑ferrous metals from Odisha and West Bengal.
CORRELATION BETWEEN MANUFACTURING OUTPUT AND ENGINEERING EXPORTS
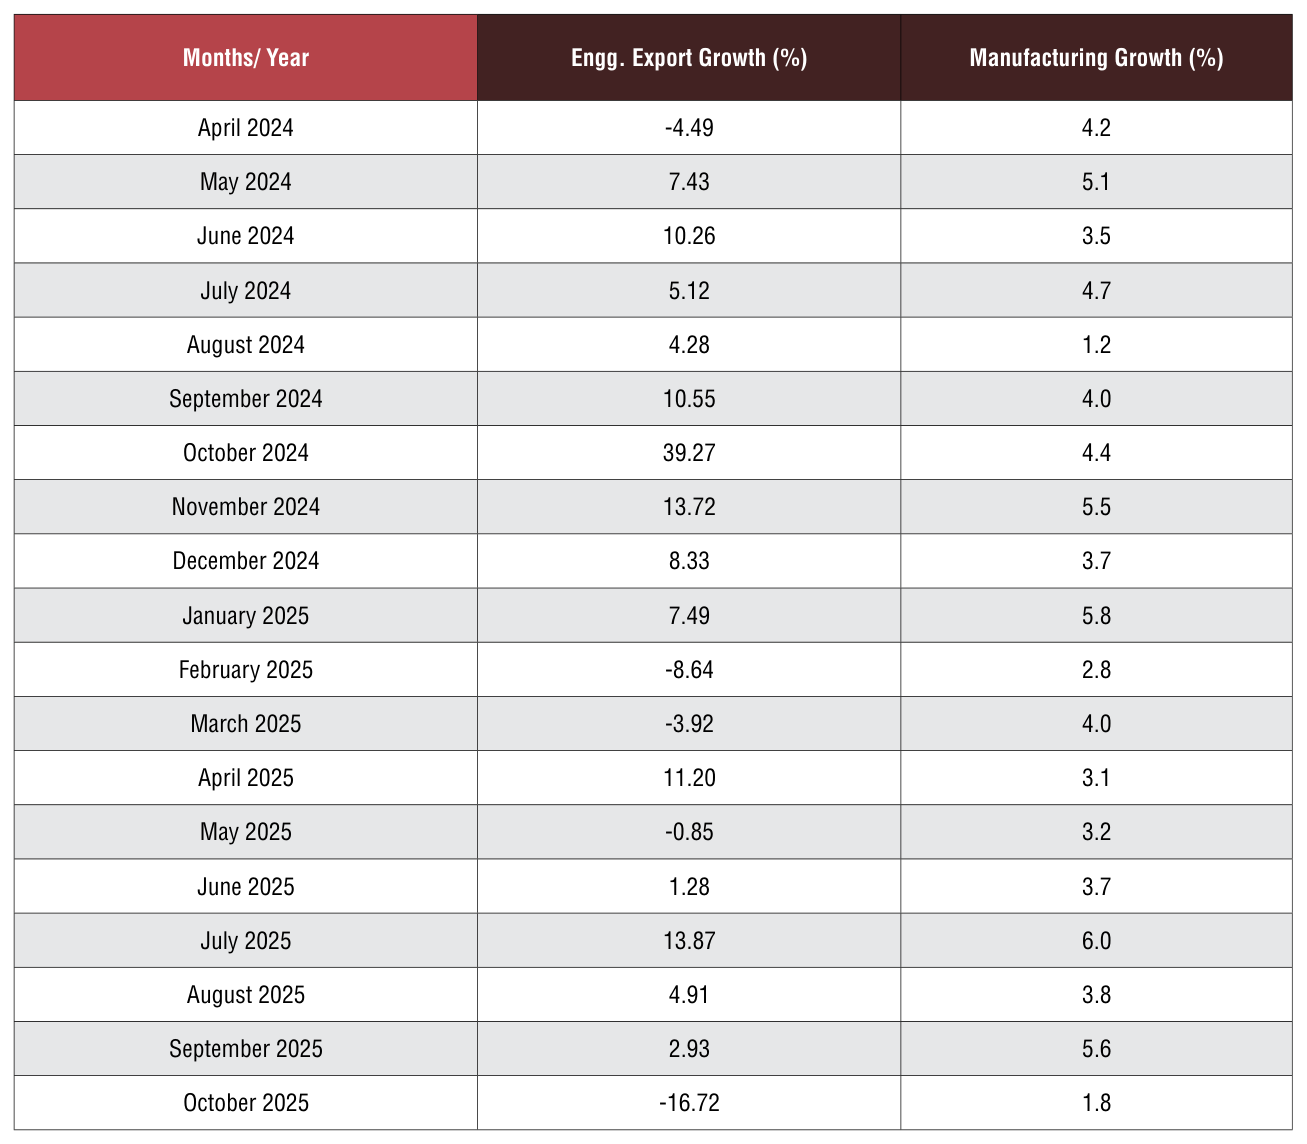
Engineering forms a considerable part of the broader manufacturing sector and the share of engineering production in overall manufacturing output is quite significant. As exports generally come from what is produced within a country, some correlation between manufacturing production growth and engineering export growth should exist.We briefly look at the trend in manufacturing growth as also engineering export growth to see if they move in tandem. It may be mentioned that manufacturing has 77.63% weightage in India’s industrial production.
Engineering export growth and manufacturing output growth moved in the same direction in as many as nine out of twelve months in each of the fiscal years 2019-20 and 2020-21. During fiscal 2021-22, engineering export growth and manufacturing growth moved in the same direction in seven out of twelve monthswhile in each of fiscal 2022-23 and 2023-24, as many as10 out of 12 months saw engineering exports and manufacturing output moved in the same direction. In 2024-25, both moved in the same direction in eight out of 12 months.
The first two month of fiscal 2025‑26 saw engineering export growth and manufacturing output growth moved in the opposite direction.In April, engineering export growth surged to double digit andmanufacturing growth decelerated, while in May engineering export declined and manufacturing output growth inched up over the month. Then, In June, July and August 2025 however, both moved on the same direction.In June and July, both witnessed improvement in growth while in Aug 2025, both conceded moderation in growth. In September 2025 however, engineering growth continued to slowdown but manufacturing growth accelerated.
October 2025 saw both going down with decline in engineering exports.
The link between these two may not be established in one or two months, but a positive correlation may be seen if medium to long term trend is considered.
Table 7: Engineering exports growth vis-à-vis manufacturing growth from April 2024
Source: Department of Commerce and CSO
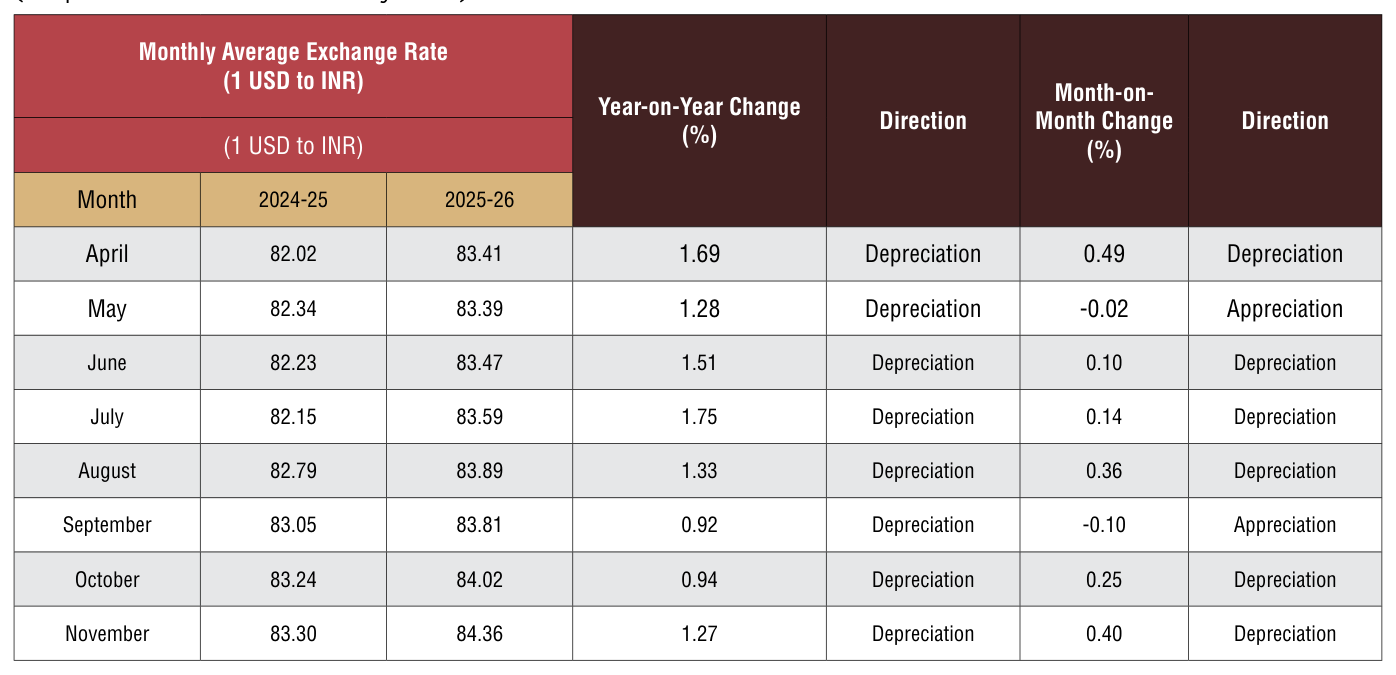
Table 8: USD-INR monthly average exchange rate in 2025-26 vis-à-vis 2024-25

Depreciation of Indian Rupee continued vis-à-vis the US Dollar for the sixth straight month to November 2025 both on a monthly as well as yearly basis: INR depreciated vis‑ à‑vis the US Dollar by 0.46 percent in November 2025 over the previous month but again the year‑on‑year depreciation was much higher 5.30 percent. Rupee once again saw its lifetime low during the month with apprehension of weakening further.
Table 9: USD-INR monthly average exchange rate in 2024-25 vis-à-vis 2023-24 (As per latest data released by FBIL)
Capital outflow from Indian markets due to uncertainty over US pressure on India in the form of higher tariff and warning on oil purchase from Russia continue to weigh on rupee.Delay in negotiation of India‑US BTA is also pointed out by market expert as another reason for nervous rupee.
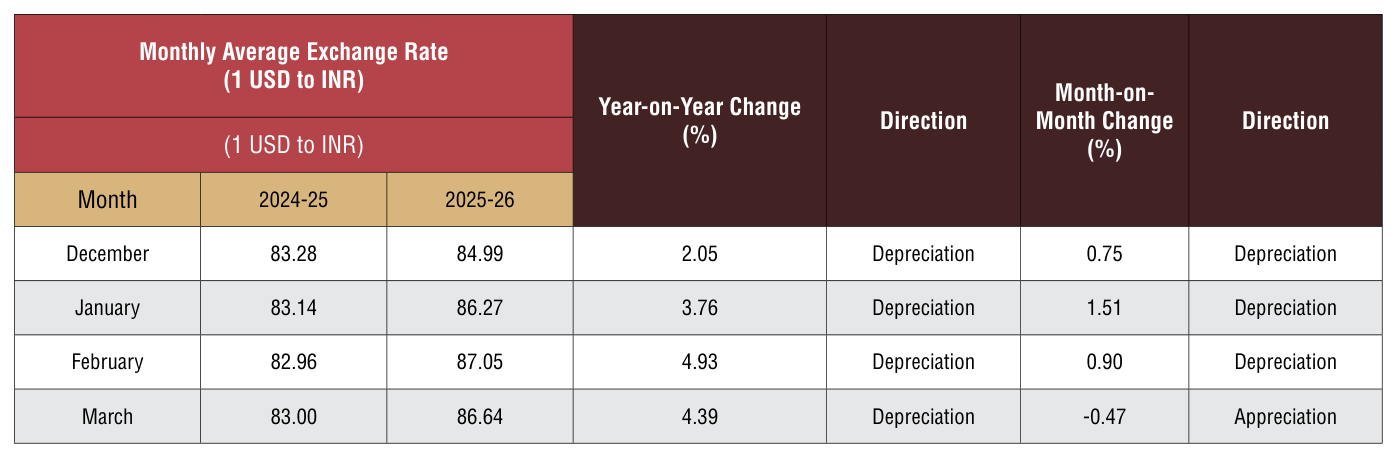
Fig 2: Trend of Rupee vis-a-vis US dollar from April 2021 (Monthly Average Rate of FBIL has been considered)
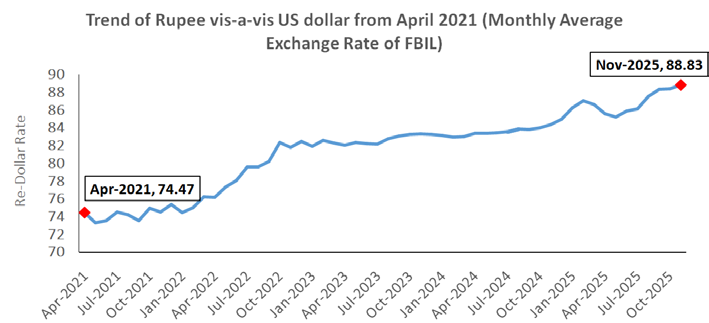
Source: FBIL
ANALYSIS OF INDIA’S ENGINEERING IMPORTS
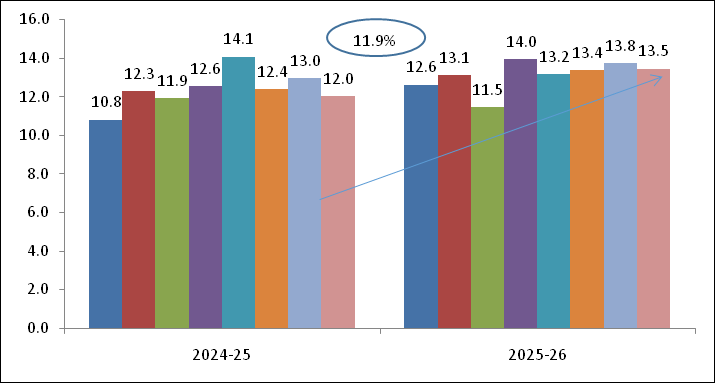
- India’s Engineering imports during November 2025 were valued at US$ 13.5 billion compared to US$ 12.0 billion in November 2024 registering a positive growth of 11.9 percent in dollar terms. In cumulative terms (Apr‑Nov 2025), India’s imports increased by 7.9 percent.
- In November 2025, imports increased sharply for Ship, Boat And Floating Structures, along with increase in Electric machinery & equipments, Aluminium and its products, Copper and its products, Industrial Machinery for dairy, Iron & Steel, Medical & Scientific Instruments, Products of Iron & Steel and etc.
- In November 2025, import increase was mainly noted from NE Asia,ASEAN, SSA( Sub Saharan Africa),CIS, North America and WANA.In cumulative terms like the previous month, importsincreasedfrom all regions barring North America and Latin America.
- The share of engineering imports in India’s total merchandise imports in Apr‑ Nov 2025 was estimated at 20.8 percent.
- 41.8 % of India’s engineering imports come from N E Asia and 20.4 % from the EU. The next major suppliers are ASEAN (12.7%), North America (7.7%) andWANA (7.1%) during Apr‑ Nov 2025.
Fig 3: Monthly Engineering Imports for April-November 2025-26 vis-a-vis April-November 2024-25
Source: DGCI&S
Trend In Engineering Trade Balance
We now present the trend in two‑way yearly trade for the engineering sector for the 2025‑26 depicted in the table below:
Table 10: Monthly Trend in Engineering Trade Balance for the current FY 2025-26 ‑ Values in US$ billion
Source: DGCI&S, EEPC India Analysis
CONCLUSION
In April‑November 2025, India’s total engineering exports increased by more than 4 percent on a year‑ on‑year basis as it reached USD 79.74 billion from USD 76.49 billion.The growth achieved by engineering exports was greater than that of total merchandise exports which recorded a growth of only 2.62 percent. Another remarkable feat achieved by engineering exports in November 2025 was crossing the USD 11 billion mark first time in the current fiscal– engineering exports in November 2025 recorded a significant growth of more than 23 percent as it reached USD 11.01 billion.This result is a testament to the relentless effort of the exporting community which quickly recovered from the 17 percent decline in engineering exports in October 2025. The growth story of engineering exports reflect the positive trend in global trade. As per the recently published UNCTAD Trade Update, global trade in goods and services continued to grow through the second half of 2025 and is expected to cross USD 35 trillion for the first time recording a growth of around 7 percent from 2024. In this journey, the support of the Government of India remains critical. We laud the approval of the Export Promotion Mission (EPM) with an outlay of INR 25060 crore from 2025‑26 to 2030‑31 and hope that it will be quickly implemented to provide respite to the exporting community.
The bilateral or multilateral trade agreements also play an important role for the development of a country’s export.We sincerely hope that the upcoming FTAs with EU and the BTA with US will also be instrumental for us. The newly concuded FTAs with Oman and New Zealand also promise positive windfall for the Indian exporters.Overall both global and domestic trade indicate positive trends which is good for the exporters however they should remain cautious given the rising volatility in global trade.

ANNEXURE-I
ENGINEERING PRODUCT PANELS – COUNTRY-WISE ANALYSIS
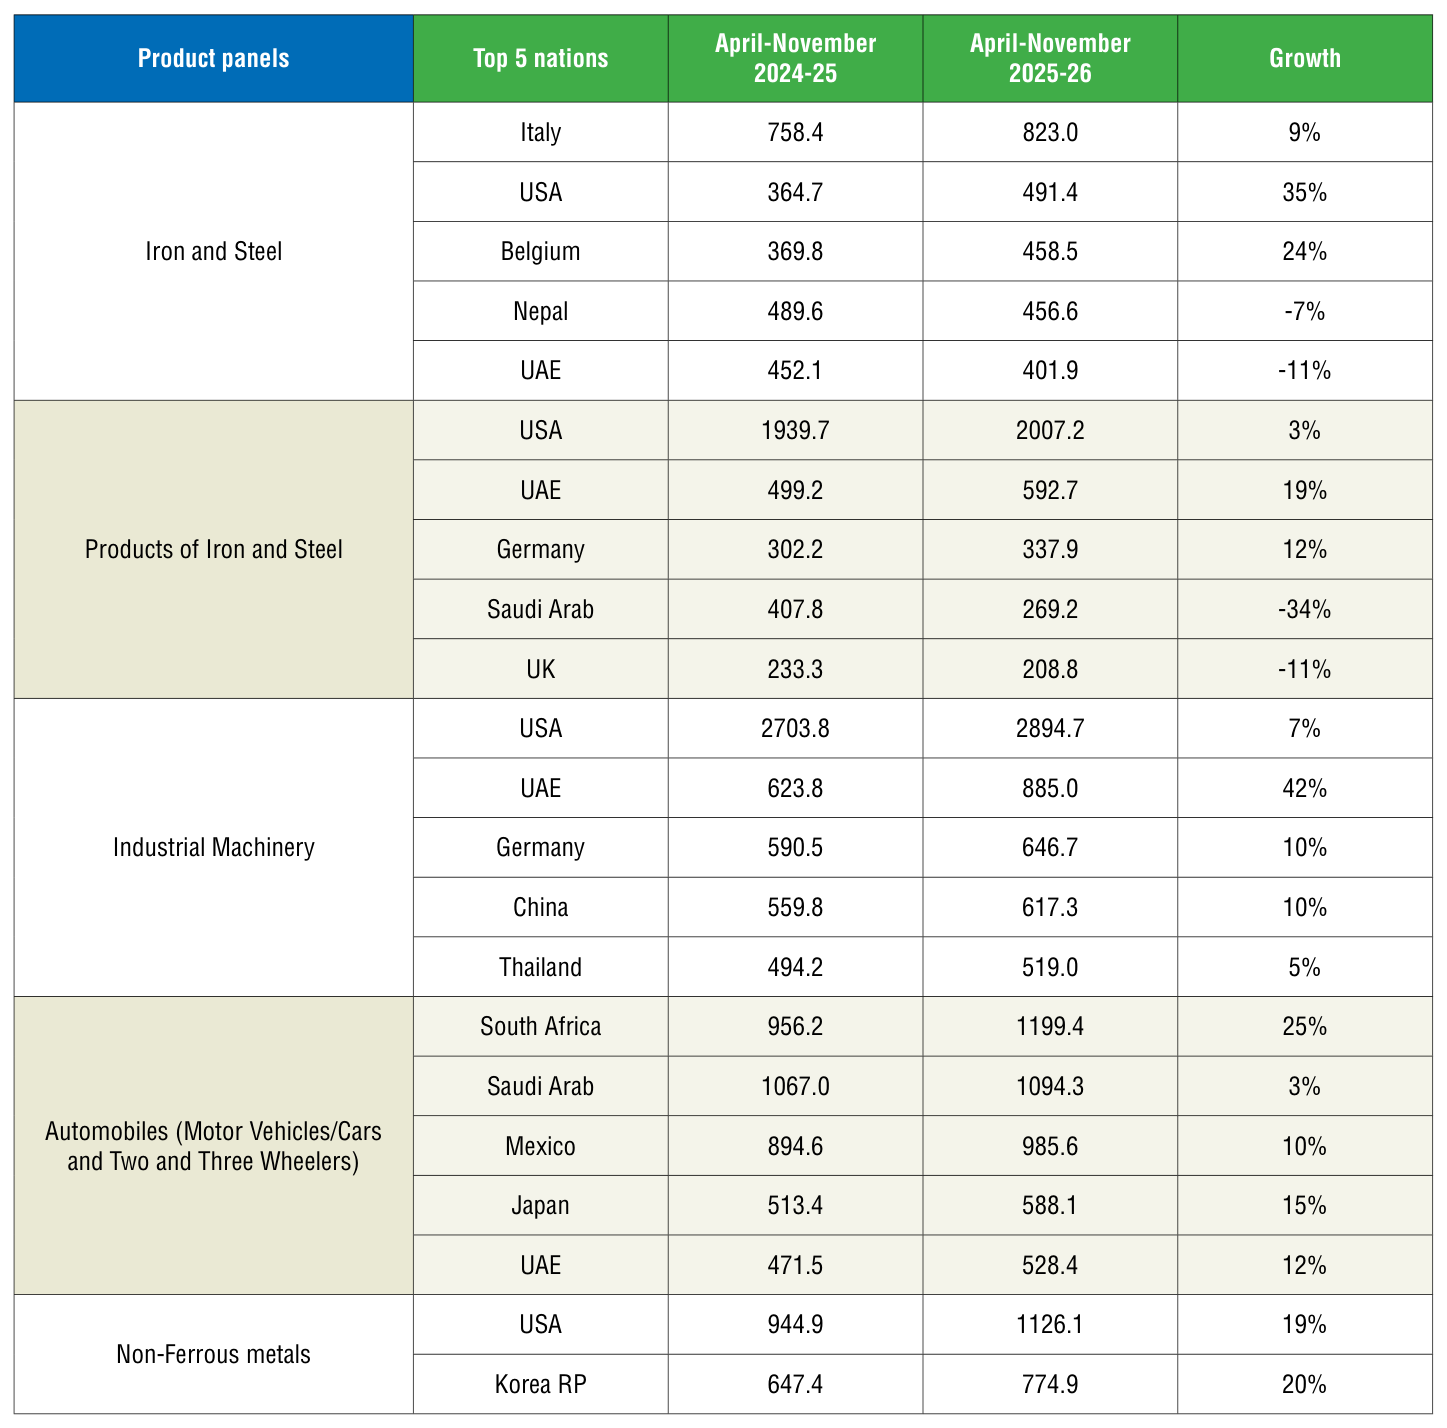
We now analyze the performance of some of the important products for the fiscal April‑November 2025‑26 vis‑à‑ vis April‑November 2024‑25. We have taken the major panels and computed the top importing countries to get an idea of the current trade pattern.
Engineering Product Panel - Country Matrix Value in USD million
Engineering Product Panel - Country matrix Value in USD million
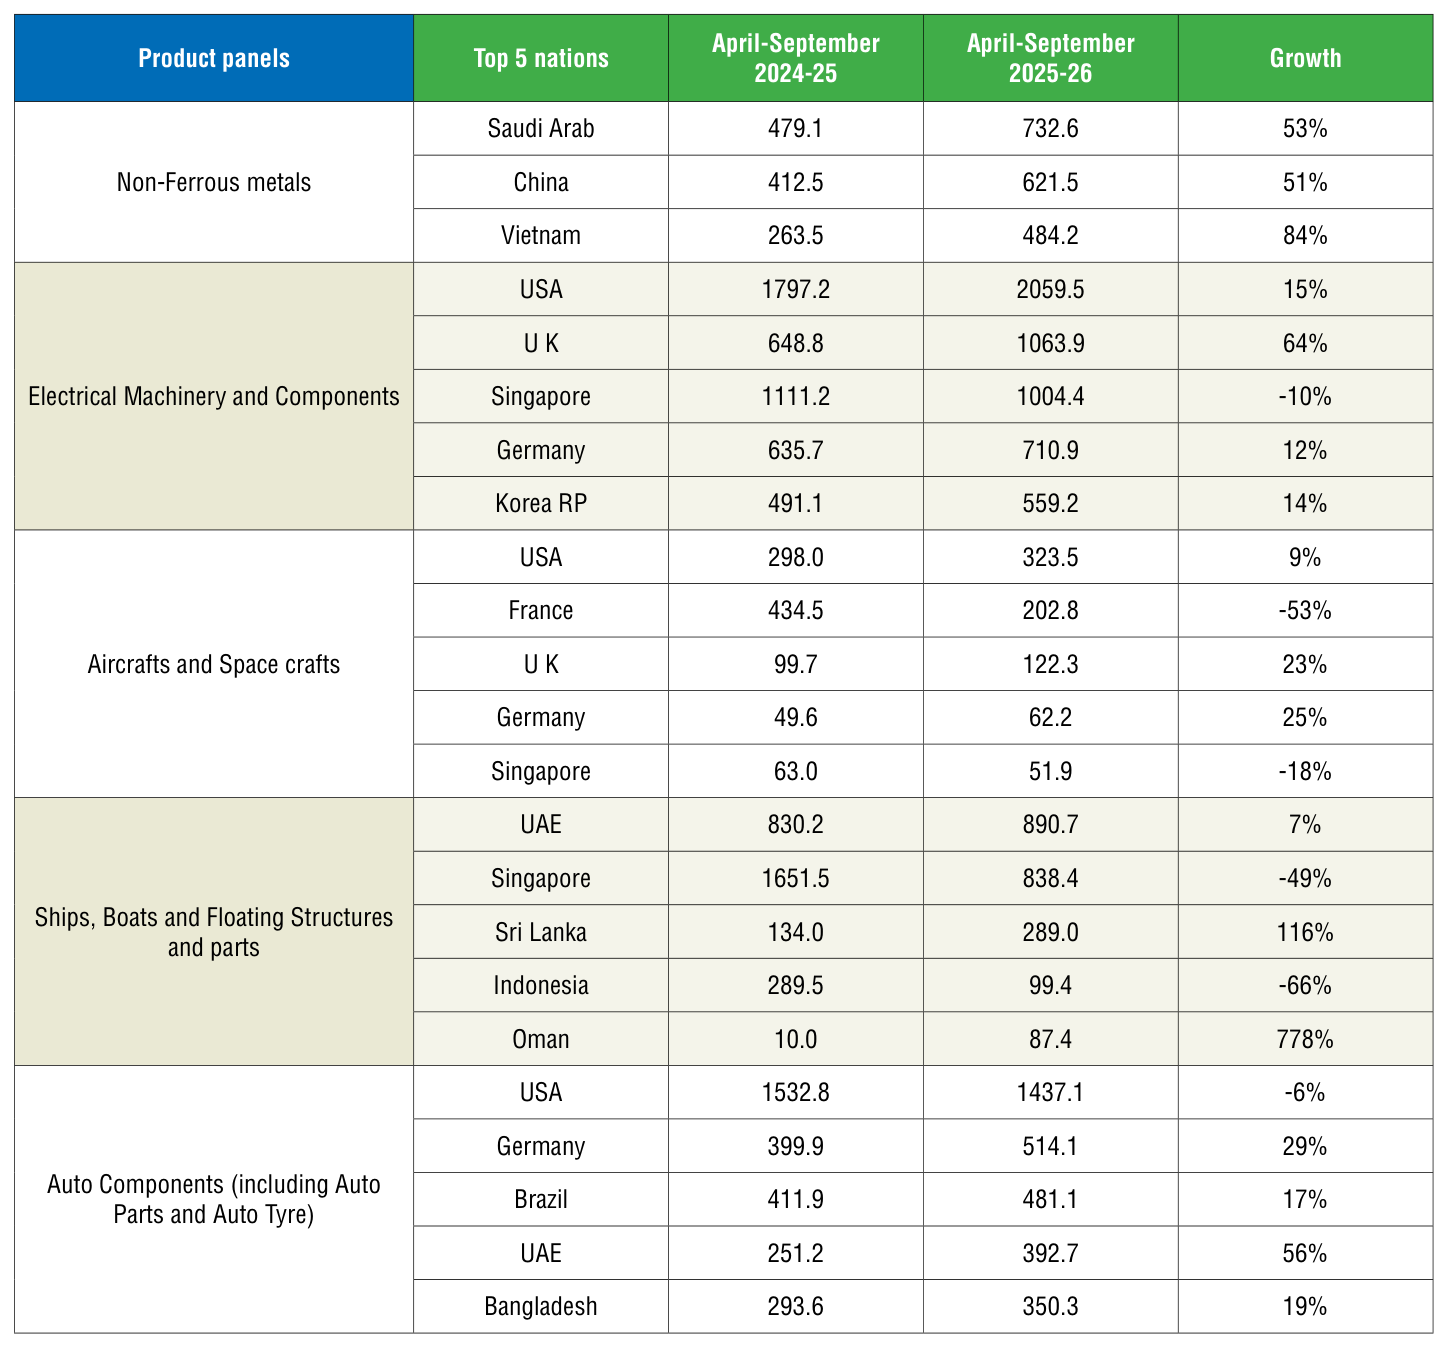
Source: DGCI&S
- In April‑November 2025, Italy, USA andBelgium ranked as the top three importers of Indian Iron and Steel, while the USA, UAE and Germany lead in im‑ port of products of Iron & Steel.
- The USA stood out as the pri‑ mary importer of Indian ‘Indus‑ trial machinery,’ making up 20% of India’s global exports in this category, followed by UAE and Germany with 6% ad 4% shares, respectively during April‑No‑vember 2025.
- South Africa, Saudi Arabia, Mex‑ ico, Japan and UAE were top importers of India’s Automo‑ biles during April‑November 2025 in India’s global exports

© Copyright , All rights reserved. Design by Andreal