


VOL. 18, ISSUE NO. 7 | October 2025
Oversight


Engineering exports from India recorded growth for the third straight month to August 2025 but moderated over the month
| Trade Flow | Export figures (in $ billion) | % Growth | ||||
|---|---|---|---|---|---|---|
| Aug-2024 | Aug-2025 | Apr - Aug 2024-25 | Apr - Aug 2025-26 | Aug 2025 over Aug 2024 | Apr-Aug 2025 over Apr-Aug 2024 | |
| Engineering exports | 9.44 | 9.90 | 46.52 | 49.24 | 4.91% | 5.86% |
| Overall merchandise exports | 32.89 | 35.10 | 179.60 | 184.13 | 6.73% | 2.52% |
| Share of engineering (%) | 28.69% | 28.20% | 25.90% | 26.74% | ||
| Service Exports | 30.36 | 34.06 | 149.43 | 165.22 | 12.19% | 10.57% |
HIGHLIGHTS
- Engineering exports continued its growth run for the third straight month to August 2025 but with a moderated growth of 4.91 percent as against a high double digit growth of 13.86 percent in July 2025.
- Engineering exports in August 2025 was recorded at USD 9.9 billion as against USD 9.4 billion in the same month last year, registering 4.91 percent growth.
- On a month-on-month basis, engineering exports declined by around 5 percent as the previous month saw engineering shipment crossed USD 10 billion to reach USD 10.4 billion.
- On a cumulative basis, engineering exports recorded 5.86 percent year-on-year growth during the first five months of fiscal 2025-26 as it went up to USD 49.24 billion in Apr – Aug 2025-26 from USD 46.52 billion during the same period last fiscal.
- The share of engineering in total merchandise exports rose to 28.2 percent in August 2025 from 28 percent in July 2025. The share was recorded at 26.74% on a cumulative basis during April – August 2025-26.
- In August 2025, 27 out of 34 engineering panels witnessed positive year-on-year growth. While 7 engineering panels including mainly Nickel and product, Electrical Machinery and Equipment, Aircrafts and Spacecrafts, Ship and Boats, Medical and Scientific Instruments and Hand Tools and Cutting Tools, etc. witnessed decline in exports during August 2025 vis-à-vis August 2024.
- On a cumulative basis, 26 out of 34 engineering panels recorded positive growth and remaining 8 engineering panels including Non-ferrous sectors including Aluminium products, Zinc products and Nickel, Aircraft and Spacecrafts, Cranes and Winches, etc. recorded negative growth during April-June 2025-26.
- Region wise, North America maintained its spot as the number one export destination with a share of 21% followed by EU (18%) and WANA (14%) in April-August 2025.
- Country-wise, USA remained the top destinations followed by UAE and Germany in August 2025 while maximum increase was noted in South Africa (74.1%),Belgium (48.9%), Spain (41.7%) and Italy (38.7%).
ENGINEERING EXPORTS: MONTHLY TREND
The monthly engineering export figures for 2025-26 vis-à-vis2024-25 are shown below as per the latest DGCI&S estimates:
Table 1: Engineering Exports: Monthly Trend in 2025-26 (Values in USD Million)
| Month | 2024-25 | 2025-26 | Growth (%) |
|---|---|---|---|
| April | 8557.11 | 9512.81 | 11.17 |
| May | 9974.13 | 9889.10 | -0.85 |
| June | 9386.21 | 9506.66 | 1.28 |
| April-June | 27917.46 | 28908.56 | 3.55 |
| July | 9162.17 | 10432.40 | 13.86 |
| August | 9437.14 | 9900.90 | 4.91 |
| April-August | 46516.78 | 49241.86 | 5.86 |
Source: DGCI&S, Govt. of India
TOP 25 ENGINEERING EXPORT DESTINATIONS IN AUGUST 2025
We now look at the export scenario of the top 25 nations that had highest demand for Indian engineering products during August 2025 over August 2024 as well as in cumulative terms during April-August 2025-26 vis-à-vis April-August 2024-25. The data clearly shows that top 25 countries contribute 75 % of total engineering exports.
Table 2: Engineering exports country-wise (Values in USD Million)
| Countries | August 2024 | August 2025 | Growth (%) | April-August 2023-24 | April-August 2024-25 | Growth (%) |
|---|---|---|---|---|---|---|
| U S A | 1566.8 | 1679.4 | 7.2% | 7741.4 | 8634.1 | 11.5% |
| UAE | 613.6 | 649.2 | 5.8% | 3236.8 | 3076.4 | -5.0% |
| GERMANY | 387.1 | 412.3 | 6.5% | 1731.0 | 2029.8 | 17.3% |
| U K | 331.8 | 382.9 | 15.4% | 1619.5 | 1922.6 | 18.7% |
| SAUDI ARABIA | 405.0 | 358.9 | -11.4% | 2224.6 | 1836.9 | -17.4% |
| SINGAPORE | 306.0 | 190.0 | -37.9% | 1672.7 | 1780.4 | 6.4% |
| MEXICO | 322.9 | 309.5 | -4.1% | 1592.7 | 1385.9 | -13.0% |
| ITALY | 218.2 | 302.7 | 38.7% | 1287.5 | 1379.1 | 7.1% |
| KOREA RP | 245.4 | 220.9 | -10.0% | 1093.9 | 1172.7 | 7.2% |
| SOUTH AFRICA | 177.9 | 309.8 | 74.1% | 895.4 | 1157.0 | 29.2% |
| CHINA | 261.9 | 242.5 | -7.4% | 1078.9 | 1087.7 | 0.8% |
| BRAZIL | 186.6 | 216.0 | 15.8% | 913.5 | 1075.0 | 17.7% |
| JAPAN | 201.7 | 164.6 | -18.4% | 909.6 | 1057.9 | 16.3% |
| NEPAL | 184.0 | 212.0 | 15.2% | 903.7 | 1008.3 | 11.6% |
| FRANCE | 158.9 | 190.5 | 19.9% | 773.1 | 930.2 | 20.3% |
| FRANCE | 160.4 | 184.2 | 14.8% | 466.6 | 536.6 | 15.0% |
| NETHERLAND | 148.1 | 194.9 | 31.6% | 801.2 | 927.9 | 15.8% |
| THAILAND | 184.0 | 174.8 | -5.0% | 822.0 | 904.1 | 10.0% |
| BANGLADESH | 152.4 | 174.8 | 14.7% | 848.9 | 862.2 | 1.6% |
| TURKEY | 280.6 | 162.0 | -42.3% | 1510.0 | 862.1 | -42.9% |
| BELGIUM | 114.2 | 170.0 | 48.9% | 577.9 | 764.8 | 32.3% |
| INDONESIA | 301.7 | 103.6 | -65.6% | 944.8 | 675.6 | -28.5% |
| SPAIN | 103.1 | 146.1 | 41.7% | 546.1 | 629.6 | 15.3% |
| VIETNAM | 113.3 | 142.5 | 25.7% | 582.7 | 615.0 | 5.5% |
| AUSTRALIA | 108.0 | 127.1 | 17.7% | 496.8 | 612.0 | 23.2% |
| CANADA | 95.0 | 128.8 | 35.6% | 510.8 | 557.4 | 9.1% |
| Total engineering exports to top 25 countries | 7168.4 | 7365.9 | 2.8% | 35315.57 | 36944.73 | 4.6% |
| Total engineering exports | 9437.1 | 9900.9 | 4.9% | 46516.8 | 49241.9 | 5.9% |
Source: DGCI&S, Govt. of India
REGION WISE INDIA’S ENGINEERING EXPORTS
Table 3: Region wise engineering exports in April-August 2025-26 vis-à-vis April-August 2024-25 (Values in USD Million)
| Region | August-24 | August-25 | Growth (%) | Apr'23 - August'24 | Apr'24 - August'25 | Growth (%) |
|---|---|---|---|---|---|---|
| NORTH AMERICA | 1984.8 | 2117.8 | 6.7% | 9844.9 | 10577.3 | 7.4% |
| EUROPEAN UNION | 1458.0 | 1839.5 | 26.2% | 7815.6 | 8843.8 | 13.2% |
| WANA | 1493.6 | 1450.2 | -2.9% | 7505.1 | 7088.9 | -5.5% |
| ASEAN | 1100.3 | 840.5 | -23.6% | 5088.4 | 4997.7 | -1.8% |
| SSA( Sub Saharan Africa) | 680.4 | 888.4 | 30.6% | 3153.4 | 3882.4 | 23.1% |
| N E ASIA | 778.5 | 714.7 | -8.2% | 3515.0 | 3807.8 | 8.3% |
| OTHER EUROPE | 638.1 | 584.2 | -8.4% | 3336.0 | 2978.9 | -10.7% |
| LATIN AMERICA | 496.2 | 565.9 | 14.0% | 2426.7 | 2966.6 | 22.2% |
| SOUTH ASIA | 506.1 | 567.3 | 12.1% | 2528.8 | 2692.7 | 6.5% |
| OCEANIA | 129.6 | 139.3 | 7.4% | 572.1 | 673.1 | 17.7% |
| CIS | 168.6 | 169.1 | 0.3% | 720.5 | 659.4 | -8.5% |
| OTHERS | 3.0 | 24.0 | 697.7% | 10.4 | 73.0 | 600.9% |
| Grand Total | 9437.1 | 9900.9 | 4.9% | 46516.8 | 49241.9 | 5.9% |
Source: DGCI&S
Note: Myanmar has been included in ASEAN and not in South Asia, since ASEAN is a formal economic grouping.
Source: DGCI&S
PANEL WISE INDIA’S ENGINEERING EXPORTS
In this section we look at the Engineering Panel wise exports for the month of August 2025 vis-à-vis August 2024 as well as the cumulative exports for April-August 2025-26 vis-à-vis April-August 2024-25. These are indicated in the tables below.
Table 4: Panel-wise Export Analysis for April-August 2025-26 vis-à-vis April-August 2024-25
| Product panels | August 2024 | August 2025 | Growth (%) | April-August 2024-25 | April-August 2025-26 | Growth (%) |
|---|---|---|---|---|---|---|
| Ferrous | ||||||
| Iron and Steel | 792.8 | 841.5 | 6% | 3874.0 | 4036.7 | 4.2% |
| Products of Iron and Steel | 865.1 | 890.6 | 3% | 3980.6 | 4375.7 | 10% |
| Sub Total | 1657.9 | 1732.2 | 4% | 7854.6 | 8412.4 | 7% |
| Non-ferrous | ||||||
| Copper and products | 182.2 | 226.8 | 24% | 805.8 | 1024.9 | 27% |
| Aluminium and products | 519.7 | 543.9 | 5% | 2784.6 | 2571.7 | -8% |
| Zinc and products | 40.8 | 58.0 | 42% | 289.3 | 257.9 | -11% |
| Nickel and products | 16.4 | 15.9 | -3% | 72.5 | 70.8 | -2% |
| Lead and products | 58.1 | 96.2 | 66% | 357.1 | 442.1 | 24% |
| Tin and products | 1.5 | 2.8 | 82% | 8.3 | 12.5 | 50% |
| Other Non-Ferrous Metals | 76.0 | 85.0 | 12% | 347.0 | 436.7 | 26% |
| Sub Total | 894.9 | 1028.5 | 15% | 4664.8 | 4816.5 | 3.3% |
| Industrial Machinery | ||||||
| Industrial Machinery like Boilers, parts, etc. | 71.4 | 86.2 | 21% | 319.4 | 394.2 | 23% |
| IC Engines and Parts | 316.7 | 350.7 | 11% | 1522.3 | 1767.6 | 16% |
| Pumps of all types | 129.2 | 133.1 | 3% | 623.7 | 656.8 | 5% |
| Air condition and Refrigerators | 163.4 | 180.3 | 10% | 739.2 | 925.2 | 25% |
| Industrial Machinery for dairy, food processing, etc. | 678.3 | 760.9 | 12% | 3366.5 | 3714.5 | 10% |
| Machine Tools | 68.4 | 85.3 | 25% | 331.9 | 389.7 | 17% |
| Machinery for Injecting moulding, valves and ATMs | 231.6 | 260.2 | 12% | 1121.8 | 1288.5 | 15% |
| Sub Total | 1659.0 | 1856.5 | 12% | 8024.8 | 9136.4 | 14% |
| Electrical Machinery | ||||||
| Electrical Machinery | 1156.9 | 1151.2 | 0% | 5700.2 | 6380.6 | 12% |
| Automobile and auto component | ||||||
| Motor Vehicle/cars | 775.9 | 1017.9 | 31% | 3609.1 | 4354.2 | 21% |
| Two and Three Wheelers | 260.1 | 347.2 | 33% | 1279.2 | 1561.9 | 22% |
| Auto Components/Part | 701.1 | 766.0 | 9% | 3404.2 | 3646.6 | 7% |
| Auto Tyres and Tubes | 242.1 | 254.2 | 5% | 1256.7 | 1328.3 | 6% |
| Sub Total | 1979.2 | 2385.3 | 21% | 9549.1 | 10890.9 | 14.1% |
| Aircrafts and related products | ||||||
| Aircrafts and Spacecraft parts and products | 439.3 | 134.3 | -69% | 2273.3 | 669.9 | -71% |
| Ships Boats and Floating products and parts | ||||||
| Ships Boats and Floating products and parts | 275.1 | 94.7 | -66% | 2001.4 | 1707.1 | -15% |
| Miscellaneous engineering products | ||||||
| Medical and Scientific instruments | 244.5 | 239.2 | -2% | 1084.5 | 1190.6 | 10% |
| Railway Transport | 28.6 | 52.6 | 84% | 131.4 | 190.9 | 45% |
| Project Goods | 0.2 | 0.1 | -33% | 0.9 | 0.6 | -37% |
| Sub total | 1218.7 | 1352.4 | 11% | 5714.4 | 6430.2 | 13% |
| Total engineering exports | 9437.1 | 9900.9 | 4.9% | 46516.8 | 49241.9 | 5.86% |
Source: DGCI&S
Reasons for Decline (As per April-August 2025-26)
Aluminium
- While cumulative aluminium exports have remained negative, it recorded slight growth in August 2025, first time in the current fiscal
- Massive decline noted in Turkey (80%) mainly due to ongoing geo-political tensions. Decline was also noted in Mexico, Netherlands, Bangladesh, Canada and Spain
- Increase in domestic demand is also a reason behind declining exports
Zinc
- As per the London Metal Exchange the global zinc market is facing significant downturn due to international trade tensions and weak macroeconomic conditions
Nickel
- The decline in India’s Nickel exports is mainly due to rising domestic demand especially in the EV and renewable sectorAs mentioned above there is also substantial domestic demand
Table 5: Panel-wise shares in India’s total engineering exports during April-August 2025-26
| S. No | Product Panels | Apr'24 - August'24 (Share%) | Apr'25 - August'25 (Share %) |
|---|---|---|---|
| 1. Iron and Steel and Products made of Iron and Steel | |||
| A | Iron and Steel | 8.3% | 8.2% |
| B | Products of Iron and Steel | 8.6% | 8.9% |
| Sub Total | 16.9% | 17.1% | |
| 2. Non-Ferrous Metals and Products made of Non-Ferrous Metals | |||
| A | Copper and products | 1.7% | 2.1% |
| B | Aluminium and products | 6.0% | 5.2% |
| C | Zinc and products | 0.6% | 0.5% |
| D | Nickel and products | 0.2% | 0.1% |
| Sub Total | 10.0% | 9.8% | |
| 3. Industrial Machinery | |||
| A | Industrial Machinery like Boilers, parts, etc | 1% | 1% |
| B | IC Engines and Parts | 3.3% | 3.6% |
| Sub Total | 17.3% | 18.6% | |
| 4. Electrical Machinery | |||
| Electrical Machinery | 12% | 13% | |
| 5. Automobiles | |||
| A | Motor Vehicle/cars | 8% | 9% |
| B | Two and Three Wheelers | 3% | 3% |
| C | Auto Components/Part | 7% | 7% |
| D | Auto Tyres and Tubes | 3% | 3% |
| Sub Total | 21% | 22% | |
| 6. Aircrafts and Spacecraft parts and products | |||
| Aircrafts and Spacecraft parts and products | 5% | 1% | |
| 7. Ships Boats and Floating products and parts | |||
| Ships Boats and Floating products and parts | 4% | 3% | |
| 8. Project Goods | |||
| Project Goods | 0% | 0% | |
| 9. Other Rubber Product Except Footwear | |||
| Other Rubber Product Except Footwear | 2% | 2% | |
| 10. Other engineering products | |||
| A | Medical and Scientific instruments | 2% | 2% |
| B | Railway Transport | 0% | 0% |
| G | Other Construction Machinery | 3% | 3% |
| I | Other Misc. Items | 4% | 5% |
| Sub total | 12% | 13% | |
| Total engineering exports | 100% | 100% | |
ENGINEERING EXPORTS – STATE-WISE ANALYSIS
State wise engineering export performance-Data as on 2024-25
( Note: Current fiscal 2025-26 data not yet updated in Niryat Portal)
The table below indicates the exports from top Indian states. It is evident from the table that almost 91.5% of India’s exports is contributed by the listed 12 states. Within this almost 50 percent of exports is done by Maharashtra, Tamil Nadu and Gujarat together.
Table 6: Top state wise engineering export performance – April-March 2024-25
| Top States | 2023-24 | 2024-25 | Growth% | %Share In India's Eng Export |
Remark |
|---|---|---|---|---|---|
| Maharashtra | 22992.9 | 22546.4 | -1.9% | 19.7% | 91.5% share covered by top 12 states |
| Tamil Nadu | 16844.6 | 18108.6 | 7.5% | 15.8% | |
| Gujarat | 14753.3 | 16590.5 | 12.5% | 14.5% | |
| Telangana | 3458.0 | 7536.2 | 117.9% | 6.6% | |
| Karnataka | 6709.1 | 7277.3 | 8.5% | 6.3% | |
| Haryana | 6753.8 | 6764.5 | 0.2% | 5.9% | |
| Odisha | 7125.2 | 5910.1 | -17.1% | 5.2% | |
| Delhi | 4599.7 | 4684.5 | 1.8% | 4.1% | |
| Uttar Pradesh | 4117.9 | 4348.7 | 5.6% | 3.8% | |
| Andhra Pradesh | 4885.6 | 4319.4 | -11.6% | 3.8% | |
| West Bengal | 3134.8 | 3523.7 | 12.4% | 3.1% | |
| Rajasthan | 3405.3 | 3375.7 | -0.9% | 2.9% |
Source: NIRYAT portal
- Top 12 states constitute over 91.5 % of India’s engineering Exports. Once again, Karnataka maintained its 5th position, Telengana retained its 4th position, Odisha coming down to 7th position, West Bengal coming down to 11th position, while Rajasthan moving up to 12th position and Haryana remarkably moved up to 6th position during the fiscal April-March 2024-25 compared to the same period last fiscal.( as per estimates of Niryat Portal)
- Major negative growth witnessed in states like Maharashtra ( decline by 1.9%), Odisha, ( decline by 17.1%), Andhra Pradesh (decline by 11.6%) and Rajasthan (decline by 0.9%) during April-March 2024-25 compared to the same period last fiscal.
- Maharashtra being the highest state in terms of Engineering Goods exports ( constituting a share of 19.7%) is leading by US$ 4.44 billion from Tamil Nadu(Second Highest State) for the period of April-March 2024-25
India’s Region Wise Engineering Exports
In terms of region, western region which includes industrial states like Maharashtra and Gujarat is the front runner in terms of exports with 34.1 percent share. Tamil Nadu from the Southern Region has retained its export performance and it ranked second after Maharashtra, while Gujarat and Telengana ranked third and fourth during April-March 2024-25.
Note: The total engineering exports given in the above table is taken from NIRYAT as per the latest available data and may not tally with the total engineering exports as given by DGCI&S
| Region | 2023-24 | 2024-25 | Growth% |
|---|---|---|---|
| EASTERN REGION | 12236.7 | 11089.7 | -4.3% |
| NORTHERN REGION | 22651.0 | 22571.4 | -64.6% |
| SOUTHERN REGION | 33012.2 | 38262.6 | 22.2% |
| WESTERN REGION | 41415.4 | 42797.8 | 4.6% |
CORRELATION BETWEEN MANUFACTURING OUTPUT AND ENGINEERING EXPORTS
Engineering forms a considerable part of the broader manufacturing sector and the share of engineering production in overall manufacturing output is quite significant. As exports generally come from what is produced within a country, some correlation between manufacturing production growth and engineering export growth should exist. We briefly look at the trend in manufacturing growth as also engineering export growth to see if they move in tandem. It may be mentioned that manufacturing has 77.63% weightage in India’s industrial production.
Engineering export growth and manufacturing output growth moved in the same direction in as many as nine out of twelve months in each of the fiscal years 2019-20 and 2020-21. During fiscal 2021- 22, engineering export growth and manufacturing growth moved in the same direction in seven out of twelve monthswhile in each of fiscal 2022-23 and 2023-24, as many as 10 out of 12 months saw engineering exports and manufacturing output moved in the same direction. In 2024-25, both moved in the same direction in eight out of 12 months.
The first two month of fiscal 2025-26 saw engineering export growth and manufacturing output growth moved in the opposite direction. In April, engineering export growth surged to double digit andmanufacturing growth decelerated, while in May engineering export declined and manufacturing output growth inched up over the month. In June and July 2025 however, both moved on the same direction witnessing improvement in growth.
The link between these two may not be established in one or two months, but a positive correlation may be seen if medium to long term trend is considered.
Table 8: Engineering exports growth vis-à-vis manufacturing growth from April 2024
| Months/ Year | Engg. Export Growth (%) | Manufacturing Growth (%) |
|---|---|---|
| April 2024 | -4.49 | 4.2 |
| May 2024 | 7.43 | 5.1 |
| June 2024 | 10.26 | 3.5 |
| July 2024 | 5.12 | 4.7 |
| August 2024 | 4.28 | 1.2 |
| September 2024 | 10.55 | 4.0 |
| October 2024 | 39.27 | 4.4 |
| November 2024 | 13.72 | 5.5 |
Source: Department of Commerce and CSO
| Months/ Year | Engg. Export Growth (%) | Manufacturing Growth (%) |
|---|---|---|
| December 2024 | 8.33 | 3.7 |
| January 2025 | 7.49 | 5.8 |
| February 2025 | -8.64 | 2.8 |
| March 2025 | -3.92 | 4.0 |
| April 2025 | 11.29 | 3.1 |
| May 2025 | -0.80 | 3.2 |
| June 2025 | 1.28 | 3.7 |
| July 2025 | 13.86 | 5.4 |
IMPACT OF EXCHANGE RATE ON INDIA’S EXPORTS
How did the exchange rate fare during August 2025 and what was the recent trend in Re-Dollar movement? In order to get a clearer picture of the recent Re-Dollar trend, not only we took the exchange rate of August 2025, but also considered monthly average exchange rate of Rupee vis-à-vis the US Dollar for each month of fiscal2023-24, 2024-25 and fiscal 2025-26 as per the latest data published, as mere one-month figure does not reflect any trend. The following two tables clearly depicts the short-term trend.
Table 9: USD-INR monthly average exchange rate in 2025-26 vis-à-vis 2024-25 (As per latest data released by FBIL)
| Monthly Average Exchange Rate (1 USD to INR) | Year-on-Year Change (%) | Direction | Month-on-Month Change (%) | Direction | ||
|---|---|---|---|---|---|---|
| Month | 2024-25 | 2025-26 | ||||
| April | 83.41 | 85.56 | 2.58 | Depreciation | -1.25 | Appreciation |
| May | 83.39 | 85.19 | 2.16 | Depreciation | -0.43 | Appreciation |
| June | 83.47 | 85.90 | 2.91 | Depreciation | 0.83 | Depreciation |
| July | 83.59 | 86.11 | 3.01 | Depreciation | 0.24 | Depreciation |
| August | 83.90 | 87.52 | 4.31 | Depreciation | 1.64 | Depreciation |
Rupee continued to depreciate both on a monthly as well as yearly basis for the third straight month in August 2025 as INR hit its lowest: INR depreciated vis-à-vis the US Dollar by 1.64percent in July 2025 over the previous month and a much higher 4.31percent on a year-on-year basis. Rupee dropped to below 87 per US Dollar in July that continued in August 2025 andit closed the month at 87.85 per US Dollar (FBIL data). Uncertainty over an India-U.S. trade deal after U.S. President Donald Trump hinted at tariff hike continued to wigh on rupee. Month-end dollar demand from importers and sustained foreign fund outflows also weighed on the Indian local unit.
Outlook: Uncertainty ontrade due to imposition of reciprocal tariff by USA clouded the global socioeconomic scenario and hence the outlook for rupee. A trend may be established once tariff stability is seen.
Table 10: USD-INR monthly average exchange rate in 2024-25 vis-à-vis 2023-24 (As per latest data released by FBIL)
| Monthly Average Exchange Rate (1 USD to INR) | Year-on-Year Change (%) | Direction | Month-on-Month Change (%) | Direction | ||
|---|---|---|---|---|---|---|
| Month | 2024-25 | 2025-26 | ||||
| April | 82.02 | 83.41 | 1.69 | Depreciation | 0.49 | Depreciation |
| May | 82.34 | 83.39 | 1.28 | Depreciation | -0.02 | Appreciation |
| June | 82.23 | 83.47 | 1.51 | Depreciation | 0.10 | Depreciation |
| July | 82.15 | 83.59 | 1.75 | Depreciation | 0.14 | Depreciation |
| August | 82.79 | 83.89 | 1.33 | Depreciation | 0.36 | Depreciation |
| October | 83.24 | 84.02 | 0.94 | Depreciation | 0.25 | Depreciation |
| November | 83.30 | 84.36 | 1.27 | Depreciation | 0.40 | Depreciation |
| December | 83.28 | 84.99 | 2.05 | Depreciation | 0.75 | Depreciation |
| January | 83.14 | 86.27 | 3.76 | Depreciation | 1.51 | Depreciation |
| February | 82.96 | 87.05 | 4.93 | Depreciation | 0.90 | Depreciation |
| March | 83.00 | 86.64 | 4.39 | Depreciation | -0.47 | Appreciation |
Fig 2: Trend of Rupee vis-a-vis US dollar from April 2021 (Monthly Average Rate of FBIL has been considered)
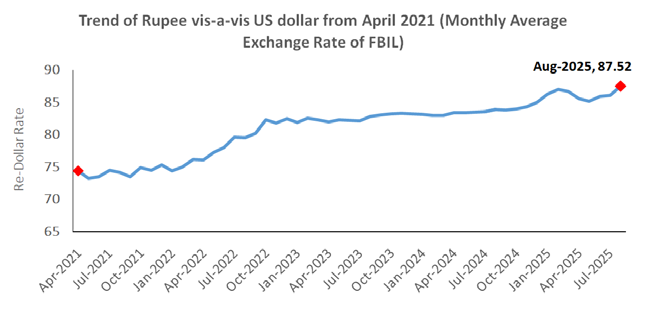
Source: FBIL
ANALYSIS OF INDIA’S ENGINEERING IMPORTS
- India’s Engineering imports during August 2025 were valued at US$ 13.2 billion compared to US$ 14.1 billion in August 2024 registering a negative growth of 6.5percent in dollar terms. In cumulative terms (Apr-Aug 2025), India’s imports increased by 5.8%.
- In August 2025, imports increased for industrial machinery for diary , electric machinery &equipments, aluminium and products, medical & scientific instruments, products of iron & steel, machine tools, zinc and its products, motor vehicles & cars, railway transport, etc.
- In August 2025, import increase was mainly noted from South Asia, WANA and North East Asia. In cumulative terms also import increased mainly happened from these regions along with ASEAN, Other European nations, CIS and Oceania.
- The share of engineering imports in India’s total merchandise imports in Apr-August 2025 was estimated at 21.3percent.
- 42% of India’s engineering imports come from N E Asia and 19.5% from the EU. The next major suppliers are ASEAN (12.8%), North America (8.0%)and WANA(7.4%).
Fig 3: Monthly Engineering Imports for April-August 2025-26 vis-a-vis April-August 2024-25
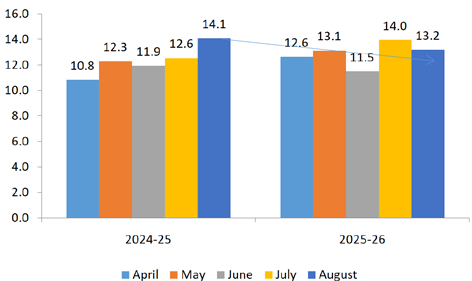
Source: DGCI & S
TREND IN ENGINEERING TRADE BALANCE
We now present the trend in two-way yearly trade for the engineering sector for the 2025-26 depicted in the table below:
Table 11: Monthly Trend in Engineering Trade Balance for the current FY 2025-26
| Trade Flow | Apr | May | June | July | Aug |
|---|---|---|---|---|---|
| Engineering Export | 9.5 | 9.9 | 9.5 | 10.4 | 9.9 |
| Engineering Import | 12.6 | 13.1 | 11.5 | 14.0 | 13.2 |
| Trade Balance | -3.1 | -3.2 | -2.0 | -3.6 | -3.3 |
CONCLUSION
India’s engineering exports continued its growth journey in the month of August recording a growth of 4.9% over last year. This growth comes at a time when our exporters are facing significant global challenges especially the threat of reciprocal and section 232 tariffs from the US and increasing logistics and shipping costs due to growing geo-political tensions. Therefore it is a significant achievement for the exporting community. In this difficult times, the FTA signed with UK will become a major benefit to the industry as it will further pave our presence in the UK market. However, the FTA doesnot address the CBAM concerns which may act as a significant barrier. As India negotiates another FTA with EU, we hope it would address the non-tariff barrier concerns such as CBAM to make the FTAs truly effective. Also, we urge the government to provide us support for better marketing of Indian products abroad as diversification of products and destinations is the key. The support of the government will also be crucial to address the issues of export credit, rising raw material prices and rising logistics cost. The industry strongly believes that resolution to the above issues would make India truly competitive in the global market.

ANNEXURE-I
ENGINEERING PRODUCT PANELS – COUNTRY-WISE ANALYSIS
We now analyze the performance of some of the important products for the fiscal April-August 2025-26 vis-à-vis April-August 2024-25. We have taken the major panels and computed the top importers to get an idea of the current trade pattern.
Engineering Product Panel - Country matrix Value in USD million
| Product panels | Top 5 nations | Apr-Aug 2024-25 | Apr-Aug 2025-26 | Growth |
|---|---|---|---|---|
| Iron and Steel | Italy | 516.4 | 478.5 | -7% |
| USA | 184.5 | 344.1 | 87% | |
| Belgium | 219.2 | 315.8 | 44% | |
| Nepal | 287.1 | 291.1 | 1% | |
| UAE | 243.3 | 212.3 | -13% | |
| Products of Iron and Steel | USA | 1182.8 | 1319.1 | 12% |
| UAE | 291.8 | 365.0 | 25% | |
| Germany | 186.4 | 211.0 | 13% | |
| Saudi Arab | 298.5 | 163.0 | -45% | |
| Qatar | 103.8 | 129.8 | 25% | |
| Industrial Machinery | USA | 1688.3 | 1941.3 | 15% |
| UAE | 367.7 | 507.8 | 38% | |
| Germany | 390.0 | 412.3 | 6% | |
| China | 363.3 | 357.1 | -2% | |
| Thailand | 317.7 | 330.9 | 4% | |
| Automobiles (Motor Vehicles/Cars and Two and Three Wheelers) | South Africa | 495.8 | 719.1 | 45% |
| Saudi Arab | 647.1 | 643.1 | -1% | |
| Mexico | 659.3 | 638.6 | -3% | |
| Japan | 288.1 | 350.1 | 22% | |
| UAE | 283.5 | 306.4 | 8% | |
| Non-Ferrous metals | USA | 604.7 | 750.8 | 24% |
| Korea RP | 393.5 | 432.8 | 10% | |
| Saudi Arab | 289.8 | 383.4 | 32% | |
| China | 200.2 | 286.2 | 43% | |
| Vietnam | 171.0 | 218.3 | 28% | |
| Electrical Machinery and Components | USA | 1114.4 | 1346.8 | 21% |
| UK | 452.7 | 667.2 | 47% | |
| Singapore | 645.3 | 608.1 | -6% | |
| Germany | 339.5 | 461.4 | 36% | |
| Korea RP | 319.6 | 348.9 | 9% | |
| Aircrafts and Space crafts | USA | 180.7 | 200.7 | 11% |
| France | 97.4 | 121.8 | 25% | |
| UK | 60.4 | 78.2 | 29% | |
| Germany | 31.3 | 40.1 | 28% | |
| Singapore | 20.3 | 37.3 | 84% | |
| Ships, Boats and Floating Structures and parts | Singapore | 534.9 | 690.4 | 29% |
| UAE | 663.8 | 559.7 | -16% | |
| Indonesia | 232.7 | 96.2 | -59% | |
| Sri Lanka | 87.1 | 90.8 | 4% | |
| Oman | 0.1 | 65.9 | 110259% | |
| Auto Components (including Auto Parts and Auto Tyre) | USA | 986.3 | 952.8 | -3% |
| Germany | 258.0 | 320.5 | 24% | |
| Brazil | 258.7 | 315.4 | 22% | |
| UAE | 146.2 | 251.6 | 72% | |
| Bangladesh | 163.2 | 223.5 | 37% |
Source: DGCI&S
- In April-August 2025, Italy, USA andBelgium ranked as the top three importers of Indian Iron and Steel, while the USA, UAE and Germany lead in import of products of Iron & Steel.
- The USA stood out as the primary importer of Indian ‘Industrial machinery,’ making up 21% of India’s global exports in this category, followed by UAE and Germany with 6% ad 5% shares, respectively during April-August 2025.
- South Africa, Saudi Arabia, Mexico, Japan and UAE were top importers of India’s Automobiles during April-August 2025 in India’s global exports respectively over the same period previous fiscal.
- USA, South Korea, Saudi Arabia, China and Vietnam were the top importers of India’s Non-ferrous metals and products during April-August 2025.
- USA, UK, Singaporeand Germany were the top importers of Indian Electrical Machinery & Components during the same period with 21%, 10%, 10% and 7% shares respectively.
- USA, France,UK, Germany and Singapore were the top importers of India’s Aircrafts and Spacecraft during April-August 2025, making up to 71% of India’s total export of Aircrafts and Spacecraft
- Singapore, UAE and Indonesia became the largest importer of ships, boats and floating structures followed by Sri Lanka and Oman, making up to 88% of India’s total export of ships, boats and floating structures.
- For the auto components’ product group, USA remained the top importer in April-August 2025 followed by Germany, Brazil, UAE and Bangladesh, making up to 41% of India’s total export under this category.

© Copyright , All rights reserved. Design by Andreal