


VOL. 18, ISSUE NO. 5 | August 2025
Oversight


Engineering Goods exports stood at $9.5 billion in June 2025
| Trade Flow | Export figures (in US$ billion) | Growth (%) | ||||
|---|---|---|---|---|---|---|
| Jun-2024 | Jun-2025 | Apr - Jun 2024-25 | Apr - Jun 2025-26 | Jun 2025 over Jun 2024 | Apr-Jun 2025 over Apr-Jun 2024 | |
| Engineering exports | 9.38 | 9.50 | 27.89 | 28.91 | 1.35% | 3.63% |
| Overall merchandise exports | 35.16 | 35.14 | 110.06 | 112.17 | -0.05% | 1.92% |
| Share of engineering (%) | 26.67% | 27.04% | 25.34% | 25.77% | --- | --- |
| Service Exports | 28.67 | 32.84 | 88.46 | 98.13 | 14.54% | 10.93% |
Source: Compiled from data by DGCI&S and Quick Estimates published by the Government of India.
After a decline in May 2025, Indian engineering exports once again came back to growth path in June 2025 with a 1.35 percent year-on- year growth. Exports however was somewhat lower as compared to May 2025. During June 2025, engineering exports from India was recorded at USD 9,504.54 million as against USD 9,377.98 million in the same month last fiscal, sighting a marginal 1.35 percent growth. Many of the product panels achieved decent growthin exports including Electric Machinery and equipment, Products of iron and steel, IC engines and parts, and Two and three wheelers among others that helped overall engineering to see an export growth in June after a decline in May 2025. On a cumulative basis also growth was continued at 3.63 percent year-on-year during the first quarter of 2025-26. The most positive factor for engineering exports is growth in exports of Iron and Steel on both monthly as well as cumulative basis after remaining subdued in the last two fiscals. Country-wise analysis shows that among the top export destinations, USA, Singapore, Germany and UK witnessed growth in exports while UAE continued to see decline. Region-wise analysisreflects all regions except WANA, Other Europe and CISsaw year-on-year growth in shipment in the ongoing fiscal.
HIGHLIGHTS
- Engineering exports from India in June 2025 was recorded at USD 9504.54million as against USD 9377.98 million in June 2024, registering 1.35 percent growth in shipment.
- On a cumulative basis, India’s engineering export continued to grow. Cumulative engineering exports for April- June 2025 rose to USD 28,905.86million from USD 27,894.03million during the same period last fiscal, securing 3.63 percent growth.
- According to the Quick Estimates of Department of Commerce, Government of India, share of engineering in India’s total merchandise exports increased to 27.04 percent in June 2025 from 25.53 percent in May 2025 and 24.71 percent in April 2025.
- On a cumulative basis, share of engineering in total merchandise exports during Apr-Jun 2025-26 stood at 25.77 percent.
- In June 2025, 27 out of 34 engineering panels witnessed positive year-on-year growth. While 7 engineering panels including mainly Non ferrous metals like Aluminium, Zinc, Nickel, Machine Tools, Boilers and parts, Aircrafts and Spacecrafts, Ship and Boats, etc witnessed decline in exports during June 2025 vis-à-vis June 2024.
- On a cumulative basis, 26 out of 34 engineering panels recorded positive growth and remaining 8 engineering panels including Non-ferrous sectors including Aluminium products, Zinc products and Nickel, Aircraft and Spacecrafts, Cranes and Winches, etc. recorded negative growth during April-June 2025-26.
- Region wise, North America maintained itsspot as the number one export destination with a share of 22% followed by EU (18%) and WANA (14%) in Apr- June 2025. Significant export growth was noted in Latin America (22.4%), SSA (17.8%), NE Asia (8%), and in June2025.
- Country-wise, USA remained the top destinations followed by UAE and Singapore in June 2025 while maximum increase was noted in Singapore (19.9%), Getmany (18.2%), South Korea (17.2%).
ENGINEERING EXPORTS: MONTHLY TREND
The monthly engineering export figures for 2025-26 vis-à-vis 2024-25 are shown below as per the latest DGCI&S estimates:
Table 1: Engineering Exports: Monthly Trend in 2025-26 (Values in USD Million)
| Trade Flow | Export figures (in US$ billion) | Growth (%) | ||||
|---|---|---|---|---|---|---|
| Jun-2024 | Jun-2025 | Apr - Jun 2024-25 | Apr - Jun 2025-26 | Jun 2025 over Jun 2024 | Apr-Jun 2025 over Apr-Jun 2024 | |
| Engineering exports | 9.38 | 9.50 | 27.89 | 28.91 | 1.35% | 3.63% |
| Overall merchandise exports | 35.16 | 35.14 | 110.06 | 112.17 | -0.05% | 1.92% |
| Share of engineering (%) | 26.67% | 27.04% | 25.34% | 25.77% | --- | --- |
| Service Exports | 28.67 | 32.84 | 88.46 | 98.13 | 14.54% | 10.93% |
Source: DGCI&S, Govt. of India
TOP 25 ENGINEERING EXPORT DESTINATIONS IN JUNE 2025
We now look at the export scenario of the top 25 nations that had highest demand for Indian engineering products during May 2025 over May 2024 as well as in cumulative terms during April-May 2025-26 vis-à-vis April-May 2024-25. The data clearly shows that top 25 countries contribute 75.5% of total engineering exports.
Table 2: Engineering exports country-wise (Values in USD Million)
| Countries | June 2024 | June 2025 | April-June 2023-24 | April-June 2024-25 | Growth (%) | |
|---|---|---|---|---|---|---|
| U S A | 1574.3 | 1737.9 | 10.4% | 4651.4 | 5135.3 | 10.4% |
| U A E | 787.9 | 630.6 | -20.0% | 1991.7 | 1852.9 | -7.0% |
| SINGAPORE | 309.9 | 371.6 | 19.9% | 969.2 | 1236.6 | 27.6% |
| GERMANY | 334.2 | 394.9 | 18.2% | 1011.3 | 1159.0 | 14.6% |
| U K | 362.3 | 412.6 | 13.9% | 1012.9 | 1136.3 | 12.2% |
| SAUDI ARABIA | 384.4 | 364.7 | -5.1% | 1407.1 | 1096.2 | -22.1% |
| MEXICO | 314.8 | 259.7 | -17.5% | 929.1 | 785.8 | -15.4% |
| ITALY | 279.3 | 240.9 | -13.7% | 843.0 | 783.9 | -7.0% |
| KOREA RP | 206.4 | 241.9 | 17.2% | 618.3 | 715.1 | 15.7% |
| JAPAN | 171.2 | 190.3 | 11.2% | 542.5 | 636.7 | 17.4% |
| BRAZIL | 181.2 | 203.4 | 12.2% | 546.7 | 631.2 | 15.5% |
| SOUTH AFRICA | 202.9 | 232.2 | 14.5% | 499.0 | 619.8 | 24.2% |
| NEPAL | 190.0 | 183.4 | -3.5% | 536.2 | 617.9 | 15.3% |
| CHINA | 190.1 | 208.1 | 9.4% | 619.2 | 581.2 | -6.1% |
| NETHERLAND | 202.4 | 183.0 | -9.6% | 481.9 | 553.7 | 14.9% |
| FRANCE | 160.4 | 184.2 | 14.8% | 466.6 | 536.6 | 15.0% |
| THAILAND | 159.4 | 176.9 | 11.0% | 476.6 | 527.2 | 10.6% |
| TURKEY | 286.9 | 147.9 | -48.4% | 963.6 | 516.8 | -46.4% |
| BANGLADESH | 214.0 | 160.4 | -25.1% | 542.2 | 512.7 | -5.4% |
| BELGIUM | 109.9 | 126.8 | 15.3% | 351.5 | 417.2 | 18.7% |
| INDONESIA | 202.8 | 108.9 | -46.3% | 475.0 | 403.4 | -15.1% |
| AUSTRALIA | 98.7 | 103.2 | 4.6% | 294.6 | 366.0 | 24.2% |
| SPAIN | 112.1 | 104.8 | -6.5% | 324.9 | 349.1 | 7.4% |
| VIETNAM SOC REP | 106.9 | 110.6 | 3.5% | 353.7 | 344.5 | -2.6% |
| CANADA | 110.4 | 109.5 | -0.8% | 322.4 | 322.0 | -0.1% |
| Total engineering exports to top 25 countries | 7252.8 | 7188.5 | -0.9% | 21230.5 | 21837.0 | 2.9% |
| Total engineering exports | 9378.0 | 9504.5 | 1.3% | 27894.0 | 28905.9 | 3.6% |
Source: DGCI&S
REGION WISE INDIA’S ENGINEERING EXPORTS
The following table depicts region wise India’s engineering exports for April-June 2025 as compared to April-June 2024
Table 3: Region wise engineering exports in April-June 2025-26 vis-à-vis April-June 2024-25 (Values in USD Million)
| Region | June-24 | June-25 | Growth (%) | Apr'23 - June'24 | Apr'24 - June'25 | Growth (%) |
|---|---|---|---|---|---|---|
| NORTH AMERICA | 1999.5 | 2107.1 | 5.4% | 5902.9 | 6243.1 | 5.8% |
| EUROPEAN UNION | 1567.4 | 1660.8 | 6.0% | 4726.1 | 5098.6 | 7.9% |
| WANA | 1552.1 | 1404.7 | -9.5% | 4597.1 | 4175.2 | -9.2% |
| ASEAN | 995.4 | 931.4 | -6.4% | 2946.5 | 3097.5 | 5.1% |
| N E ASIA | 678.3 | 732.9 | 8.0% | 2062.1 | 2229.2 | 8.1% |
| SSA( Sub Saharan Africa) | 622.4 | 733.3 | 17.8% | 1761.6 | 2186.1 | 24.1% |
| OTHER EUROPE | 683.8 | 593.1 | -13.3% | 2132.7 | 1770.3 | -17.0% |
| LATIN AMERICA | 471.7 | 577.2 | 22.4% | 1466.9 | 1736.7 | 18.4% |
| SOUTH ASIA | 563.0 | 541.8 | -3.8% | 1539.0 | 1595.1 | 3.6% |
| OCEANIA | 114.5 | 112.3 | -1.9% | 334.6 | 401.0 | 19.8% |
| CIS | 128.3 | 96.5 | -24.8% | 420.8 | 339.9 | -19.2% |
| OTHERS | 1.4 | 13.4 | 837.6% | 3.8 | 33.4 | 785.2% |
| Grand Total | 9378.0 | 9504.5 | 1.3% | 27894.0 | 28905.9 | 3.6% |
Source: DGCI&S
Note: Myanmar has been included in ASEAN and not in South Asia, since ASEAN is a formal economic grouping.
REGION WISE INDIA’SENGINEERING EXPORTS
In this section we look at the Engineering Panel wise exports for the month of June 2025 vis-à-vis June 2024 as well as the cumulative exports for April-June 2025-26 vis-à-vis April-June 2024-25. These are indicated in the tables below.
Source: DGCI&S
Table 4: Panel-wise Export Analysis for April-June 2025-26 vis-à-vis April-June 2024-25
| Product panels | June 2024 | June 2025 | Growth (%) | April-June 2024-25 | April-June 2025-26 | Growth (%) |
|---|---|---|---|---|---|---|
| Ferrous | ||||||
| Iron and Steel | 755.6 | 770.7 | 2% | 2347.7 | 2395.2 | 2% |
| Products of Iron and Steel | 778.1 | 841.6 | 8% | 2329.4 | 2489.5 | 7% |
| Sub Total | 1533.7 | 1612.3 | 5% | 4677.1 | 4884.7 | 4% |
| Non-ferrous | ||||||
| Copper and products | 156.3 | 186.5 | 19% | 443.4 | 559.8 | 26% |
| Aluminium and products | 593.2 | 450.5 | -24% | 1720.8 | 1484.4 | -14% |
| Zinc and products | 45.3 | 45.0 | -1% | 195.7 | 152.3 | -22% |
| Nickel and products | 16.9 | 12.4 | -27% | 42.3 | 38.9 | -8% |
| Lead and products | 77.7 | 94.2 | 21% | 225.2 | 251.9 | 12% |
| Tin and products | 1.1 | 2.2 | 100% | 4.6 | 6.2 | 34% |
| Other Non-Ferrous Metals | 70.0 | 88.9 | 27% | 199.4 | 258.2 | 29% |
| Sub Total | 960.5 | 879.8 | -8% | 2831.5 | 2751.7 | -2.8% |
| Industrial Machinery | ||||||
| Industrial Machinery like Boilers, parts, etc. | 67.4 | 58.3 | -14% | 187.3 | 237.7 | 27% |
| IC Engines and Parts | 300.7 | 347.6 | 16% | 889.9 | 1038.7 | 17% |
| Pumps of all types | 127.5 | 132.1 | 4% | 362.4 | 380.1 | 5% |
| Air condition and Refrigerators | 149.1 | 184.5 | 24% | 432.9 | 561.2 | 30% |
| Industrial Machinery for dairy, food processing, textiles etc. | 677.3 | 693.4 | 2% | 2036.9 | 2151.4 | 6% |
| Machine Tools | 72.2 | 67.3 | -7% | 200.7 | 196.2 | -2% |
| Machinery for Injecting moulding, valves and ATMs | 224.8 | 259.2 | 15% | 664.9 | 751.7 | 13% |
| Sub Total | 1619.0 | 1742.4 | 8% | 4775.0 | 5317.0 | 11% |
| Electrical Machinery | ||||||
| Electrical Machinery | 1232.6 | 1306.4 | 6% | 3402.3 | 3800.0 | 12% |
| Automobile and auto component | ||||||
| Motor Vehicle/cars | 784.4 | 817.4 | 4% | 2111.0 | 2499.5 | 18% |
| Two and Three Wheelers | 240.1 | 306.6 | 28% | 757.0 | 868.7 | 15% |
| Auto Components/Part | 685.0 | 704.9 | 3% | 2000.2 | 2088.9 | 4% |
| Auto Tyres and Tubes | 242.0 | 261.0 | 8% | 776.7 | 801.1 | 3% |
| Sub Total | 1951.6 | 2089.9 | 7% | 5644.9 | 6258.2 | 10.9% |
| Miscellaneous engineering products | ||||||
| Medical and Scientific instruments | 215.7 | 227.9 | 6% | 618.2 | 704.2 | 14% |
| Railway Transport | 24.6 | 38.5 | 57% | 77.6 | 101.8 | 31% |
| Hand Tools & Cutting Tools | 79.4 | 84.7 | 7% | 240.0 | 262.4 | 9% |
| Bicycle & Parts | 29.3 | 35.3 | 20% | 90.9 | 111.9 | 23% |
| Cranes Lifts & Winches | 91.8 | 94.5 | 3% | 279.2 | 269.9 | -3% |
| Office Equipment | 23.4 | 33.1 | 41% | 66.0 | 89.3 | 35% |
| Other Construction Machinery | 239.7 | 254.8 | 6% | 747.6 | 835.3 | 12% |
| Prime Mica & Mica Products | 1.9 | 2.6 | 37% | 6.7 | 8.9 | 32% |
| Project Goods | 0.0 | 0.1 | 140% | 0.3 | 0.2 | -19% |
| Other Rubber Product Except Footwear | 143.4 | 151.9 | 6% | 428.7 | 460.2 | 7% |
| Other Misc. Items | 376.5 | 434.6 | 15% | 1224.8 | 1373.3 | 12% |
| Sub total | 1082.2 | 1205.9 | 11% | 3351.0 | 3756.9 | 12% |
| Total engineering exports | 9378.0 | 9504.5 | 1.3% | 27894.0 | 28905.9 | 3.63% |
Source: DGCI&S
Reasons for Decline (As per April-June 2025-26)
Aluminium
- Aluminium exports continue to decline in June 2025 cumulative decline in the first three months of the current fiscal was around 14%.
- Decline in exports to China by almost 42%. This is mainly due to decline in Chinese demand. As per China’s trade statistics, China’s import of aluminium and its products declined by almost 84% between April-June 2024 and April-June 2025
- While China is the largest producer of aluminium globally and there is significant downstream demand. However, recently China’s production has been increasing. According to Shanghai metals Market from 2004 to 2024, China’s aluminium production increased sixfold to reach 44 million mt/year by 2025.
- Decline in exports to the ASEAN region (-26%) due to mainly decline in exports to Vietnam, Malaysia and Indonesia. The decline in ASEAN can be explained by rising aluminium production capacity in the region - Indonesia is focussing on expanding its overall capacity and supply chain. As of 2025, Indonesia has 11 alumina projects under construction or planned, with a total capacity of 25.5 million mt. Other such investments in both alumina and aluminium projects are being planned. On the other hand Malaysia is focusing on expanding its smelting capacity. Also, changes in policy in China towards green production process, scrap generation is also increasing in ASEAN
- Significant decline was also noted in Russia (-92%) and Turkey (-71.9%) and EU (-10.1%) mainly due to the ongoing geopolitical conflicts and related logistical issues in the Middle East and West Asia region.
- The decline in Bangladesh (-25%) is mainly due to export restrictions put by both countries
- Another major reason behind India’s falling aluminium exports is the rising domestic demand – as per latest report, India’s domestic aluminium demand experienced a growth, especially in the secondary aluminium sector prices rose due to growing demand and inadequate supply
Zinc
- The decline in Zinc exports is primarily due to global supply exceeding demand. As per the International Lead and Zinc Study Group, the global market for refined zinc metal was in surplus by 151kt over the first four months of 2025
- Decrease in usage of refined zinc metal was noticed in Brazil, Germany, South Korea, Turkey and USA. While there was some increase in demand from China, France and India. However, China’s net imports of refined zinc metal totalled 120kt, a reduction of 19kt compared to the first four months of 2024
- As mentioned above there is also substantial domestic demand
Nickel
- The decline in India’s Nickel exports is mainly due to rising domestic demand especially in the EV and renewable sector and also rising geopolitical tensions affecting exports to CIS region, Middle East and Europe. In the Eastern side increase in capacity in South East Asia has also affected India’s exports to the region
Table 5: Panel-wise shares in India’s total engineering exports during April-June 2025-26
| S. No | Product Panels | Apr'24 - June'24 (Share%) | Apr'25 - June'25 (Share %) |
|---|---|---|---|
| 1. Iron and Steel and Products made of Iron and Steel | |||
| A | Iron and Steel | 8.4% | 8% |
| B | Products of Iron and Steel | 8.4% | 9% |
| Sub Total | 16.8% | 16.9% | |
| 2. Non-Ferrous Metals and Products made of Non-Ferrous Metals | |||
| A | Copper and products | 1.6% | 2% |
| B | Aluminium and products | 6.2% | 5% |
| C | Zinc and products | 0.7% | 1% |
| D | Nickel and products | 0.2% | 0% |
| E | Lead and products | 0.8% | 1% |
| F | Tin and products | 0.0% | 0% |
| G | Other Non-Ferrous Metals | 0.7% | 1% |
| Sub Total | 10.2% | 9.5% | |
| 3. Industrial Machinery | |||
| A | Industrial Machinery like Boilers, parts, etc | 0.7% | 0.8% |
| B | IC Engines and Parts | 3.2% | 3.6% |
| C | Pumps of all types | 1.3% | 1.3% |
| D | Air condition and Refrigerators | 1.6% | 1.9% |
| E | Industrial Machinery for dairy, food processing , textiles etc | 7.3% | 7.4% |
| F | Machine Tools | 0.7% | 0.7% |
| G | Machinery for Injecting moulding, valves and ATMs | 2.4% | 2.6% |
| Sub Total | 17.1% | 18.4% | |
| 4. Electrical Machinery | |||
| Electrical Machinery | 12.2% | 13.1% | |
| 5. Automobiles | |||
| A | Motor Vehicle/cars | 7.6% | 8.6% |
| B | Two and Three Wheelers | 2.7% | 3.0% |
| C | Auto Components/Part | 7.2% | 7.2% |
| D | Auto Tyres and Tubes | 2.8% | 2.8% |
| Sub Total | 20.2% | 21.7% | |
| 6. Aircrafts and Spacecraft parts and products | |||
| Aircrafts and Spacecraft parts and products | 5.2% | 1.3% | |
| 7. Ships Boats and Floating products and parts | |||
| Ships Boats and Floating products and parts | 4.8% | 4.5% | |
| 8. Project Goods | |||
| Project Goods | 0% | 0% | |
| 9. Other Rubber Product Except Footwear | |||
| Other Rubber Product Except Footwear | 1.5% | 1.6% | |
| 10. Other engineering products | |||
| A | Medical and Scientific instruments | 2.2% | 2.4% |
| B | Railway Transport | 0.3% | 0.4% |
| C | Hand Tools & Cutting Tools | 0.9% | 0.9% |
| D | Bicycle & Parts | 0.3% | 0.4% |
| E | Cranes Lifts & Winches | 1.0% | 0.9% |
| F | Office Equipments | 0.2% | 0.3% |
| G | Other Construction Machinery | 2.7% | 2.9% |
| H | Prime Mica & Mica Products | 0.0% | 0.0% |
| I | Other Misc. Items | 4.4% | 4.8% |
| Sub total | 12% | 13.0% | |
| Total engineering exports | 100% | 100% | |
Source: DGCI&S
ENGINEERING EXPORTS STATE-WISE ANALYSIS
State wise engineering export performance- Data as on 2024-25
(Note: Current fiscal 2025-26 data not yet updated as per Niryat Portal)
The table below indicates the exports from top Indian states. It is evident from the table that almost 91.5% of India’s exports is contributed by the listed 12 states. Within this almost 50 percent of exports is done by Maharashtra, Tamil Nadu and Gujarat together.
Table 6: Top state wise engineering export performance – April-March 2024-25
| Top States | 2023-24 | 2024-25 | Growth% | %Share in India's Eng Export | Remark |
|---|---|---|---|---|---|
| Maharashtra | 22992.9 | 22546.4 | -1.9% | 19.7% | 91.5% share covered by top 12 states |
| Tamil Nadu | 16844.6 | 18108.6 | 7.5% | 15.8% | |
| Gujarat | 14753.3 | 16590.5 | 12.5% | 14.5% | |
| Telangana | 3458.0 | 7536.2 | 117.9% | 6.6% | |
| Karnataka | 6709.1 | 7277.3 | 8.5% | 6.3% | |
| Haryana | 6753.8 | 6764.5 | 0.2% | 5.9% | |
| Odisha | 7125.2 | 5910.1 | -17.1% | 5.2% | |
| Delhi | 4599.7 | 4684.5 | 1.8% | 4.1% | |
| Uttar Pradesh | 4117.9 | 4348.7 | 5.6% | 3.8% | |
| Andhra Pradesh | 4885.6 | 4319.4 | -11.6% | 3.8% | |
| West Bengal | 3134.8 | 3523.7 | 12.4% | 3.1% | |
| Rajasthan | 3405.3 | 3375.7 | -0.9% | 2.9% |
Source: NIRYAT portal
- Top 12 states constitute over 91.5 % of India’s engineering Exports. Once again, Karnataka maintained its 5th position, Telengana retained its 4th position, Odisha coming down to 7th position, West Bengal coming down to 11th position, while Rajasthan moving up to 12th position and Haryana remarkably moved up to 6th position during the fiscal April-March 2024-25 compared to the same period last fiscal.( as per estimates of Niryat Portal)
- Major negative growth witnessed in states like Maharashtra ( decline by 1.9%), Odisha, ( decline by 17.1%), Andhra Pradesh (decline by 11.6%) and Rajasthan (decline by 0.9%) during April- March 2024-25 compared to the same period last fiscal.
- Maharashtra being the highest state in terms of Engineering Goods exports ( constituting a share of 19.7%) is leading by US$4.44 billion from Tamil Nadu(Second Highest State) for the period of April-March 2024-25
CORRELATION BETWEEN MANUFACTURING PRODUCTION AND ENGINEERING EXPORTS
Engineering forms a considerable part of the broader manufacturing sector and the share of engineering production in overall manufacturing output is quite significant. As exports generally come from what is produced within a country, some correlation between manufacturing production growth and engineering export growth should exist. We briefly look at the trend in manufacturing growth as also engineering export growth to see if they move in tandem. It may be mentioned that manufacturing has 77.63% weightage in India’s industrial production.
Engineering export growth and manufacturing output growth moved in the same direction in as many as nine out of twelve months in each of the fiscal years 2019-20 and 2020-21. During fiscal 2021-22, engineering export growth and manufacturing growth moved in the same direction in seven out of twelve monthswhile in each of fiscal 2022-23 and 2023-24, as many as 10 out of 12 months saw engineering exports and manufacturing output moved in the same direction. In 2024-25, both moved in the same direction in eight out of 12 months.
The first month of fiscal 2025-26 saw engineering export growth surged to double digit while manufacturing growth decelerated. In May 2025 however, both decelerated. Engineering export growth turned negative and manufacturing output growth moderated.
The link between these two may not be established in one or two months, but a positive correlation may be seen if medium to long term trend is considered.
Table 7: Engineering exports growth vis-à-vis manufacturing growth from April 2022
| Months/ Year | Engg. Export Growth (%) | Manufacturing Growth (%) |
|---|---|---|
| April 2023 | -7.52 | 5.5 |
| May 2023 | -4.25 | 6.3 |
| June 2023 | -11.12 | 3.5 |
| July 2023 | -6.91 | 5.3 |
| August 2023 | 7.66 | 10.0 |
| September 2023 | 6.50 | 5.1 |
| October 2023 | 6.99 | 10.6 |
| November 2023 | -3.48 | 1.3 |
| December 2023 | 9.82 | 4.6 |
| January 2024 | 4.20 | 3.6 |
| February 2024 | 15.90 | 4.9 |
| March 2024 | 10.66 | 5.9 |
| April 2024 | -4.49 | 4.2 |
(Source: Department of Commerce and CSO)
| Months/ Year | Engg. Export Growth (%) | Manufacturing Growth (%) |
|---|---|---|
| May 2024 | 7.43 | 5.1 |
| June 2024 | 10.26 | 3.5 |
| July 2024 | 5.12 | 4.7 |
| August 2024 | 4.28 | 1.2 |
| September 2024 | 10.55 | 4.0 |
| October 2024 | 39.27 | 4.4 |
| November 2024 | 13.72 | 5.5 |
| December 2024 | 8.33 | 3.7 |
| January 2025 | 7.49 | 5.8 |
| February 2025 | -8.64 | 2.8 |
| March 2025 | -3.92 | 4.0 |
| April 2025 | 11.29 | 3.1 |
| May 2025 | -0.80 | 2.6 |
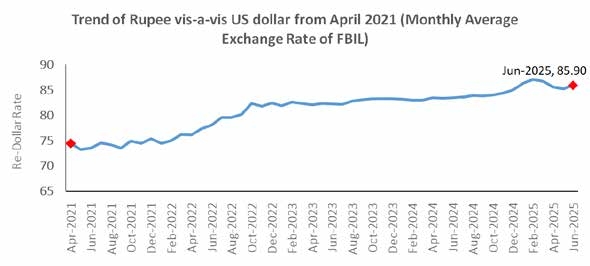
How did the exchange rate fare during June 2025 and what was the recent trend in Re-Dollar movement? In order to get a clearer picture of the recent Re-Dollar trend, not only we took the exchange rate of June 2025, but also considered monthly average exchange rate of Rupee vis-à-vis the US Dollar for each month of fiscal2023-24, 2024-25 and fiscal 2025-26 as per the latest data published, as mere one-month figure does not reflect any trend. The following two tables clearly depicts the short-term trend.
Table 8: USD-INR monthly average exchange rate in 2025-26 vis-à-vis 2024-25 (As per latest data released by FBIL)
| Monthly Average Exchange Rate (1 USD to INR) | Year-on-Year Change (%) | Direction | Month-on-Month Change (%) | Direction | ||
|---|---|---|---|---|---|---|
| Month | 2024-25 | 2025-26 | ||||
| April | 83.41 | 85.56 | 2.58 | Depreciation | -1.25 | Appreciation |
| May | 83.39 | 85.19 | 2.16 | Depreciation | -0.43 | Appreciation |
| June | 83.47 | 85.90 | 2.91 | Depreciation | 0.83 | Depreciation |
Rupee after two months, depreciated once again both on a monthly as well as yearly basis in June 2025: INR depreciated vis-àvis the US Dollar by 0.83 percent in June 2025 over the previous month as it dropped to below 86 per USD and weakened to USD 86.80. Surge in global crude oil prices following the geo-political tension in West Asia involving USA, strengthening of dollar and a weak domestic equity market pushed rupee down.
Outlook: Continuous geo-political tension and tariff threat by USA clouded the global socio-economic scenario and hence the outlook for rupee. A trend may be established once tariff stability is seen.
Table 9: USD-INR monthly average exchange rate in 2024-25 vis-à-vis 2023-24 (As per latest data released by FBIL)
| Monthly Average Exchange Rate (1 USD to INR) | Year-on-Year Change (%) | Direction | Month-on-Month Change (%) | Direction | ||
|---|---|---|---|---|---|---|
| Month | 2023-24 | 2024-25 | ||||
| April | 82.02 | 83.41 | 1.69 | Depreciation | 0.49 | Depreciation |
| May | 82.34 | 83.39 | 1.28 | Depreciation | -0.02 | Appreciation |
| June | 82.23 | 83.47 | 1.51 | Depreciation | 0.10 | Depreciation |
| July | 82.15 | 83.59 | 1.75 | Depreciation | 0.14 | Depreciation |
| August | 82.79 | 83.89 | 1.33 | Depreciation | 0.36 | Depreciation |
| September | 83.05 | 83.81 | 0.92 | Depreciation | -0.10 | Appreciation |
| October | 83.24 | 84.02 | 0.94 | Depreciation | 0.25 | Depreciation |
| November | 83.30 | 84.36 | 1.27 | Depreciation | 0.40 | Depreciation |
| December | 83.28 | 84.99 | 2.05 | Depreciation | 0.75 | Depreciation |
| January | 83.14 | 86.27 | 3.76 | Depreciation | 1.51 | Depreciation |
| February | 82.96 | 87.05 | 4.93 | Depreciation | 0.90 | Depreciation |
| March | 83.00 | 86.64 | 4.39 | Depreciation | -0.47 | Appreciation |
Fig 2: Trend of Rupee vis-a-vis US dollar from April 2021 (Monthly Average Rate of FBIL has been considered) (As per latest data released by FBIL)
Source: FBIL
ANALYSIS OF INDIA’S ENGINEERING IMPORTS
- India’s Engineering imports during June 2025 were valued at US$ 11.49 billion compared to US$ 11.94 billion in June 2024 registering a decline of 4 percent in dollar terms. In cumulative terms (Apr-Jun 2025), India’s imports increased by 6%
- In June 2025, imports declined for iron and steel, copper and its products, nickel, lead, tin, railway transport, hand tools, office equipment, aircraft, spacecraft and parts, etc.
- In June 2025, import decline was mainly noted from EU, North America, SSA, Latin America and Oceania. In cumulative terms too, import declined mainly happened from these regions
- The share of engineering imports in India’s total merchandise imports in Apr-June 2025 was estimated at 21.6 percent.
- 42.5% of India’s engineering imports come from N E Asia and 20% from the EU. The next major suppliers are ASEAN (13.1%), WANA (7.6%) and North America (6.8%)
Fig 3: Monthly Engineering Imports for April-June 2025-26 vis-a-vis April-June 2024-25
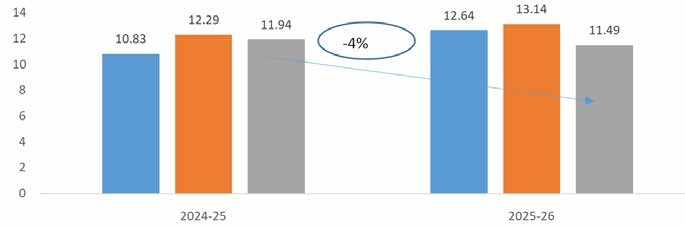
TREND IN ENGINEERING TRADE BALANCE
We now present the trend in two-way yearly trade for the engineering sector for the 2025-26 depicted in the table below:
Table 10: Monthly Trend in Engineering Trade Balance for the current FY 2025-26
| Trade Flow (US$ Billions) | Apr | May | June |
|---|---|---|---|
| Engineering Export | 9.5 | 9.9 | 9.5 |
| Engineering Import | 12.6 | 13.1 | 11.5 |
| Trade Balance | -3.1 | -3.2 | -2.0 |
CONCLUSION
After conceding a slight decline in the previous month, India’s engineering exports again recorded a growth of 1.35% in June 2025. It is important to note that during June 2025, India’s engineering imports conceded a decline of 4% mainly due to decline of imports of metals especially iron and steel, aircraft, spacecraft and parts, etc. The export growth was dented by the decline mainly in WANA, ASEAN, Other Europe, CIS and South Asia. The decline in WANA and CIS is mainly due to the geopolitical tensions still contuing in that area. The decline in Other Europe is mainly due to decline in trade relations with Turkey. Decline in South Asia is fuelled by trade restrictions imposed by Bangladesh. In terms of products major decline was witnessed in metals including aluminium, zinc and lead mainly fuelled by growing Chinese production and declining demand in China and rising domestic demand.
The landscape of international trade in July 2025 is a mix of policy shocks, regional realignments and modest recovery. As per the recent Global Trade Update by the UNCTAD, overall global trade growth was positive in the first half of 2025 with trade in goods registering a 1.5 percent growth. This gradual growth was despite the increasing trade policy uncertainty, ongoing geopolitical conflicts and a challenging global economic environment. This only indicates towards the dynamism in global trade in response to the changing scenario. In these circumstances, India has to adopt a cautious approach and support from the government will remain critical for further growth of the industry.

ANNEXURE-I
ENGINEERING PRODUCT PANELS – COUNTRY-WISE ANALYSIS
We now analyze the performance of some of the important products for the fiscal April-June 2025-26 vis-à-vis April-June 2024-25. We have taken the major panels and computed the top importers to get an idea of the current trade pattern.
Engineering Product Panel - Country matrix Value in USD million
| Product panels | Top 5 nations | April-June 2024-25 | April-June 2025-26 | Growth |
|---|---|---|---|---|
| Iron and Steel | Italy | 360.9 | 247.8 | -31% |
| USA | 89.9 | 244.7 | 172% | |
| Nepal | 159.5 | 193.2 | 21% | |
| Belgium | 147.2 | 169.0 | 15% | |
| UK | 140.4 | 128.4 | -9% | |
| Products of Iron and Steel | USA | 693.7 | 771.2 | 11% |
| UAE | 138.2 | 223.3 | 62% | |
| Germany | 110.3 | 117.4 | 6% | |
| Saudi Arab | 152.4 | 98.0 | -36% | |
| Canada | 70.0 | 75.7 | 8% | |
| Industrial Machinery | USA | 996.7 | 1157.3 | 16% |
| UAE | 214.1 | 299.9 | 40% | |
| Germany | 241.8 | 241.1 | 0% | |
| China | 241.1 | 216.1 | -10% | |
| Thailand | 190.3 | 206.3 | 8% | |
| Automobiles (Motor Vehicles/Cars and Two and Three Wheelers) | Saudi Arab | 405.6 | 388.8 | -4% |
| South Africa | 287.5 | 379.7 | 32% | |
| Mexico | 396.8 | 344.5 | -13% | |
| Japan | 153.3 | 212.1 | 38% | |
| UAE | 138.3 | 170.3 | 23% | |
| Non-Ferrous metals | USA | 350.5 | 434.9 | 24% |
| Korea RP | 242.8 | 272.9 | 12% | |
| Saudi Arab | 150.0 | 227.9 | 52% | |
| Taiwan | 65.9 | 119.3 | 81% | |
| Vietnam | 117.8 | 111.3 | -5% | |
| Electrical Machinery and Components | USA | 671.9 | 780.9 | 16% |
| U K | 304.0 | 429.3 | 41% | |
| Singapore | 372.5 | 405.9 | 9% | |
| Germany | 172.5 | 248.2 | 44% | |
| Korea RP | 165.5 | 227.2 | 37% | |
| Aircrafts and Space crafts | USA | 112.2 | 111.4 | -1% |
| France | 57.5 | 57.2 | 0% | |
| U K | 36.7 | 44.6 | 22% | |
| Germany | 19.3 | 24.9 | 29% | |
| Singapore | 12.7 | 24.1 | 91% | |
| Ships, Boats and Floating Structures and parts | Singapore | 263.9 | 555.5 | 110% |
| UAE | 562.5 | 426.8 | -24% | |
| Sri Lanka | 55.2 | 64.2 | 16% | |
| Oman | 0.1 | 54.3 | 98253% | |
| Togo | 0.0 | 46.8 | -- | |
| Auto Components (including Auto Parts and Auto Tyre) | USA | 592.3 | 585.1 | -1% |
| Germany | 157.0 | 188.7 | 20% | |
| Brazil | 155.7 | 183.0 | 18% | |
| Bangladesh | 100.6 | 127.9 | 27% | |
| UAE | 83.7 | 126.2 | 51% |
- In April-June 2025, Italy, USA and Nepal ranked as the top three importers of Indian Iron and Steel, while the USA, UAE and Germany lead in import of products of Iron & Steel.
- The USA stood out as the primary importer of Indian ‘Industrial machinery,’ making up 22% of India’s global exports in this category, followed by UAE and Germany with 6% ad 5% shares, respectively.
- Saudi Arabia, South Africa, Mexico, Japan and UAE were top importers of India’s Automobiles during April-June 2025 in India’s global exports respectively over the same period previous fiscal.
- USA, South Korea, Saudi Arab and Taiwan were the top importers of India’s Non-ferrous metals and products during April-June 2025.
- USA, UK, Singaporeand Germany were the top importers of Indian Electrical Machinery & Components during the same period with 21%, 11%, 11% and 7% shares respectively.
- USA, France,UK, Germany and Singapore were the top importers of India’s Aircrafts and Spacecraft during April-June 2025, making up to 69% of India’s total export of Aircrafts and Spacecraft
- Singapore, UAE and Sri Lanka became the largest importer of ships, boats and floating structures followed by Oman and Togo.
- For the auto components’ product group, USA remained the top importer in April-June 2025 followed by Germany, Brazil, Bangladesh and UAE, making up to 42% of India’s total export under this category.


© Copyright , All rights reserved. Design by Andreal