


VOL. 18, ISSUE NO. 1 | April 2025
Oversight


ENGINEERING TRADE ANALYSIS
FOR FEBRUARY 2025
| Trade Flow | Export figures (in US$ billion) | Growth (%) | ||||
| Feb-2024 | Feb-2025 | Apr - Feb 2023-24 | Apr - Feb 2024-25 | Feb-2025 over Feb-2024 | Apr-Feb 2024-25 over Apr-Feb 2023-24 | |
| Engineering exports | 9.94 | 9.08 | 98.03 | 105.85 | -8.62% | 7.97% |
| Overall merchandise exports | 41.41 | 36.91 | 395.38 | 395.63 | -10.85% | 0.06% |
| Share of engineering (%) | 24.00% | 24.61% | 24.79% | 26.75% | --- | --- |
| Service Exports | 28.33 | 35.03 | 311.05 | 354.90 | 23.65% | 14.10% |
Source: Compiled from data by DGCI&S and Quick Estimates published by the Government of India.
The nine-month long growth run of India’s engineering exports cane to a halt in February 2025 with a decline in monthly shipment for the first time after April 2024 on a year-on-year basis. During February 2025, engineering exports from India was recorded at USD 9,082.61 million as against a higher USD 9,938.92 million in the same month last fiscal, conceding 8.62 percent decline. Cumulative growth as a consequence has also moderated to 7.97% but the possibility of achieving a new all-time high engineering exports in 2024-25 is almost certain.The year-on-year decline in February 2025 was mainly driven by 58 percent decline in exports of Aluminium and Products and 40 percent decline in exports of Iron and Steel.Exports of ‘Ships, Boats and Floating Structures’ and ‘Aircraft, spacecrafts and parts’also recorded noticeable decline in year-on-year exports during February 2025. Among the destination regions, significant year-on-year decline in shipments was witnessed in ASEAN, EU and North-East Asia while exports to WANA and Latin America also declined in February 2025. Exports to South Asia, Sub-Saharan Africa, CIS and North America however managed decent growth over February 2024.
HIGHLIGHTS
- After a nine-month long stretch of growth run, Indian engineering exports declinedin February 2025 on a year-on-year basis, the second monthly decline in this fiscal after April 2024. February 2025 saw engineering exports dropped to USD 9,082.61 million from USD 9,938.92milion in the same month last fiscal, conceding a decline of 8.62 percent.
- On a cumulative basishowever, engineering exports is on the growth path. During April-February 2024-25, engineering exports stood at USD 105,845.12 million as against USD 98,034.28 million during the same period of the last fiscal, registering agrowth of 7.97 percent.
- According to the Quick Estimates of Department of Commerce, Government of India, share of engineering in India’s total merchandise exports was recorded at24.61 percent in February 2025 as against 25.86 percent in January 2025. On a cumulative basis, the sharewas recorded at 26.75 percent during April-February 2024-25.
- In February 2025, 21 out of 34 engineering panels witnessed positive year-on-year growth. While 13 engineering panels including mainly Iron and Steel and products, Copper, Aluminium and Tin products,Auto components and parts, Aircrafts and Spacecrafts, Ship and Boats, etc witness decline in exports during February 2025 vis-à-vis February 2024.
- On a cumulative basis, 28 out of 34 engineering panels recorded positive growth and remaining 6 engineering panels including Iron and Steel, some non-ferrous sectors including Copper, Aluminium and Zinc products, Office Equipment and Mica Products recorded negative growth during April-February 2024-25.
- Region wise, North America maintained itsspot as the number one export destination with a share of 20.4% followed by EU (17.2%) and WANA (16.8%) in February 2025. Significant export growth was noted in South Asia (25.1%), SSA (9.7 %), Other Europe (5.5%), in February 2025. In cumulative terms, all regions experienced growth barring Oceania (-11.3%) and EU (-0.2%).
- Country-wise, USA remained the top destinations followed by UAE and Saudi Arabia in February 2025 while maximum increase was noted in France (67%), UAE (37.9%) andUK (31.9%).
- In cumulative terms too USA remained the number one destination. Significant export growth was noted in UAE, Sinagpore, Nepal, Japan and France.

Overall Engineering Exports vs Engineering Exports Excluding Steel Segment (Values in USD Million)
| Trade Flow | Export in Feb 2024 | Exports in Feb 2025 | Growth (%) | Exports in Apr–Feb 2023-24 | Exports in Apr–Feb 2024-25 | Growth (%) |
|---|---|---|---|---|---|---|
| Overall engineering exports | 9938.92 | 9082.61 | -8.62 | 98034.28 | 105845.12 | 7.97 |
| Engineering exports excluding Iron and Steel | 8783.38 | 8393.89 | -4.43 | 87332.25 | 97404.19 | 11.53 |
Source: DGCI&S, Govt. of India
ENGINEERING EXPORTS: MONTHLY TREND
OBSERVATIONS: Excluding the export of iron and steel, engineering exports recorded a lower year-on-yeardeclineon a monthly and a higher year-on-year growth on a cumulative basis as exports of Iron and Steel declined substantially on both estimates. In February 2025,exports of Iron and Steel declined by 40 percent while on a cumulative basis, the decline was 21.1 percent year-on-year. Drop in Iron and Steel exports adversely impacted the overall engineering exports by around 4 percent.
The monthly engineering figures for 2024-25 vis-à-vis 2023-24 are shown below as per the latest DGCI&S estimates:

| Month | 2023-24 | 2024-25 | Growth (%) |
|---|---|---|---|
| April | 8949.36 | 8547.86 | -4.49 |
| May | 9300.62 | 9991.25 | 7.43 |
| June | 8515.72 | 9389.75 | 10.26 |
| April–June | 26765.71 | 27928.87 | 4.35 |
| July | 8720.30 | 9166.47 | 5.12 |
| August | 9048.65 | 9435.53 | 4.28 |
| September | 8886.54 | 9824.32 | 10.55 |
| July–September | 26655.49 | 28426.32 | 6.64 |
| October | 8078.48 | 11251.17 | 39.27 |
| November | 7822.25 | 8895.53 | 13.72 |
| December | 10007.56 | 10840.80 | 8.33 |
| October–December | 25908.29 | 30987.50 | 19.60 |
| January | 8765.87 | 9419.81 | 7.46 |
| February | 9938.92 | 9082.61 | -8.62 |
| April–February | 98034.28 | 105845.12 | 7.97 |
Source: DGCI&S, Govt. of India
TOP 25 ENGINEERING EXPORT DESTINATIONS IN FEBRUARY 2025
We now look at the export scenario of the top 25 nations that had highest demand for Indian engineering products during February 2025 over February 2024 as well as in cumulative terms during April-February 2024-25 vis-à-vis April-February 2023-24. The data clearly shows that top 25 countries contribute 75.2% of total engineering exports.Table 2: Engineering exports country-wise (Values in US$ million)
| Country | Feb-24 | Feb-25 | Growth (%) | Apr23 - Feb24 | Apr24 - Feb25 | Growth (%) |
|---|---|---|---|---|---|---|
| U S A | 1569.50 | 1660.79 | 5.8% | 15952.4 | 17271.8 | 8.3% |
| UAE | 499.14 | 688.18 | 37.9% | 5226.5 | 7560.8 | 44.7% |
| SAUDI ARABIA | 591.49 | 323.26 | -45.3% | 4627.9 | 5184.0 | 12.0% |
| SINGAPORE | 392.28 | 198.64 | -49.4% | 3048.2 | 4134.6 | 35.6% |
| GERMANY | 366.26 | 340.28 | -7.1% | 3739.6 | 3832.6 | 2.5% |
| U K | 246.20 | 324.74 | 31.9% | 3269.2 | 3583.4 | 9.6% |
| MEXICO | 311.31 | 275.97 | -11.4% | 2949.0 | 3221.7 | 9.2% |
| TURKEY | 229.35 | 183.00 | -20.2% | 2503.7 | 2779.4 | 11.0% |
| ITALY | 478.40 | 240.95 | -49.6% | 3153.8 | 2727.4 | -22.5% |
| CHINA | 233.96 | 207.45 | -11.4% | 2385.0 | 2451.3 | 2.8% |
| KOREA RP | 330.44 | 224.95 | -31.9% | 2535.7 | 2335.0 | -7.9% |
| SOUTH AFRICA | 146.91 | 184.27 | 25.4% | 1940.2 | 2292.5 | 18.2% |
| FRANCE | 129.43 | 216.10 | 67.0% | 1810.3 | 2288.2 | 26.4% |
| JAPAN | 211.71 | 239.36 | 13.1% | 1759.7 | 2226.3 | 26.5% |
| NEPAL | 147.54 | 179.47 | 21.6% | 1901.4 | 2029.0 | 6.7% |
| BRAZIL | 202.95 | 175.94 | -13.3% | 1885.4 | 2021.2 | 7.2% |
| BANGLADESH | 162.24 | 202.15 | 24.6% | 1968.7 | 1972.8 | 0.2% |
| THAILAND | 152.20 | 168.51 | 10.7% | 1701.1 | 1823.5 | 7.2% |
| INDONESIA | 136.67 | 122.44 | -10.4% | 2216.0 | 1808.2 | -18.4% |
| NETHERLAND | 164.23 | 152.08 | -7.4% | 1723.0 | 1733.0 | 0.6% |
| MALAYSIA | 271.75 | 80.93 | -70.2% | 1900.8 | 1331.4 | -30.0% |
| VIETNAM | 152.22 | 98.99 | -35.0% | 1162.3 | 1296.0 | 11.5% |
| SPAIN | 201.49 | 97.59 | -51.6% | 1441.2 | 1273.3 | -11.7% |
| BELGIUM | 171.50 | 97.44 | -43.2% | 1543.9 | 1254.1 | -18.8% |
| RUSSIA | 120.12 | 108.97 | -9.3% | 1224.1 | 1149.4 | -6.1% |
| Total engineering exports to the top 25 countries | 7631.68 | 6792.41 | -11.0% | 73934.81 | 79592.94 | 7.7% |
| India's total engineering exports | 9938.92 | 9082.61 | -8.6% | 98034.3 | 105845.1 | 8.0% |
| Share % of Top 25 destinations | 76.8% | 74.8% | 75.4% | 75.2% |
Source: DGCI&S
REGION WISE INDIA’S ENGINEERING EXPORTS
The following table depicts region wise India’s engineering exports for April-February 2025 as compared to April-February 2024
Table 3: Region wise engineering exports in April-February 2024-25 vis-à-vis April-February 2023-24
| Region | Feb-24 | Feb-25 | Growth (%) | Apr’23 - Feb’24 | Apr’24 - Feb’25 | Growth (%) |
|---|---|---|---|---|---|---|
| NORTH AMERICA | 1992.47 | 2033.54 | 2.1% | 19987.13 | 21606.41 | 8.1% |
| EUROPEAN UNION | 2008.45 | 1614.71 | -19.6% | 18225.23 | 18180.24 | -0.2% |
| WANA | 1585.91 | 1476.92 | -6.9% | 14624.06 | 17748.04 | 21.4% |
| ASEAN | 1174.82 | 731.67 | -37.7% | 10757.89 | 11249.90 | 4.6% |
| N E ASIA | 863.25 | 766.20 | -11.2% | 7508.67 | 7919.49 | 5.5% |
| SSA (Sub Saharan Africa) | 617.04 | 677.00 | 9.7% | 7181.00 | 7880.08 | 9.7% |
| OTHER EUROPE | 502.24 | 529.84 | 5.5% | 6092.76 | 6827.97 | 12.1% |
| SOUTH ASIA | 424.42 | 531.02 | 25.1% | 5506.89 | 5873.32 | 6.7% |
| LATIN AMERICA | 503.90 | 465.50 | -7.6% | 5245.71 | 5584.01 | 6.4% |
| CIS | 143.20 | 150.12 | 4.8% | 1483.36 | 1633.78 | 10.1% |
| OCEANIA | 120.37 | 97.83 | -18.7% | 1398.25 | 1231.67 | -11.9% |
| OTHERS | 2.85 | 8.26 | 189.5% | 23.35 | 60.21 | 157.9% |
| Grand Total | 9938.92 | 9082.61 | -8.6% | 98034.28 | 105845.12 | 8.0% |
Source: DGCI&S
Note: Myanmar has been included in ASEAN and not in South Asia, since ASEAN is a formal economic grouping.
In this section we look at the Engineering Panel wise exports for the month of February 2025 vis-à-vis February 2024 as well as the cumulative exports for April-February 2024-25 vis-à-vis April-February 2023-24. These are indicated in the tables below.
| Product panels | February 2024 | February 2025 | Growth (%) | April–February 2023–24 | April–February 2024–25 | Growth (%) |
|---|---|---|---|---|---|---|
| Ferrous | ||||||
| Iron and Steel | 1155.54 | 688.72 | -40.4% | 10702.0 | 8440.9 | -21.1% |
| Products of Iron and Steel | 867.87 | 831.48 | -4.2% | 8988.1 | 9135.2 | 2% |
| Sub Total | 2023.4 | 1520.2 | -25% | 19600.1 | 17576.2 | -10% |
| Non-ferrous | ||||||
| Copper and products | 225.1 | 171.7 | -24% | 2283.1 | 2115.4 | -7% |
| Aluminium and products | 1175.0 | 494.7 | -58% | 7103.5 | 6235.2 | -12% |
| Zinc and products | 42.5 | 57.9 | 36% | 680.5 | 675.9 | -1% |
| Nickel and products | 10.3 | 16.5 | 60% | 147.1 | 169.4 | 15% |
| Lead and products | 78.1 | 93.5 | 20% | 679.4 | 836.7 | 23% |
| Tin and products | 1.5 | 1.0 | -32% | 6.1 | 8.0 | 31% |
| Other Non-Ferrous Metals | 68.3 | 71.1 | 4% | 677.7 | 784.6 | 16% |
| Sub Total | 1600.8 | 906.4 | -43% | 11585.5 | 10836.6 | -6% |
| Industrial Machinery | ||||||
| Industrial Machinery like Boilers, parts, etc. | 74.3 | 73.6 | -1% | 657.2 | 750.4 | 14% |
| IC Engines and Parts | 305.9 | 344.2 | 13% | 3298.5 | 3485.2 | 6% |
| Pumps of all types | 114.0 | 124.2 | 9% | 1230.1 | 1407.2 | 14% |
| Air condition and Refrigerators | 149.8 | 164.4 | 10% | 1537.9 | 1746.1 | 13% |
| Industrial Machinery for dairy, food processing, textiles etc. | 658.8 | 687.2 | 4% | 7247.0 | 7461.3 | 3% |
| Machine Tools | 71.8 | 72.3 | 1% | 708.5 | 724.4 | 2% |
| Machinery for injecting, moulding, valves and ATMs | 229.3 | 241.9 | 6% | 2270.4 | 2557.0 | 13% |
| Sub Total | 1603.7 | 1707.8 | 6% | 16949.7 | 18130.0 | 7% |
| Electrical Machinery | ||||||
| Electrical Machinery | 979.7 | 1224.3 | 25% | 11169.2 | 12997.2 | 16% |
| Automobile and auto component | ||||||
| Motor Vehicle/cars | 600.6 | 717.2 | 19% | 7512.9 | 8093.2 | 8% |
| Two and Three Wheelers | 264.0 | 266.0 | 1% | 2469.9 | 2930.2 | 18% |
| Auto Components/Part | 676.1 | 656.2 | -3% | 6964.5 | 7399.4 | 6% |
| Auto Tyres and Tubes | 270.4 | 234.0 | -13% | 2056.7 | 2781.4 | 35% |
| Sub Total | 1811.5 | 1873.9 | 3% | 19555.3 | 21177.2 | 8.3% |
| Aircrafts and related products | ||||||
| Aircrafts and Spacecraft parts and products | 383.8 | 339.0 | -12% | 2348.5 | 6711.8 | 186% |
| Ships Boats and Floating products and parts | ||||||
| Ships Boats and Floating products and parts | 338.7 | 222.5 | -34% | 3583.6 | 4042.5 | 13% |
| Miscellaneous engineering products | ||||||
| Medical and Scientific instruments | 186.7 | 218.5 | 17% | 2181.6 | 2510.2 | 15% |
| Railway Transport | 18.1 | 22.2 | 23% | 291.0 | 329.0 | 13% |
| Hand Tools & Cutting Tools | 79.5 | 81.0 | 2% | 837.5 | 941.6 | 12% |
| Bicycle & Parts | 31.8 | 36.3 | 14% | 327.8 | 363.9 | 11% |
| Cranes Lifts & Winches | 90.9 | 84.8 | -7% | 948.0 | 980.0 | 3% |
| Office Equipment | 18.7 | 19.7 | 5% | 281.3 | 256.1 | -9% |
| Other Construction Machinery | 253.8 | 258.3 | 2% | 2701.3 | 2726.4 | 1% |
| Prime Mica & Mica Products | 2.6 | 2.2 | -18% | 33.8 | 28.1 | -17% |
| Project Goods | 0.2 | 5.8 | 3047% | 2.5 | 7.9 | 213% |
| Other Rubber Product Except Footwear | 140.9 | 136.8 | -3% | 1515.2 | 1606.8 | 6% |
| Other Misc. Items | 374.0 | 421.8 | 13% | 4124.0 | 4623.5 | 12% |
| Total engineering exports | 9938.9 | 9082.6 | -8.6% | 98034.3 | 105845.1 | 7.97% |
Reasons for Decline (As per April-February 2024-25):
1. Iron and Steel : Insights
- During April-February 2024-25, India’s exports of Iron and Steel deteriorated by 21% vis-à-vis same period last fiscal, while Products of Iron and Steel witnessed growth to the extent of 3% during the same period, after continuous decline for many months. However in the month of February 2025, both Iron and Steel as well as Products of Iron and Steel witnessed decline in exports to the extent of 40% and 4% respectively
- US Tariffs: The 25% tariffs imposed by the US on steel imports ( as per the proclamation order dated on 18th February 2025) have created a challenging environment for Indian steel exporters. Although India’s direct steel exports to the US are relatively low, the tariffs have led to increased global competition and price pressures. The tariffs have also resulted in a shift in trade flows.
- Market Sentiment and Trade Policies: Uncertainty around trade policies and potential trade wars has led to cautious buying behavior and delayed purchasing decisions. Protective measures by other countries, such as antidumping duties and safeguard measures, have also restricted India’s steel exports.
- Impact of US Tariffs on India’s Steel Exports: (i) While the direct impact of US tariffs on India’s steel exports is limited due to the low volume of exports to the US, the indirect effects are significant. The tariffs have led to increased global competition and price pressures, affecting India’s export competitiveness. (ii) On the other hand, India has proposed a 12% safeguard duty on a broad range of steel products to protect its domestic market from increased imports, This move aims to prevent a flood of cheap steel imports from disrupting the local industry. The safeguard duties will be in place for 200 days, pending a final decision. In this regard, EEPC India urges a balanced approach to safeguard duty to protect MSMEs and user industriesfrom potential price hikes and supply disruptions.
- Overall price scenario in various countries post imposition of US tariff:
- US: The US imposed a 25% tariff on all steel imports, which has significantly boosted domestic steel prices. Hot-rolled coil (HRC) prices soared, with the Midwest HRC price averaging $807 per short ton in February, up from $698 in January. The tariffs have led to increased demand for domestic steel, extending delivery lead times and pushing up prices further. (Source: SPG Platts Connet)
- China: The Chinese steel market experienced muted sentiment due to the US tariffs. Steel prices have remained relatively flat, with hot-rolled coil prices averaging 3,419 yuan per metric ton in February 2025. The tariffs have created uncertainty, leading to cautious buying behavior and concerns about a potential trade war.(Source: SPG Platts Connet)
- European Union: EU flat steel prices have risen due to expectations of tighter import quotas in response to the US tariffs and improving manufacturing activity. Northern EU flat steel prices reached a six-month high of €615 per metric ton in early March 2025. (Source: SPG Platts Connet)
- Turkey: Turkey’s scrap prices have strengthened due to higher US steel and scrap prices. However, slow rebar sales have capped further gains.
- India: The imposition of a 25% tariff on steel imports by the US has led to significant shifts in global trade flows, with Asian exporters redirecting shipments to India. This has increased import pressure on the Indian market, affecting domestic steel prices and earnings. Despite the minimal direct impact due to low export volumes to the US, the increased competition and price pressures from redirected shipments have led to fluctuations in India’s steel prices. For instance, hot-rolled coil (HRC) prices rose by 3% monthon-month in February 2025, driven by hopes of safeguard duties and reduced import volumes. (Source: BigMint).
2. Non- Ferrous Sector (Copper, Alumimnium and Zinc)
Copper:
- India’s growing copper demand and its position as a net importer in Copper: India’s copper demand has been on the rise driven by requirement of clean energy systems and increasing penetration of electric vehicles. The domestic demand for copper is expected to double by 2030. India has turned into a net importer of copper since the closure of Vedanta’s Sterlite copper plant in Tamil Nadu’s Tuticorin in 2018. The country’s demand for copper is also indicated by the fact that many new companies are venturing into copper production in India – for instance JSW now plans to set up its own smelter facility in Odisha with an investment of around 120 billion rupees and scale up the capacity to 1 million metric tons by 2033 or 34. The Adani Group has also set up a $1.2 billion copper smelter in Guajarat.
- Surplus in the global copper market: As per S&P Global’s forecast, the refined copper market is going to experience a surplus for 2025. Many new countries including non-producers such as Saudi Arabia are also joining the production trend. However, the copper concentrate market is expexted to face deficits due to scant supply. India is dependent on imports for its suppky of copper concentrates and there is a 2.5% tariff. The industry has urged the government to reduce the tariff to zero to facilitate import.
Aluminium:
- RODTEP benefit to SEZ units was only provided in October, November and December 2024 although the scheme was implemented from April 2024 for entire financial year. This is making exports unviable, and not competitive.
- Exports to USA are reducing year on year majorly because of not getting exemption from Section 232 duty, over and above not getting rodtep benefit for SEZ.
Zinc:
- As per latest reports, there is a global oversupply of Zinc which has also affected its global prices.
ENGINEERING EXPORTS STATE-WISE ANALYSIS
State wise engineering export performance
The table below indicates the exports from top Indian states. It is evident from the table that almost 94.7 % of India’s exports is contributed by the listed 12 states. Within this almost 56.5 percent of exports is done by Maharashtra, Tamil Nadu and Gujarat together.
Table 5:Top state wise engineering export performance – April-December 2024-25 (Values in USD Million)
| Top States | April–December 2023–24 | April–December 2024–25 | Growth % | % Share in India’s Eng Export | Remarks |
|---|---|---|---|---|---|
| Maharashtra | 16907.0 | 16570.0 | -2.0% | 22.1% | 94.7% share covered by top 12 states |
| Tamil Nadu | 12586.9 | 13340.9 | 6.0% | 17.8% | |
| Gujarat | 10703.9 | 12472.9 | 16.5% | 16.6% | |
| Telangana | 1703.7 | 6191.6 | 263.4% | 8.3% | |
| Karnataka | 4958.1 | 5270.7 | 6.3% | 7.0% | |
| Odisha | 4910.7 | 4407.2 | -10.3% | 5.9% | |
| Andhra Pradesh | 3671.9 | 3510.7 | -4.4% | 4.7% | |
| Uttar Pradesh | 3102.2 | 3211.1 | 3.5% | 4.3% | |
| West Bengal | 2349.3 | 2592.5 | 10.4% | 3.5% | |
| Madhya Pradesh | 1368.8 | 1448.2 | 5.8% | 1.9% | |
| Rajasthan | 2414.2 | 1046.5 | -56.7% | 1.4% | |
| Daman & Diu And Dadra & Nagar Haveli | 1108.1 | 938.5 | -15.3% | 1.3% |
Source: NIRYAT portal
- Top 12 states constitute over 94.7 % of India’s engineering Exports. Once again, Karnataka maintained its 5th position, Telengana retained its 4th position, Odisha maintaining its 6th position,while Daman and Diu moved up to 12th position and Haryana moved further down to 13th position during the fiscal April-December 2024-25 compared to the same period last fiscal.
- Major negative growth witnessed in states like Maharashtra, Odisha, Andhra Pradesh, Rajasthan and Daman and Diu during April-Dec 2024-25 compared to the same period last fiscal.
- Maharashtra being the highest state in terms of Engineering Goods exports ( constituting a share of 22.1%) is leading by US$ 3229.1 million from TamilNadu(Second Highest State) for the period of April-Dec 2024-25
INDIA’S REGION WISE ENGINEERING EXPORTS
In terms of region, western region which includes industrial states like Maharashtra and Gujarat is the front runner in terms of exports with 38.7 percent share. Tamil Nadu from the Southern Region has retained its export performance and it ranked second after Maharashtra, while Gujarat and Telengana ranked third and fourth during April-December 2024-25.
Note: The total engineering exports given in the above table is taken from NIRYAT as per the latest available data and may not tally with the total engineering exports as given by DGCI&S.(Data sourced from Niryat portal. It is to be noted that state figures for January 2025 not yet updated)
Table 6: Region wise exports from India(Values in USD Million)
| Region | April–Dec 2023–24 | April–Dec 2024–25 | Growth % |
|---|---|---|---|
| EASTERN REGION | 8651.2 | 8282.5 | -4.3% |
| NORTHERN REGION | 16713.3 | 5920.1 | -64.6% |
| SOUTHERN REGION | 23784.5 | 29053.9 | 22.2% |
| WESTERN REGION | 30350.6 | 31734.5 | 4.6% |
Source: NIRYAT portal
CORRELATION BETWEEN MANUFACTURING PRODUCTION AND ENGINEERING EXPORTS
Engineering forms a considerable part of the broader manufacturing sector and the share of engineering production in overall manufacturing output is quite significant. As exports generally come from what is produced within a country, some correlation between manufacturing production growth and engineering export growth should exist. We briefly look at the trend in manufacturing growth as also engineering export growth to see if they move in tandem. It may be mentioned that manufacturing has 77.63% weightage in India’s industrial production.
Engineering export growth and manufacturing output growth moved in the same direction in as many as nine out of twelve months in each of the fiscal years 2019-20 and 2020-21. During fiscal 2021-22, engineering export growth and manufacturing growth moved in the same direction in seven out of twelve monthswhile in each of fiscal 2022-23 and 2023-24, as many as 10 out of 12 months saw engineering exports and manufacturing output moved in the same direction.
The first two month of fiscal 2024-25 also saw manufacturing output growth and engineering exports growth moving in the same direction. April 2024 saw engineering exports declined from a growth in Mar 2024 and manufacturing output growth decelerated. The month of May 2024 witnessed just the opposite. Engineering exports bounced back to growth path and manufacturing output growth accelerated. Then June, July and August2024 however saw both moved in the opposite direction. June and August 2024 saw higher engineering export growth but lower manufacturing growth in comparison to the previous month while July 2024 just witnessed the reverse. September and October 2024 again saw both moving in the same direction by securing acceleration in growth. November 2024 however saw slowdown in engineering export growth but faster manufacturing growth vis-à-vis October 2024 while growth in both engineering exoports and manufacturing output moderated in December 2024. In January 2025 once again, the direction was opposite as engineering exports growth moderated against a faster manufacturing output growth.
The link between these two may not be established monthly, but a positive correlation may be seen if medium to long term trend is considered.
Table 7: Engineering exports growth vis-à-vis manufacturing growth from April 2022
| Months / Year | Engg. Export Growth (%) | Manufacturing Growth (%) |
|---|---|---|
| April 2023 | -7.52 | 5.5 |
| May 2023 | -4.25 | 6.3 |
| June 2023 | -11.12 | 3.5 |
| July 2023 | -6.91 | 5.3 |
| August 2023 | 7.66 | 10.0 |
| September 2023 | 6.50 | 5.1 |
| October 2023 | 6.99 | 10.6 |
| November 2023 | -3.48 | 1.3 |
| December 2023 | 9.82 | 4.6 |
| January 2024 | 4.20 | 3.6 |
| February 2024 | 15.90 | 4.9 |
(Source: Department of Commerce and CSO)

| Months / Year | Engg. Export Growth (%) | Manufacturing Growth (%) |
|---|---|---|
| March 2024 | 10.66 | 5.9 |
| April 2024 | -4.49 | 4.2 |
| May 2024 | 7.43 | 5.1 |
| June 2024 | 10.26 | 3.5 |
| July 2024 | 5.12 | 4.7 |
| August 2024 | 4.28 | 1.2 |
| September 2024 | 10.55 | 4.0 |
| October 2024 | 39.27 | 4.7 |
| November 2024 | 13.72 | 5.5 |
| December 2024 | 8.33 | 3.4 |
| January 2025 | 7.46 | 5.5 |
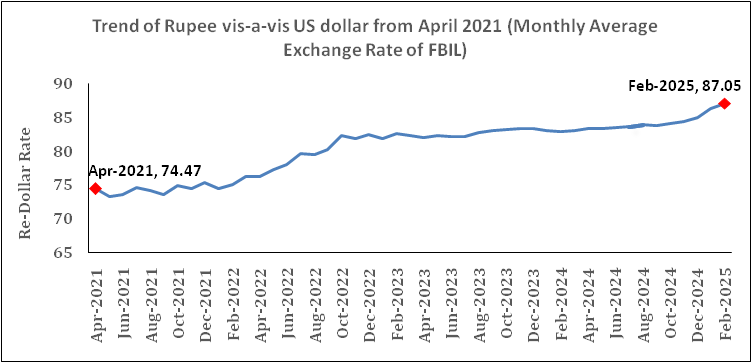
How did the exchange rate fare during February 2025 and what was the recent trend in Re-Dollar movement? In order to get a clearer picture of the recent Re-Dollar trend, not only we took the exchange rate of February 2025, but also considered monthly average exchange rate of Rupee vis-à-vis the US Dollar for each month of fiscal 2023-24 and 2024-25 till February 2025 as per the latest data published, as mere one-month figure does not reflect any trend. The following two tables clearly depicts the short-term trend:
Table 8: USD-INR monthly average exchange rate in 2024-25 vis-à-vis 2023-24 (As per latest data released by FBIL)
| Monthly Average Exchange Rate (1 USD to INR) | Change & Direction | |||||
|---|---|---|---|---|---|---|
| Month | 2023-24 | 2024-25 | Year-on-Year Change (%) | Direction | Month-on-Month Change (%) | Direction |
| April | 82.02 | 83.41 | 1.69 | Depreciation | 0.49 | Depreciation |
| May | 82.34 | 83.39 | 1.28 | Depreciation | -0.02 | Appreciation |
| June | 82.23 | 83.47 | 1.51 | Depreciation | 0.10 | Depreciation |
| July | 82.15 | 83.59 | 1.75 | Depreciation | 0.14 | Depreciation |
| August | 82.79 | 83.89 | 1.33 | Depreciation | 0.36 | Appreciation |
| September | 83.05 | 83.81 | 0.92 | Depreciation | -0.10 | Depreciation |
| October | 83.24 | 84.02 | 0.94 | Depreciation | 0.25 | Depreciation |
| November | 83.30 | 84.36 | 1.27 | Depreciation | 0.40 | Depreciation |
| December | 83.28 | 84.99 | 2.05 | Depreciation | 0.75 | Depreciation |
| January | 83.14 | 86.27 | 3.76 | Depreciation | 1.51 | Depreciation |
| February | 82.96 | 87.05 | 4.93 | Depreciation | 0.90 | Depreciation |
Rupee depreciated continued in February 2025: INR depreciated vis-à-vis the US Dollar by a higher 4.93 percent on a year-on-year basis in February 2025 in comparison to January 2025. On a month-on-month basis however, the depreciation was lower at 0.90 percent. Heavy FPI outflow from India,coupled with intensification of global trade war risks and uncertainty surrounding US trade policies led to the volatility in currency market and INR depreciation in February 2025. US Dollar gave upup some gains due to this global uncertainty. As per the RBI report in March 2025, Rupee is still less volatile among its ASEAN peers.
Outlook: The weakening of rupee vis-à-vis the US Dollar is apprehended to persist at least in the first few months of 2025 but the impact of US trade decision on global economy may change the scenario going forward.
Table 9: USD-INR monthly average exchange rate in 2023-24 vis-à-vis 2022-23 (As per latest data released by FBIL)
| Monthly Average Exchange Rate (1 USD to INR) | Change & Direction | |||||
|---|---|---|---|---|---|---|
| Month | 2022-23 | 2023-24 | Year-on-Year Change (%) | Direction | Month-on-Month Change (%) | Direction |
| April | 76.17 | 82.02 | 7.68 | Depreciation | -0.33 | Appreciation |
| May | 77.32 | 82.34 | 6.49 | Depreciation | 0.39 | Depreciation |
| June | 78.04 | 82.23 | 5.37 | Depreciation | -0.13 | Appreciation |
| July | 79.60 | 82.15 | 3.20 | Depreciation | -0.10 | Appreciation |
| August | 79.56 | 82.79 | 4.06 | Depreciation | 0.78 | Depreciation |
| September | 80.23 | 83.04 | 3.50 | Depreciation | 0.30 | Depreciation |
| October | 82.34 | 83.24 | 1.09 | Depreciation | 0.24 | Depreciation |
| November | 81.81 | 83.30 | 1.82 | Depreciation | 0.07 | Depreciation |
| December | 82.46 | 83.28 | 0.99 | Depreciation | -0.02 | Appreciation |
| January | 81.90 | 83.12 | 1.49 | Depreciation | -0.19 | Appreciation |
| February | 82.61 | 82.96 | 0.42 | Depreciation | -0.19 | Appreciation |
| March | 82.29 | 83.00 | 0.86 | Depreciation | 0.05 | Depreciation |
Fig 2: Trend of Rupee vis-a-vis US dollar from April 2020 (Monthly Average Rate of FBIL has been considered)
Source: FBIL

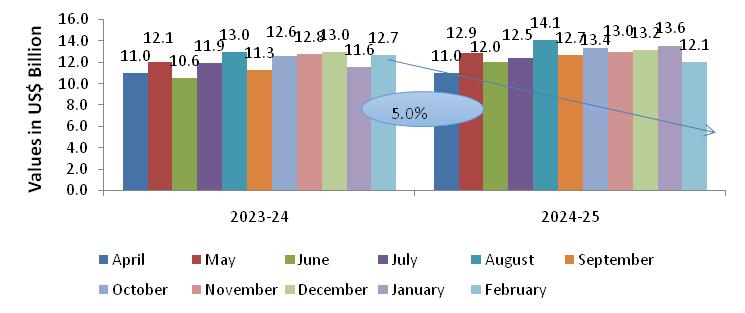
India’s Engineering imports during February 2025 were valued at US$12060.96million compared to US$ 12694.65million in February 2024 registering a negative growth of 5.0 percent in dollar terms. Sectors like Non-Ferrous Metals, Electrical Machinery &Medicinal & Pharmaceutical products witnessed a rise in import during February 2025 compared to February 2024 registering positive growth over the same period while Iron & Steel, Machine Tools, Transport Equipments&Professional instrument, Optical goods, etc. recorded a decline in growth during the same.
The share of engineering imports in India’s total merchandise imports in February 2025 was estimated at 23.7 percent, higher than that of February 2024 which was estimated at 20.8 %. The figure below depicts engineering imports for February 2025 compared to February 2024.
Table 10: India’s engineering imports in April-January 2024-25 vis-à-vis April-January 2023-24
| Values in US$ MN | February '23 | February '24 | Growth (%) | April-February '23 | April-February '24 | Growth (%) |
|---|---|---|---|---|---|---|
| India's Engineering Imports | 12694.65 | 12060.96 | -5.0% | 132684.1 | 140382.2 | 5.8% |
Source: Quick Estimates, MoC
Fig 3: Monthly Engineering Imports for April-February 2024-25 vis-a-vis April-February 2023-24
TREND IN ENGINEERING TRADE BALANCE
We now present the trend in two-way yearly trade for the engineering sector for the 2024-25 depicted in the table below:
Table 11: Monthly Trend in Engineering Trade Balance for the current FY 2024-25 (US$ Billions)
| Trade Flow | April | May | June | July | August | September | October | November | December | January | February |
|---|---|---|---|---|---|---|---|---|---|---|---|
| Engineering Export | 8.7 | 10.0 | 9.4 | 9.0 | 9.4 | 9.8 | 11.2 | 8.9 | 10.8 | 9.4 | 9.1 |
| Engineering Import | 11.0 | 12.9 | 12.0 | 12.5 | 14.1 | 12.7 | 13.4 | 13.0 | 13.2 | 13.6 | 12.1 |
| Trade Balance | -2.3 | -2.9 | -2.6 | -3.5 | -4.7 | -2.9 | -2.2 | -4.1 | -2.4 | -4.2 | -3.0 |
Source: DGCI&S, EEPC India Analysis
CONCLUSION
The tremendous performance of India’s engineering exports with a nine-month growth run came to a halt in February 2025. The decline in exports in febryary 2025 was 8.62% as it reached USD 9.08 billion. Cumulative growth as a consequence has also moderated to 7.97% but the possibility of achieving a new all-time high engineering exports in 2024-25 is almost certain. The decline was majorly due to fall in metal exports especially for iron and steel, aluminium and copper
The months of February and March of 2024-25 witnessed a major upheaval in the global trade – a result of the protective and retaliatory tariff measures adopted by the newly elected US President, Donald Trump. The Trump administration has threatened retaliatory tariffs on some of its major trade partners including China, Canada and Mexico. India has also not been spared as the President has called it a “High Tariff Nation”, reiterating the need for reciprocal tariffs which are to be effective from 2nd of April 2025. The industry is bracing itself for two different impacts in case the tariffs become effective: firstly the loss of US market which is also the largest engineering export destination for India. Secondly, trade diversion that may happen due to this from China, Japan, South Korea or South East Asian nations.
Globally, trade experts are looking for way out of the on-going trade uncertainty. A recent report published by researchers in the London School of Economics indicated how recent US trade policies along with growing uncertainty fuelled by ongoing geopolitical disputes may bring significant economic and financial market disruptions. In India too, there is a need to diversify our export destinations and at the same time work out an agreement with the US which can lessen the impact of the above mentioned tariff. The Government of India is already on the right track in terms of diversifications as it signed new FTAs with UAE and Australia. New FTAs are also being negotiated with EU, UK and GCC. More such FTAs are required in Latin America and Africa. At the same time to protect our market in the US, Government of India is also contemplating a Bilateral Trade Agreement with the US. This is also a very significant step and we are hopeful that if implemented, this would go a long way in protecting our global markets.

ENGINEERING PRODUCT PANELS – COUNTRY-WISE ANALYSIS
We now analyze the performance of some of the important products for the fiscal April-February 2024-25 vis-à-vis April-February 2023-24. We have taken the major panels and computed the top importers to get an idea of the current trade pattern.
Engineering Product Panel - Country matrix(US$ Billions)
| Product panels | Top 5 nations | April–February 2023-24 | April–February 2024-25 | Growth |
|---|---|---|---|---|
| Iron and Steel | Italy | 1720.1 | 984.9 | -43% |
| Nepal | 709.7 | 707.7 | 0% | |
| UAE | 587.5 | 627.0 | 7% | |
| USA | 449.1 | 516.7 | 15% | |
| UK | 328.4 | 481.7 | 47% | |
| Products of Iron and Steel | USA | 2536.1 | 2790.1 | 10% |
| UAE | 525.9 | 775.4 | 47% | |
| Saudi Arab | 484.4 | 523.7 | 8% | |
| Germany | 402.9 | 418.6 | 4% | |
| UK | 323.1 | 312.9 | -3% | |
| Industrial Machinery | USA | 3368.6 | 3790.5 | 13% |
| UAE | 735.7 | 885.3 | 20% | |
| Germany | 924.0 | 803.4 | -13% | |
| China | 636.4 | 784.5 | 23% | |
| Thailand | 716.4 | 705.6 | -2% | |
| Automobiles (Motor Vehicles/Cars and Two and Three Wheelers) | USA | 3368.6 | 3790.5 | 13% |
| UAE | 735.7 | 885.3 | 20% | |
| Germany | 924.0 | 803.4 | -13% | |
| China | 636.4 | 784.5 | 23% | |
| Thailand | 716.4 | 705.6 | -2% | |
| Non-Ferrous metals | USA | 1362.9 | 1360.7 | 0% |
| Korea RP | 1186.8 | 881.9 | -26% | |
| Turkey | 164.1 | 709.3 | 332% | |
| Saudi Arab | 1065.2 | 690.8 | -35% | |
| China | 604.4 | 567.9 | -6% | |
| Electrical Machinery and Components | USA | 2127.2 | 2469.9 | 16% |
| Singapore | 900.0 | 1405.4 | 56% | |
| UK | 900.9 | 1047.7 | 16% | |
| Germany | 676.8 | 886.0 | 31% | |
| Korea RP | 418.1 | 601.3 | 44% | |
| UAE | 254.9 | 1641.5 | 544% | |
| Aircrafts and Space crafts | Saudi Arab | 331.0 | 1113.8 | 236% |
| France | 182.5 | 720.4 | 295% | |
| USA | 451.6 | 403.9 | -11% | |
| Czech Republic | 3.9 | 353.3 | 9012% | |
| Singapore | 953.6 | 1707.0 | 79% | |
| Ships, Boats and Floating Structures and parts | UAE | 890.3 | 1030.3 | 16% |
| Indonesia | 569.3 | 306.4 | -46% | |
| USA | 52.9 | 306.4 | 479% | |
| Sri Lanka | 346.8 | 236.6 | -32% | |
| Singapore | 953.6 | 1707.0 | 79% | |
| Auto Components (Including Auto Parts and Auto Tyre) | USA | 2146.7 | 2141.5 | -1% |
| Brazil | 459.7 | 551.1 | 20% | |
| Germany | 531.3 | 546.8 | 3% | |
| Turkey | 532.7 | 447.4 | -16% | |
| Mexico | 403.6 | 444.1 | 10% |
- In April-February 2024-25, Italy, Nepal and UAE ranked as the top importers of Indian Iron and Steel, while the USA, UAE and Saudi Arabia lead in import of ‘Products of Iron & Steel.
- The USA stood out as the primary importer of Indian ‘Industrial machinery,’ making up 21% of India’s global exports in this category, followed by UAE 5% and Germany with 4% shares, respectively.
- Saudi Arabia, South Africa, Mexico and Japan were top importers of India’s Automobiles during April-february 2024-25 in India’s global exports respectively over April- February 2023-24.
- USA, South Korea and Turkey were the top three importers of India’s Non-ferrous metals and products’ during April- February 2024-25 whereas USA, Singapore, UK and Germany were the top importers of Indian Electrical Machinery & Components during the same period.
- UAE, Saudi Arabia, France and USA were the top importers of India’s Aircrafts and Spacecraft during April-February 2024-25 in India’s total global exports of the product.
- Singapore, UAE and Indonesia became the largest importer of ships, boats and floating structures followed by USA and Sri Lanka. While for the auto components’ product group, USA remained the top importer in April-February 2024-25 followed by Brazil, Germany, Turkey and Mexico.
Disclaimer
The analysis in this write-up is prepared by the team at EEPC India. The data used in this write-up is primarily sourced from the DGCI&S database and pertains to products under the purview of EEPC India. Sources are cited where relevant. While every effort has been made to ensure the accuracy and reliability of the data and analysis, EEPC India assumes no responsibility for any errors or decisions based on this information.

SUSTAINABILITY WITH ARTIFICIAL INTELLIGENCE THE CRUCIAL NEED IN FOUNDRIES
DR BRIJESH AINAPUR AND BALAJI D LOGANATHAN


Dr Brijesh Ainapur
Founder and CEO, Bhumimithr Sustainability Solutions Pvt Ltd

Balaji D Loganathan
Founder and MD, SeeWise.AI
ABSTRACT
As industries worldwide committed to reduce their carbon footprint, the foundry sector stands out as a key area where sustainability can make a significant impact on the environment. Integrating rtificial Intelligence (AI) into foundry operations offers advanced solutions to increase efficiency, increase profitability, reduce waste, and promote eco-friendly practices. This article explores deeply into why AI is becoming essential for sustainable foundry operations and how it can transform the foundry industry for the better greener and eco-friendly organisation.
With modernisation and automation in the foundry processes, slowly foundry manpower requirements are turning from unskilled many to skilled few. Foundry Industry has witnessed exponential growth both in terms of volumes and technology. With the advent of new technologies, foundry operations are becoming more reliable and sustainable. Sustainability and reducing carbon footprints using Artificial intelligence, a new technology that is gaining more and more importance, support mistake proofing, cost reduction, MIS preparation, global sustainability compliances and plugging manual errors in all areas. Visual AI in Melting Operations control, Weighbridge automation, Moulding and Post-production areas are a few examples discussed in this article that help in realising all the above-mentioned benefits.
INTRODUCTION
The Climate change refers to significant and lasting shifts in global or regional climate patterns, primarily marked by a rise in average global temperatures. This phenomenon poses serious environmental challenges and necessitates urgent action to mitigate its impacts on ecosystems and human societies.
With the introduction of the transition phase of the CBAM (Cross Boader Adjustment Mechanism) tax from October 2023, it has become mandatory for all the exporters to the European Union to start measuring embedded carbon emissions for both installations and CBAM products. The Carbon Border Adjustment Mechanism (CBAM) is a carbon pricing system implemented by the European Union (EU) to combat carbon leakage and promote global climate action. It aims to put a fair price on the carbon emissions embedded in certain goods imported into the EU, ensuring a level-playing field for EU producers who operate under the EU’s Emissions Trading System (ETS).
Artificial intelligence (AI) is transforming manufacturing into a sustainable cost-effective unit by assisting the process in many areas:
- Predictive maintenance: AI systems will analyse data from all the equipments in furnaces, moulding machines, sand plant to predict when a part might fail or require maintenance. AI systems are integrated with the equipment PLC systems or data logger to collect the data and predict the results. This helps in reducing downtime and extending the lifespan of equipment.
- Quality control: AI-powered vision systems can inspect products for defects with high precision. If the human quality checks are missed, this can also be tracked with AI.
- Supply chain optimisation: AI systems will be interfaced with the plant ERP system, which helps in the continuous monitoring of demand, inventory levels, and also material inward/outward through our weighbridge automation on real-time basis.
- Process automation: AI enables automation of complex manufacturing processes. Robots and automated systems, guided by AI, can perform tasks like the complete, melting process - starting from charging of scrap to tapping of metal and pouring, assembly of cores, movement of cores, counting of castings from shakeout/shot blasting/fettling and despatch with high accuracy and speed.
- Energy management: Visual AI with PLC interface can optimise energy consumption by analysing patterns and suggests adjustments to reduce power. This lowers costs and supports in reducing process carbon footprint associated with the process and ensures sustainability efforts.
Overall, AI in manufacturing leads to reduced carbon footprint, increased efficiency, reduced costs, improved quality and greater flexibility. It’s a key driver in the
APPLICATION IN THE FOUNDRY PROCESS
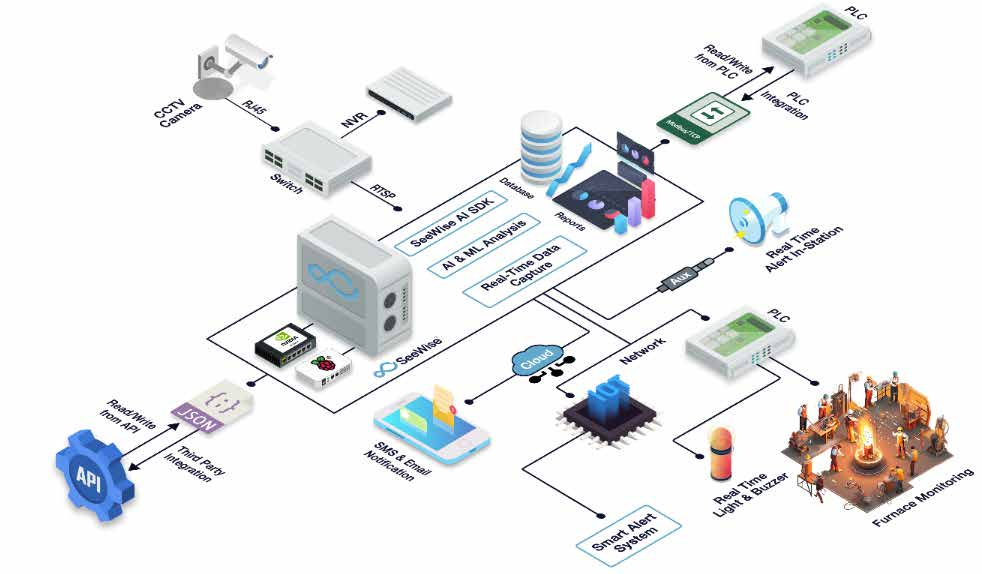
In order to achieve reduction in carbon footprint in foundry operations, one can utilise AI to derive at customer-specific solutions based on the foundry requirements. Simple foundry operations process flow architecture is shown in Fig 1.
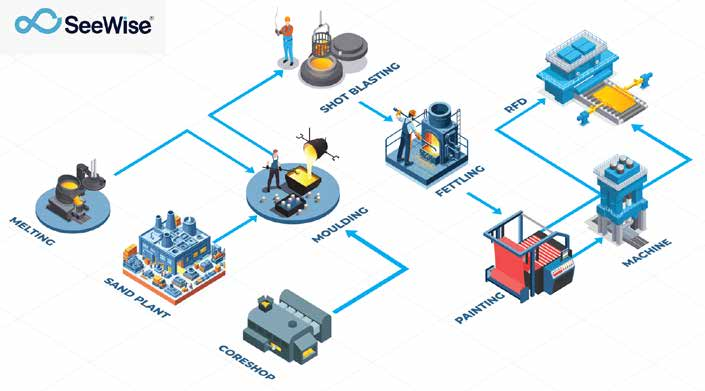
Melting, Sand Plant and Coreshop are sections where metal is melted, sand is prepared and cores are produced respectively for the moulding line. Sand is used for preparing the mould, cores are placed in the mould and metal is poured. Process parameters and emissions at each stage of production is calculated and recorded. AI utilises data from visual cameras, PLC systems of equipments and data loggers. All these calculations are based on GHG protocol and EPA protocols which complies with the emission standards
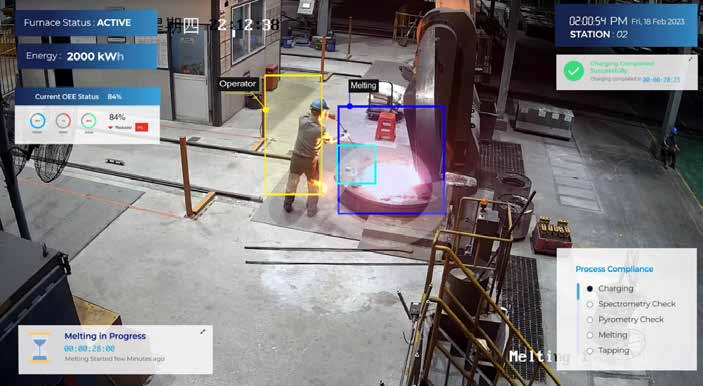
Implementation of AI system in melting operation is shown in Fig.2. All the operations of melting are tracked starting from charging scrap into furnace, temperature measurement, spectrometer sample checking and pouring along with real times associated with operations.
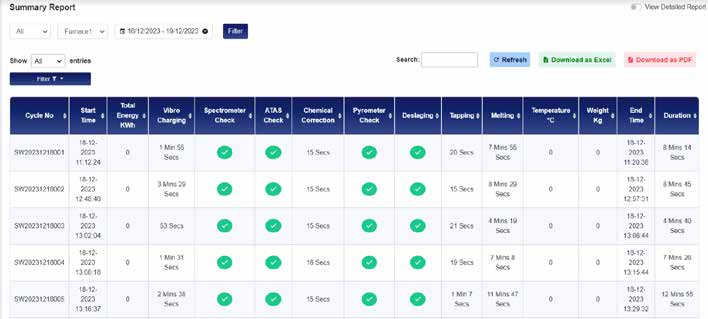
Summary report of each hour / shift / day / month can be easily retrieved and reports can be printed without relying on traditional log sheets. These outputs can also be integrated with your ERP system for production and delays entry.
CONCLUSION
With the complexity of foundry operations, measuring, monitoring and complying with each operation procedures is diverse in nature and effort has been put to completely do the automation using AI, which generates the production reports and sustainability compliance reports in one go. Becoming sustainability compliant is not an one-day affair, it is a long journey and let us start this long journey today to own responsibility towards the next generations and planet earth. Sustainability is not only a concern of protecting the green, but also protecting our Business from International norms and Government compliances. Let’s work together to make our foundry industry to become Artificial Intelligence enabled Sustainability Compliant.
Acknowledgement
1. Sustainability with Artificial Intelligence - The Crucial Need in Foundries (Page 32 of Indian Foundry Journal, September 2024 edition)
© Copyright , All rights reserved. Design by Andreal