







VOL. 19, ISSUE NO. 4 | July 2026

Oversight





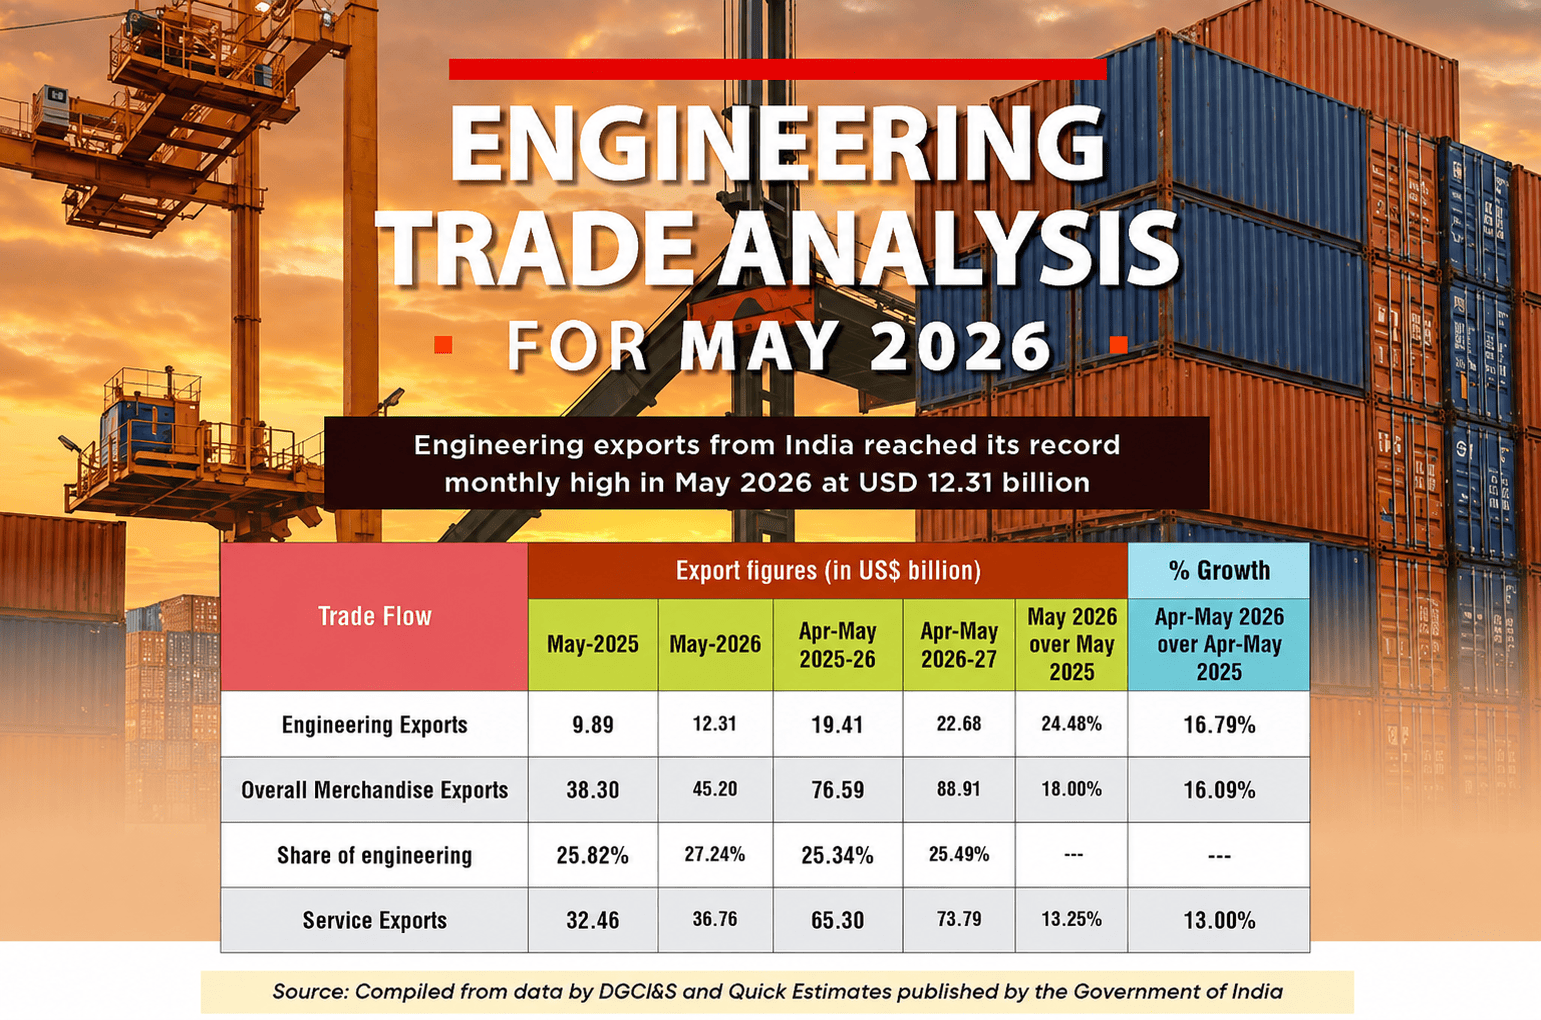
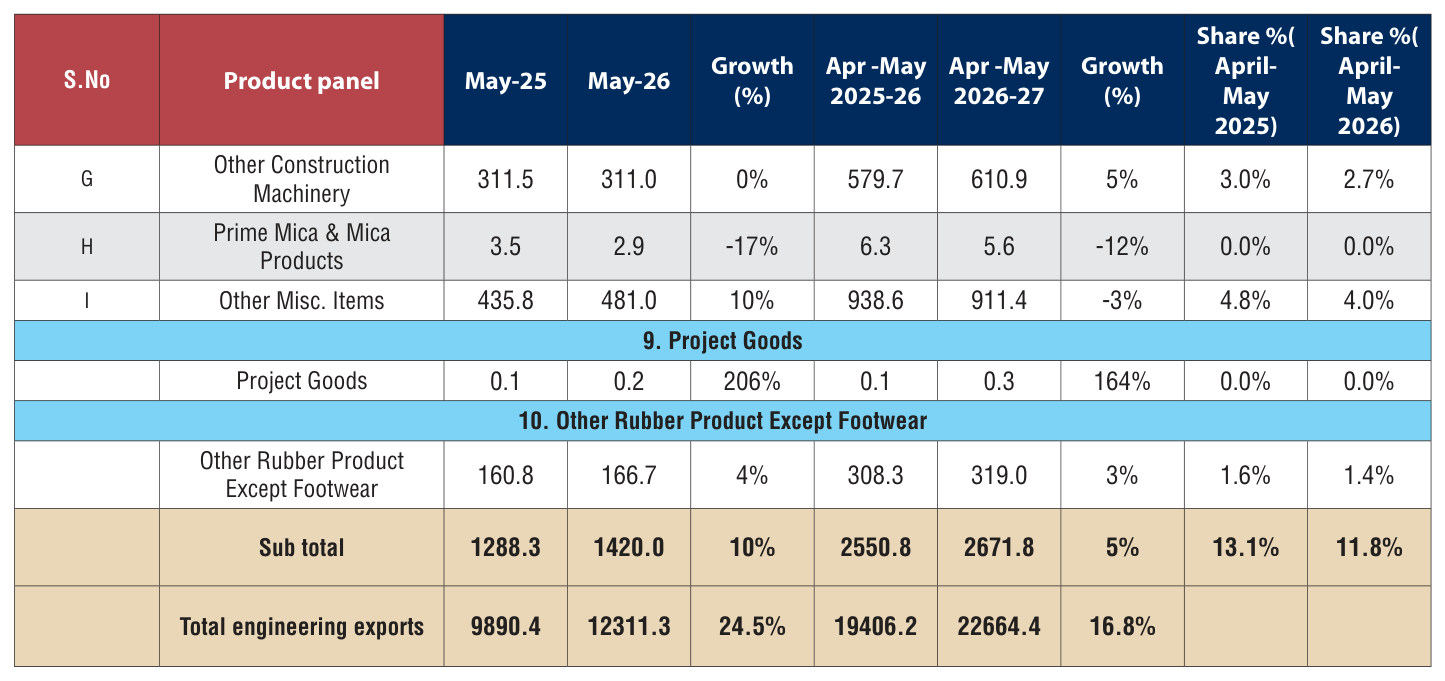
The performance of Indian engineering has been remarkable in recent years as it reached its all-time high in two last two completed fiscal years in a row. The new fiscal also saw continuation of the same as the month of May 2026 witnessed record high engineering exports from India on a monthly basis. For the first time on record, engineering shipments from India crossed USD 12 billion in May 2026 to reach USD 12.31 billion as against USD 9.89 billion of exports in the same month last fiscal. The year-on-year growth during the said month was also notably high at 24.5 percent. On a cumulative basis, engineering exports during the first two months was. recorded at USD 22.66 billion as against USD 19.41 billion during the same period last fiscal, securing a growth of 16.8 percent. As per the Quick Estimates of Government of India, share of engineering in India's total merchandised exports stood at 27.2 percent in May 2026 and 25.5 percent during Apr-May 2026-27.
The record high exports in May 2026 was mainly led by Electric machinery and equipment, Ships, boats and floating structures: Motor vehicles/cars: Iron and steel and its products among others. 28 among 34 panels recorded higher exports in May 2026 while 6 panels conceded drop in exports on a year-on-year basis. Region wise analysis showed that North America, WANA and European Union were the topmost consumers of Indian engineering products sharing 19.3 percent, 16.7 percent and 15.2 percent of India's global engineering exports respectively in May 2026. Even at the time of Geo-political crisis in the West Asia, engineering exports to WANA increased by 44.3 percent in May 2026 and by 14.1 percent during Apr-May 2026. Country wise analysis showed that exports to all top five destinations of Indian engineering exports namely USA, UAE, UK, Germany and Saudi Arabia recorded decent to high growth during the first two months of fiscal 2026-27,
HIGHLIGHTS
- Indian engineering exports has reached its all‑time high on a monthly basis in May 2026.For the first time on record, engineering shipments from India crossed USD 12 billion.
- Engineering exports from India in May 2026 was recorded at USD 12.31 billionas against USD 9.89 billion in the same month last fiscal, securing a notably high year‑on‑year growth of 24.5 percent.
- On a cumulative basis, engineering exports during the first two months was recorded at USD 22.66 billion as against USD 19.41 billion during the same period last fiscal, securing a growth of 16.8 percent.
- As per the Quick Estimates of Government of India, share of engineering in India’s total merchandised exports stood at 27.2 percent in May 2026 and 25.5 percent during Apr‑May 2026‑27.
- In May 2026, 28 out of 34 engineering panels witnessed positive year‑on‑year growth. While 6 engineering panels including Products of Iron and Steel, Lead and products, IC Engines, Cranes, Lifts and Winches, Other Construction Machinery, prime mica witnessed year‑on‑year decline in exports.
- On a cumulative basis too, 29 out of 34 engineering panels recorded growth and remaining 5 engineering panels including Products of Iron and Steel, Lead and products, IC Engines, , prime mica recorded negative growth during April‑May 2026‑27.
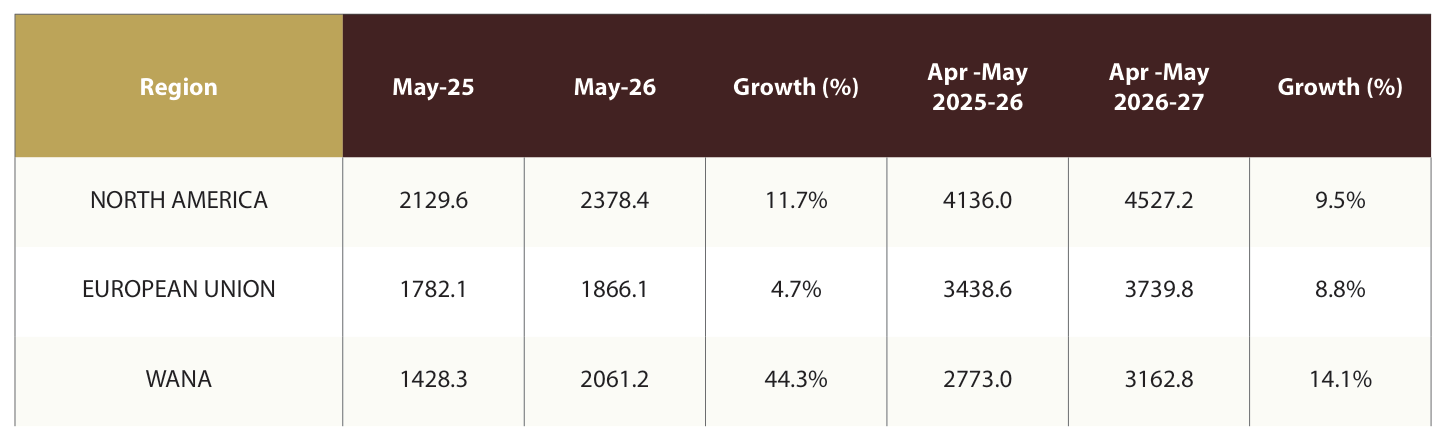
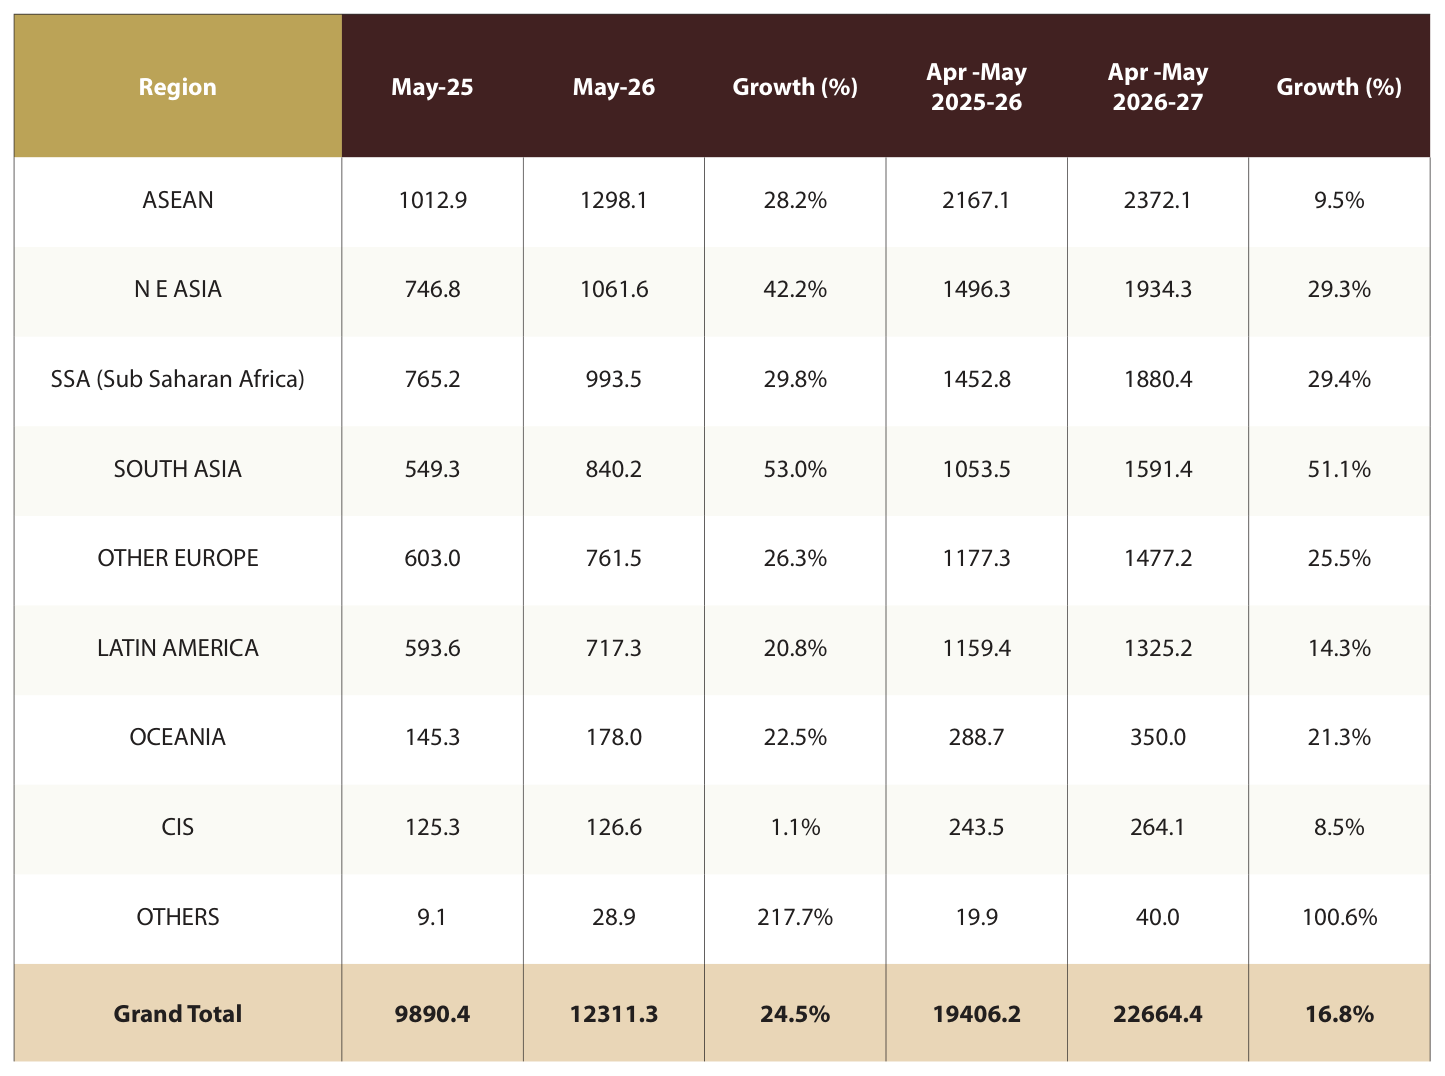
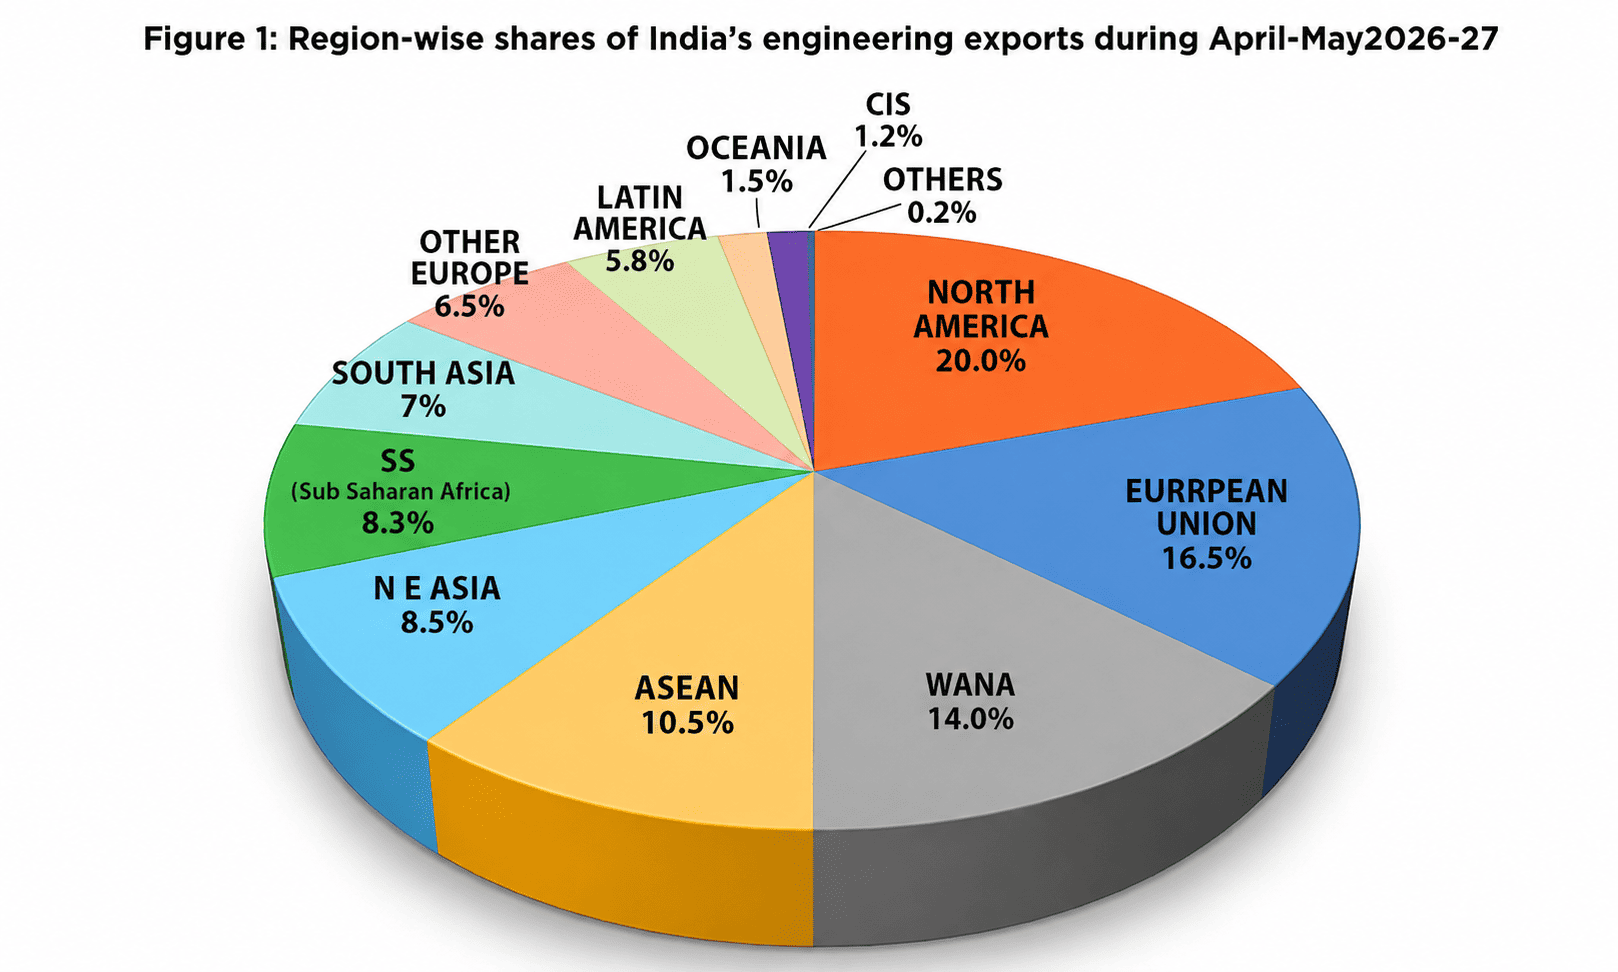
- During April‑May 2026‑27, all regions recorded export growth. North America continued to account for the largest share of Indian engineering exports (20% share) followed by EU (16.5%), WANA (14%), ASEAN (10%) and North East Asia (8.5%).
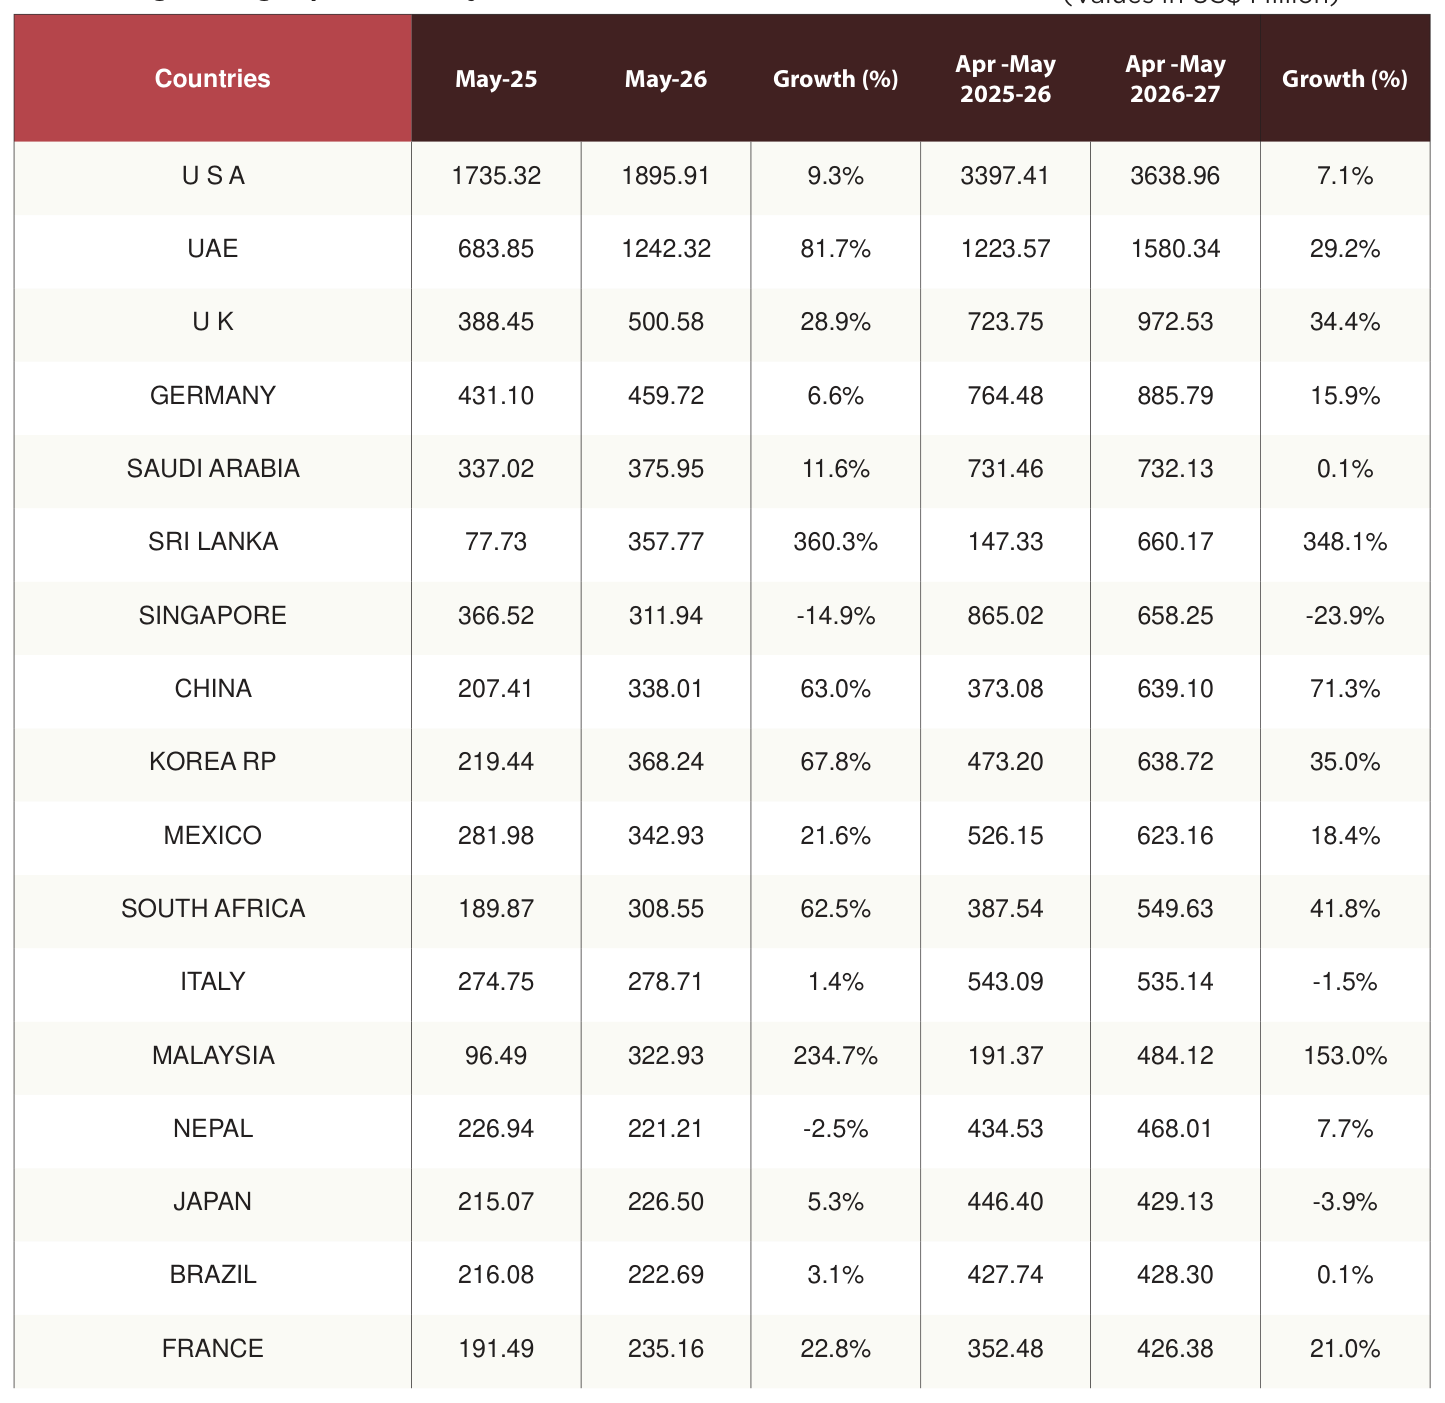
- Country‑wise, USA continued to remain the top destination for Indian engineering exports in April‑May 2026‑27 as it recorded an export of 3.64 billion. The y‑o‑y growth from USA is recorded at 7%.
- Even at the time of Geopolitical crisis in the West Asia, engineering exports to WANA increased by 44.3 percent in May 2026 and by 14.1 percent during Apr‑May 2026.
- Country wise analysis showed that exports to all top five destinations of Indian engineering exports namely USA, UAE, UK, Germany and Saudi Arabia recorded decent to high growth during the first two months of fiscal 2026‑27.
ENGINEERING EXPORTS: MONTHLY TREND
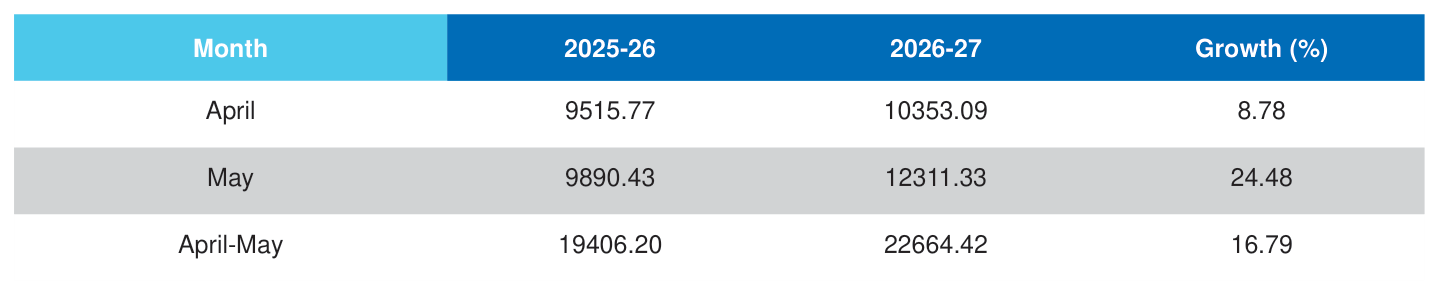
The monthly engineering export figures for 2026‑27 vis‑à‑vis 2025‑26 are shown below as per the latest DGCI&S estimates:
Table 1: Engineering Exports: Monthly Trend in 2026-27 (Values in US$ million)
Source: DGCI&S, Govt. of India
TOP 25 ENGINEERING EXPORT DESTINATIONS IN MAY 2026
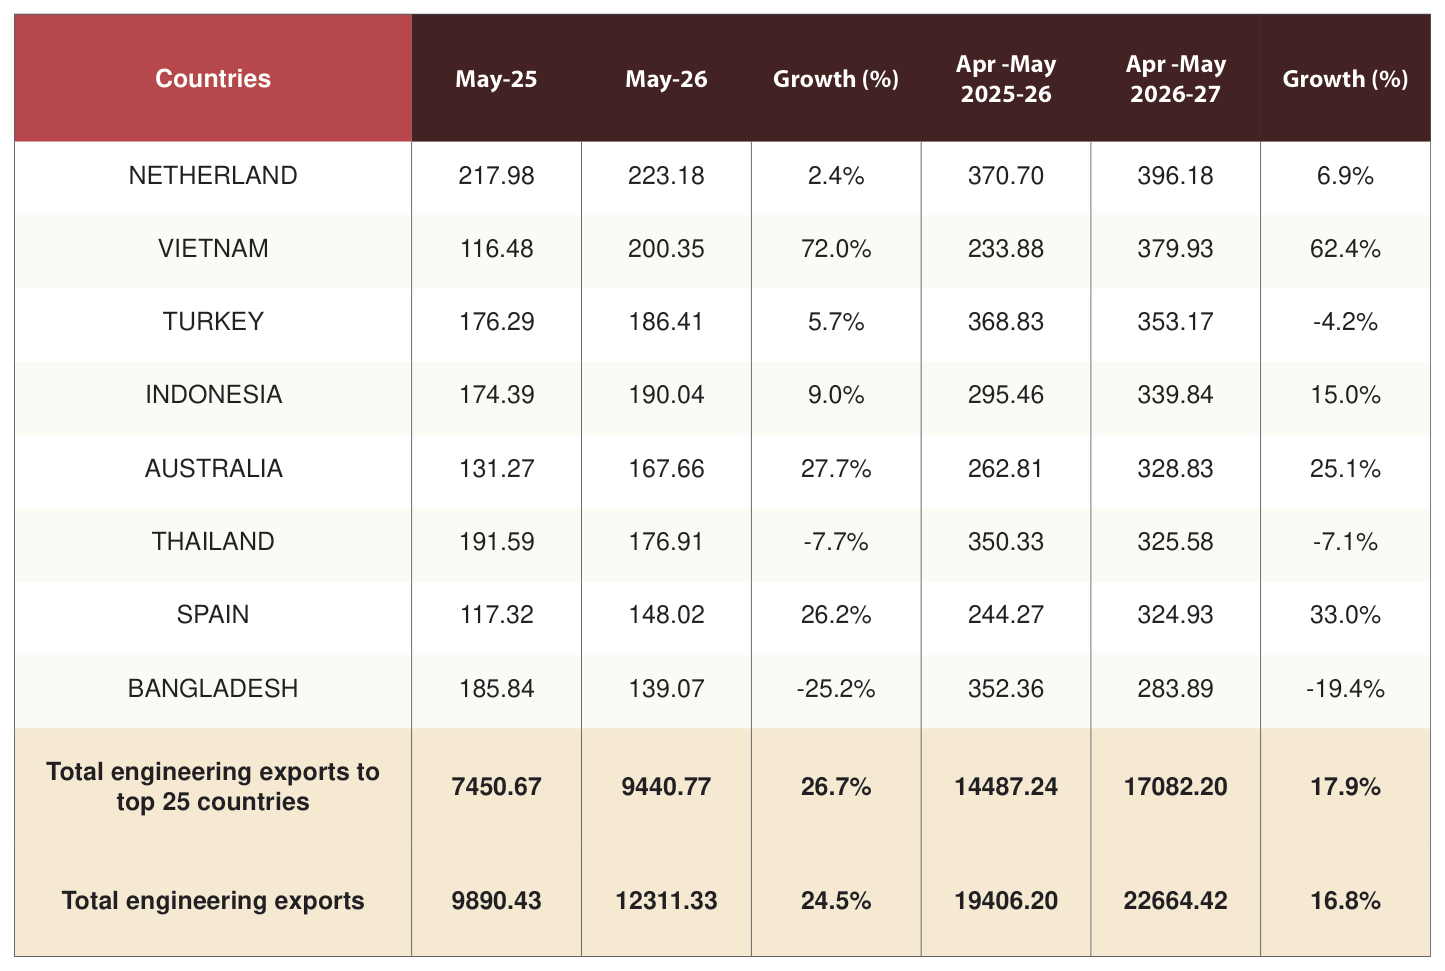
We now look at the export scenario of the top 25 nations that had highest demand for Indian engineering products during May2026 over May2025 as well as in cumulative terms during April‑May 2026‑27 vis‑à‑vis April‑May2025‑26.The data clearly shows that top 25 countries contribute more than 75% of total engineering exports.
Table 2: Engineering exports country-wise (Values in US$ Million)
Source: DGCI&S
REGION WISE INDIA'S ENGINEERING EXPORTS
The following table depicts region wise India’s engineering exports for April‑May2026 as compared to April‑May2025
Table 3: Region wise engineering exports in April-May 2026-27 vis-à-vis April-May 2025-26 (Values in US$ Million)
Source: DGCI&S
Note: Myanmar has been included in ASEAN and not in South Asia, since ASEAN is a formal economic grouping.
Source: DGCI&S
PANEL WISE INDIA’S ENGINEERING EXPORTS
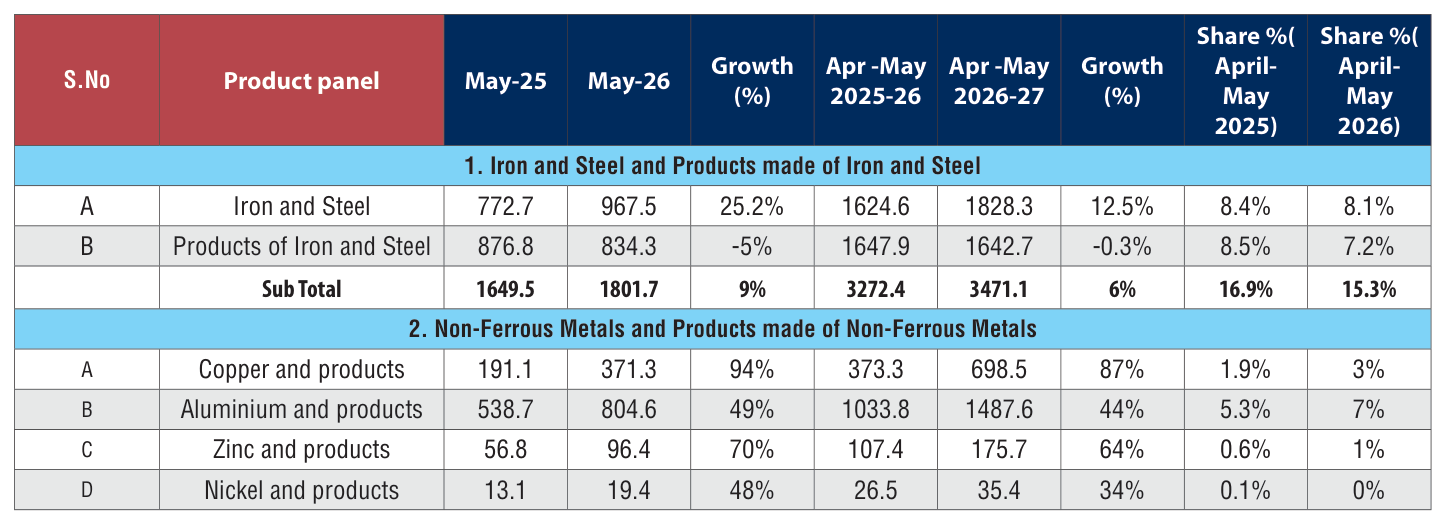
The following table depicts region wise India’s panel wise engineering exports for May 2026 as compared to May 2025
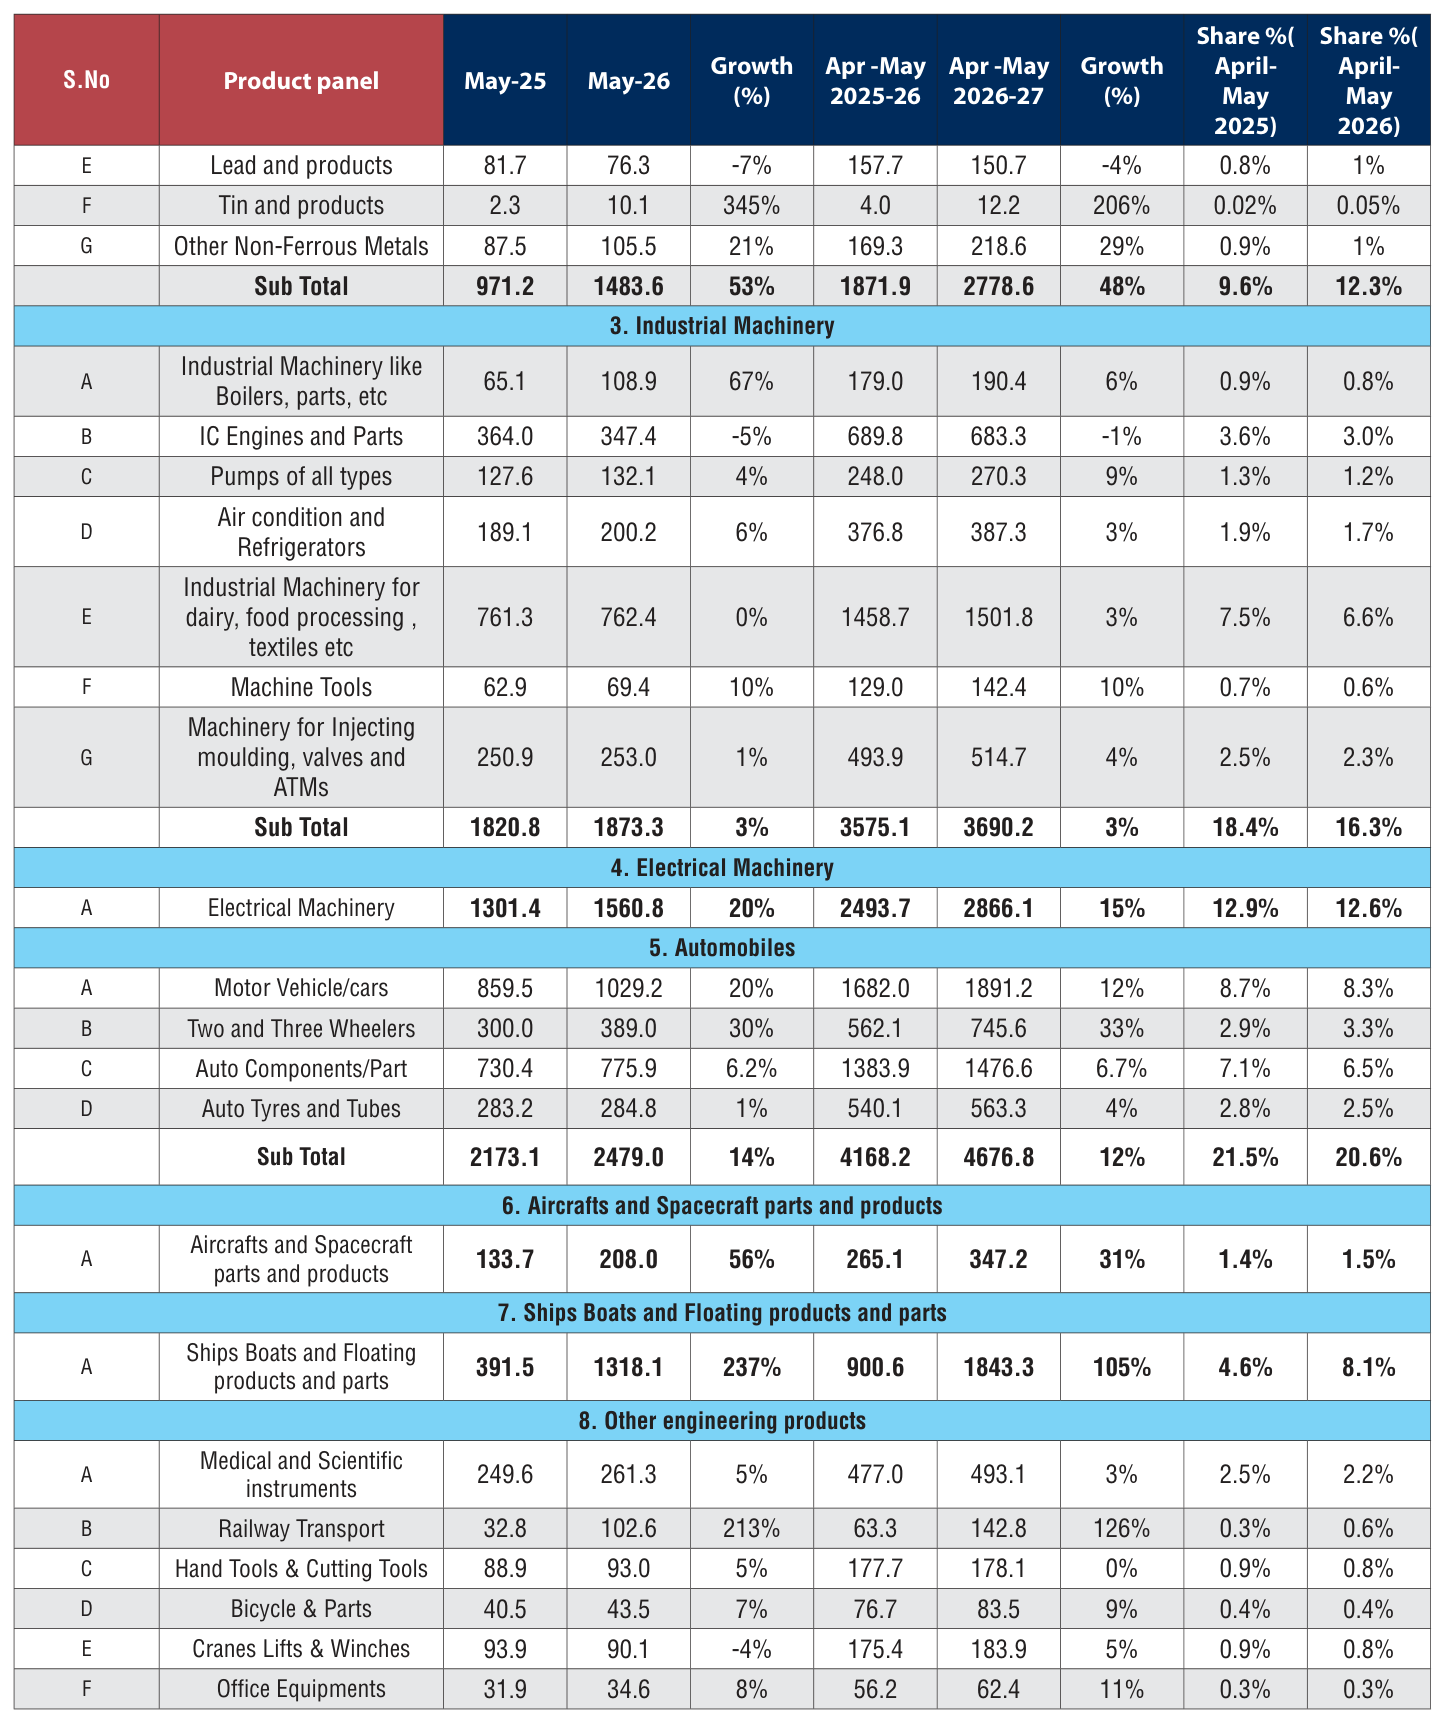
Table 4: Panel wise engineering exports in May 2026 vis - a - vis May 2025 (US Mn)
Sectoral Observations:
India’s engineering exports grew by about 16.8% in April–May2026‑27 to around US$22.66 billion, with mixed performance across panels:
a. Exports of iron and steel rose by 6% during April–May2026‑27, supported by higher shipments of primary steel growing by 12.5%, while products of iron and steel witnessed a marginal drop of 0.3% Overall, India’s steel exports rose 6% to US$3.47 billion during April–May 2026‑27, supported by strong demand from the USA, UK, UAE, Nepal,EU markets (Italy, Netherland, Germany, Belgium), Nepal,Vietnam and Korea Rep.
b. As per latest Steel estimates, during April–May 2026, India remained a net importer of steel, with imports exceeding exports by about 0.39 million tonnes, reflecting continued demand‑supply imbalance in the domestic market. Exports increased marginally from 0.47 million tonnes in April to 0.51 million tonnes in May 2026, while imports also rose slightly to 0.69 million tonnes. On the pricing front, domestic steel prices, including TMT, HRC, and CRC, declined in May compared to April 2026, whereas iron ore prices showed an upward trend during the same period.
The non‑ferrous metals panel remained a key growth driver, with exports rising by ~48% to about US$ 2.78 billion during April–May 2026, supported by strong performance across major metals.
- Aluminium and aluminium products recorded a robust growth of ~44%, reaching about US$ 1.49 billion, driven by improved global demand and higher shipments.
- Copper and copper products witnessed strong growth of ~87%, increasing to around US$ 0.70 billion, supported by strong global demand across key markets.
- Lead products registered a decline of ~4%, mainly due to weaker global demand.The International Lead and Zinc Study Group (ILZSG) recently mentioned that global lead demand is only rising very modestly. In China, production of both cars and e‑bikes increased significantly in 2025, supported by government trade‑in policies.However, net exports of lead‑ acid batteries declined over the same period, resulting in a limited growth of 0.4% in lead demand.In 2026, Chinese demand is forecast to fall by 0.7%. The same publication also mentions that demand has been on the rise in India which may be another reason for export decline.
- Tin products, however, recorded sharp growth (over 100%), albeit on a low base.
- Exports of industrial machinery grew modestly by ~3% to about US$ 3.69 billion during April– May 2026, supported by steady demand for machinery such as boilers and pumps. However, IC engines and parts witnessed a decline, reflecting the global shift towards electric vehicles.
- Electrical machinery exports increased by ~15% to around US$ 2.87 billion, driven by sustained demand for electrical equipment and components amid global electrification trends.
- The automobile sector registered strong growth of ~12%, with exports rising to about US$ 4.68 billion, led by motor vehicles, two‑ and three‑wheelers, and auto components.
- Exports of other engineering products grew by ~12% to about US$ 4.68 billion, supported by segments such as railway equipment and construction machinery. However, cranes, lifts and winches witnessed a decline, mainly due to reduced exports to the UK (down ~12%).
ENGINEERING EXPORTS – STATE-WISE ANALYSIS (Fiscal 2025-26)
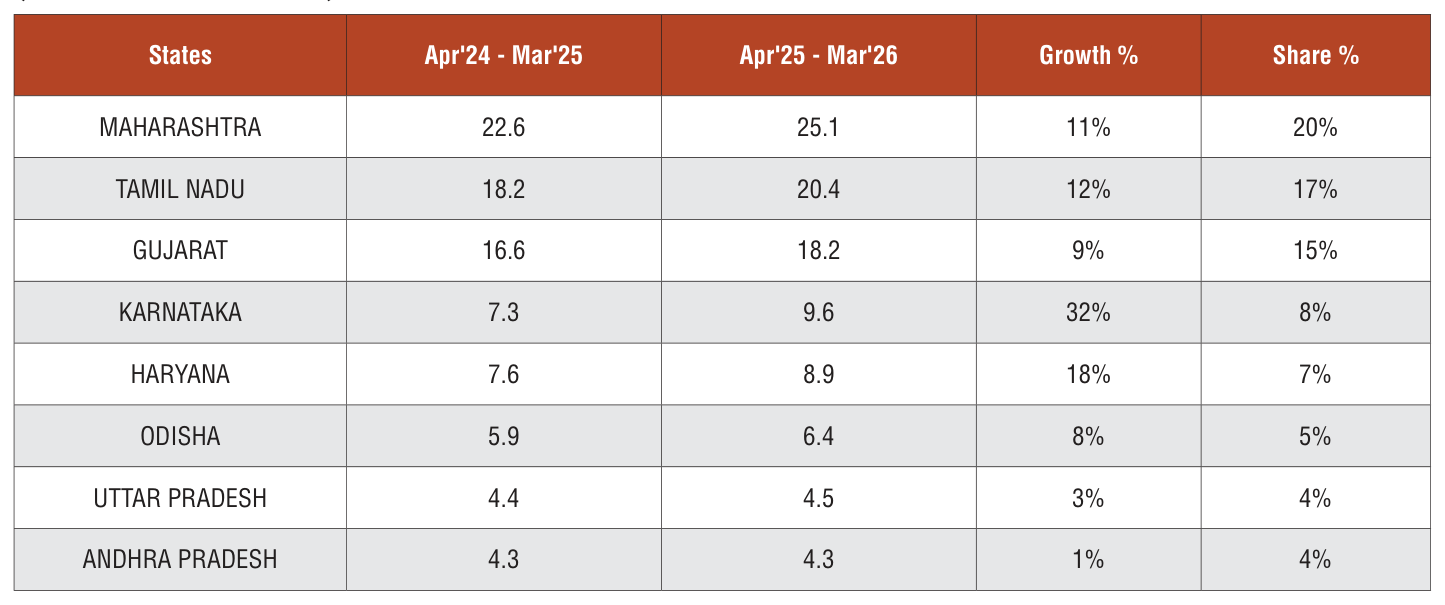
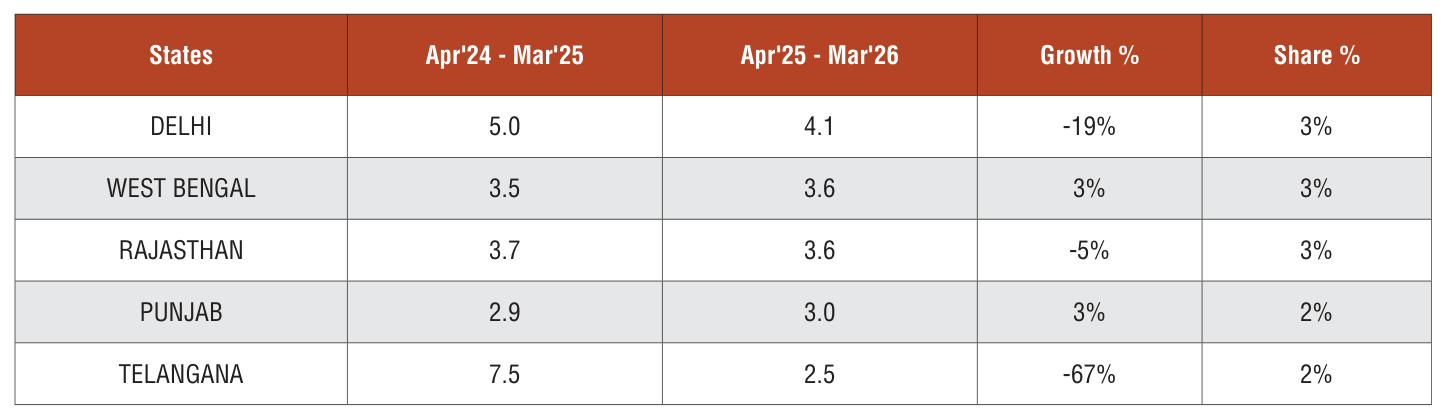
- India’s engineering exports remain highly concentrated, with the top 12 states accounting for nearly 91% of total exports during April–March 2025–26, underscor‑ ing the dominance of a few in‑ dustrial hubs.
- Maharashtra leads with exports of about USD 25.1 billion, regis‑ tering an 11% growth (from USD 22.6 billion) and contributing 20% to the national total, driven by its strong engineering manufacturing base. Tamil Nadu follows with USD 20.4 billion (+12%, 17% share), while Gujarat recorded USD 18.2 billion (+9%, 15% share), reflecting continued strength in western and south‑ ern regions. Karnataka witnessed the highest growth among major states at 32% (USD 9.6 billion, 8% share), while Haryana grew by 18% to USD 8.9 billion (7% share).
- In contrast, Delhi saw a sharp contraction of 19% to USD 4.1 billion (3% share) and Telangana declined significantly, while mod‑ erate growth was seen in states like Odisha and Uttar Pradesh. Overall, export growth remains concentrated across western and southern industrial corridors, supported by strong manufactur‑ ing ecosystems and export‑ori‑ ented infrastructure.
Table 5: India’s top states constituting 91% of India’s engineering exports (value in US$ billion)
Source: DGCI&S
India’s region‑wise engineering exports
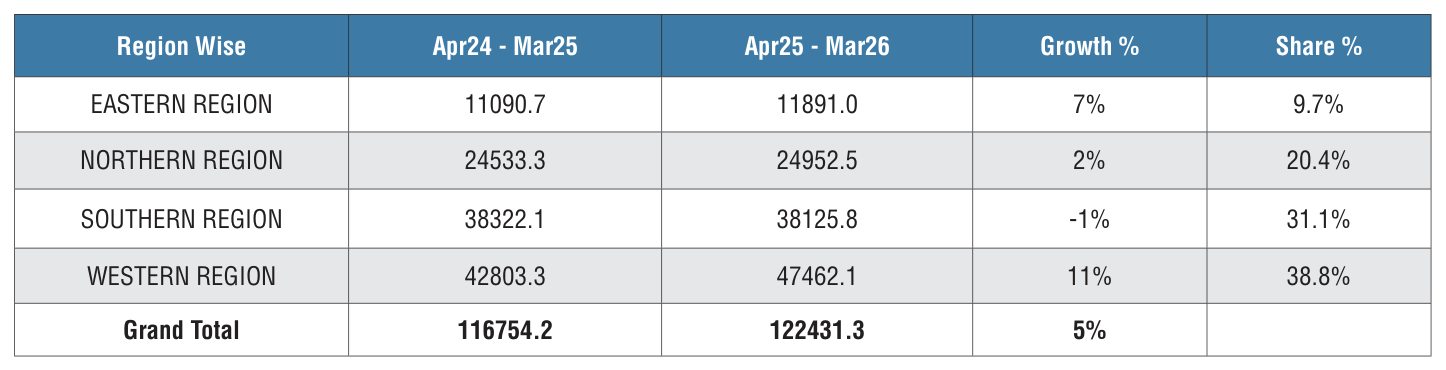
Table 6: Region Wise Engineering Exports (Value in US$ million) India’s Region wise engineering exports
Source: DGCI&S
India’s region‑wise engineering exports (DGCIS) grew by 5% to US$ 122.4 billion in April–March 2025– 26, led by the Western Region at US$ 47.5 billion (+11%, 38.8% share). The Southern Region remained largely flat at US$ 38.1 billion (–1%, 31.1% share), while the Northern Region rose marginally by 2% to US$ 25.0 billion (20.4% share) and the Eastern Region grew by 7% to US$ 11.9 billion (9.7% share). Overall, exports remain concentrated in the Western and Southern regions (about 70%), with the West driving overall growth.
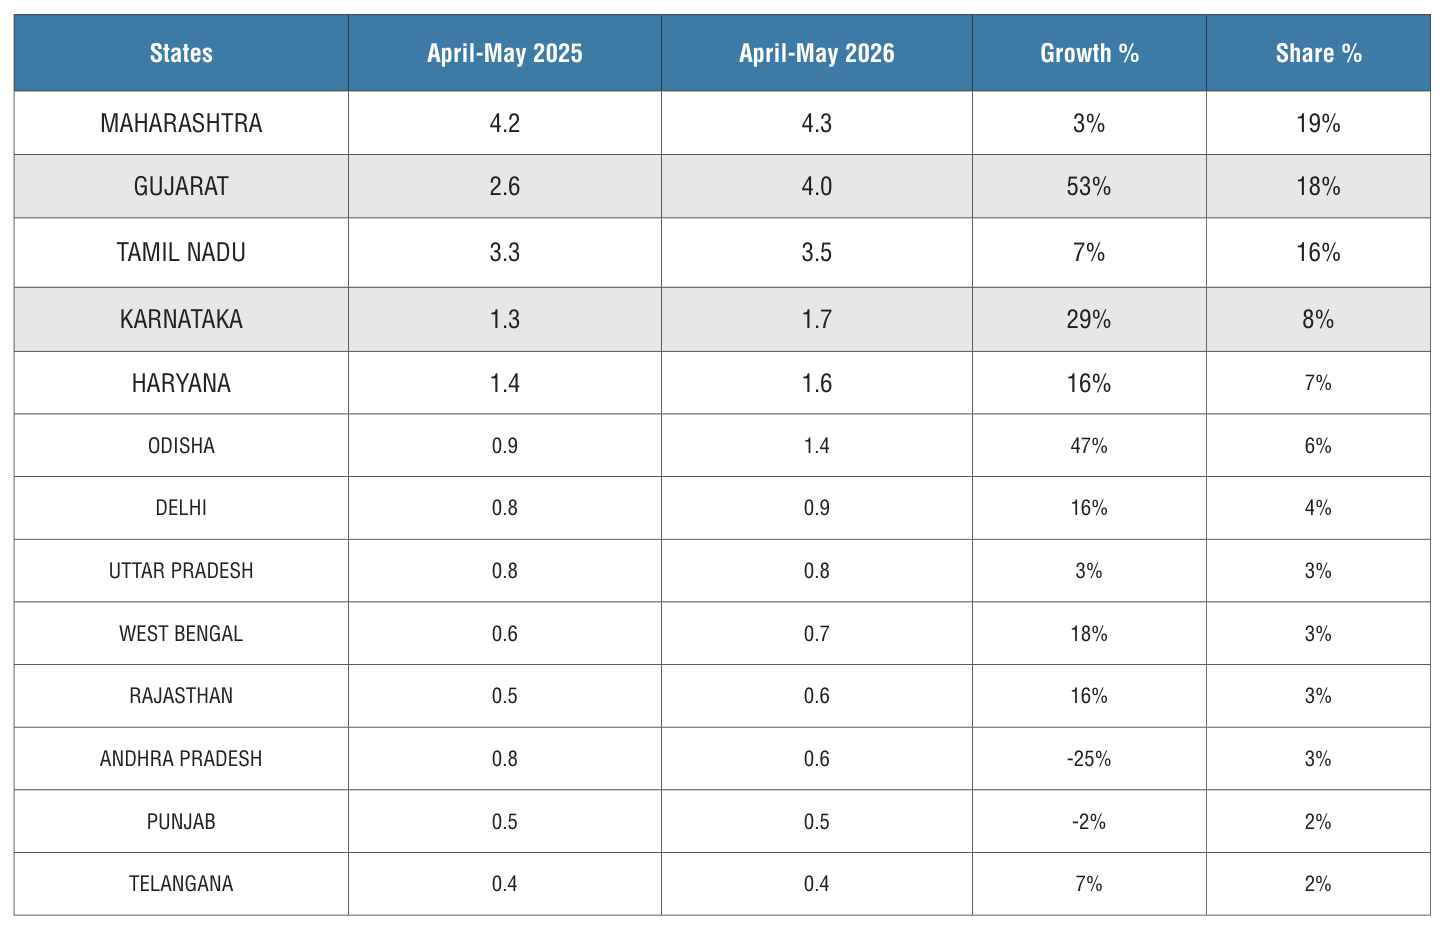
ENGINEERING EXPORTS – STATE-WISE ANALYSIS (April-May 2026-27) (US$ billion)
Table 7
Source: DGCI&S
India’s state‑wise engineering exports during April–May 2026 reflect moderate overall growth with strong regional divergence, led primarily by western and southern states. Maharashtra remained the largest exporter at USD 4.3 billion, accounting for 19% share, though growth was relatively modest at 3%. Gujarat emerged as a key growth driver, with exports rising sharply by 53% to USD 4.0 billion, contributing around 18% share, while Tamil Nadu recorded steady growth of 7% to USD 3.5 billion with a 16% share.
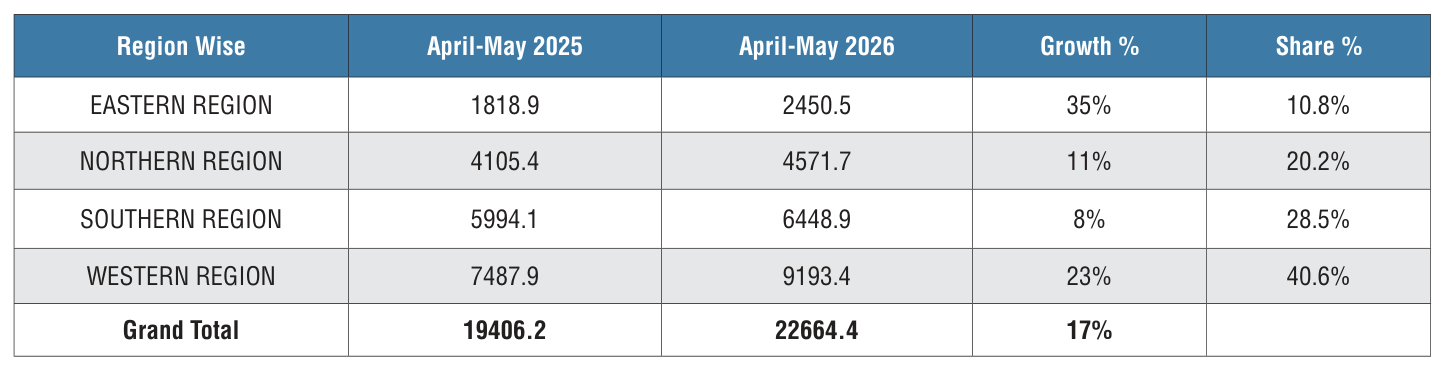
Table 8: Region Wise Engineering Exports (Value in US$ million)
Source: DGCI&S
India’s region‑wise engineering exports during April–May 2026 registered a robust growth of 17% to US$ 22.66 billion, reflecting strong performance across all regions.The Western Region continued to lead, with exports rising by 23% to US$ 9.19 billion, accounting for the highest 40.6% share in total exports.
The Southern Region recorded steady growth of 8% to US$ 6.45 billion, contributing 28.5% share, while the Northern Region grew by 11% to US$ 4.57 billion, accounting for 20.2% share.
The Eastern Region emerged as the fastest‑growing region, with exports increasing sharply by 35% to US$ 2.45 billion, though its share remained relatively smaller at 10.8%.
Overall, engineering exports continue to be dominated by the Western Region, supported by balanced growth across Southern and Northern regions, while the Eastern Region is rapidly gaining traction in India’s export landscape
Key Products driving exports in top states:
- Maharashtra: Export performance was driven by industrial machinery (₹418 bn), motor vehicles (₹330 bn), auto components (₹327 bn), along with strong contributions from iron & steel (₹382 bn) and products of iron & steel (₹384 bn), reinforcing its leadership position.
- Tamil Nadu: Exports were led by motor vehicles (₹513 bn), auto components (₹410 bn), industrial machinery (₹310 bn) and electric machinery (₹373 bn), while shipboat structures witnessed a sharp rise (₹277 bn), emerging as a key growth segment.
- • Gujarat: The surge was driven primarily by ship/boat and floating structures (₹1,148 bn), along with strong growth in motor vehicles (₹461 bn), products of iron & steel (₹415 bn), copper products (₹241 bn) and industrial machinery, indicating broad‑based expansion.
- • Karnataka: Growth was supported by a significant jump in electric machinery (₹621 bn), along with aircraft/ spacecraft parts (₹144 bn), auto components (₹93 bn) and other diversified engineering products, highlighting increasing high‑tech exports.
- • Haryana: Export growth was led by motor vehicles (₹312 bn), electric machinery (₹226 bn), auto components (₹189 bn) and industrial machinery (₹111 bn), along with notable contribution from two‑ and three‑wheelers (₹135 bn).
Disclaimer: Please note the following disclaimer given by the DGCI&S whereby it is stated that state-wise export figures are based on state of origin code in shipping bills and may not give the right estimate. Also the datdata hast been updated since the last two years
CORRELATION BETWEEN MANUFACTURING OUTPUT AND ENGINEERING EXPORTS
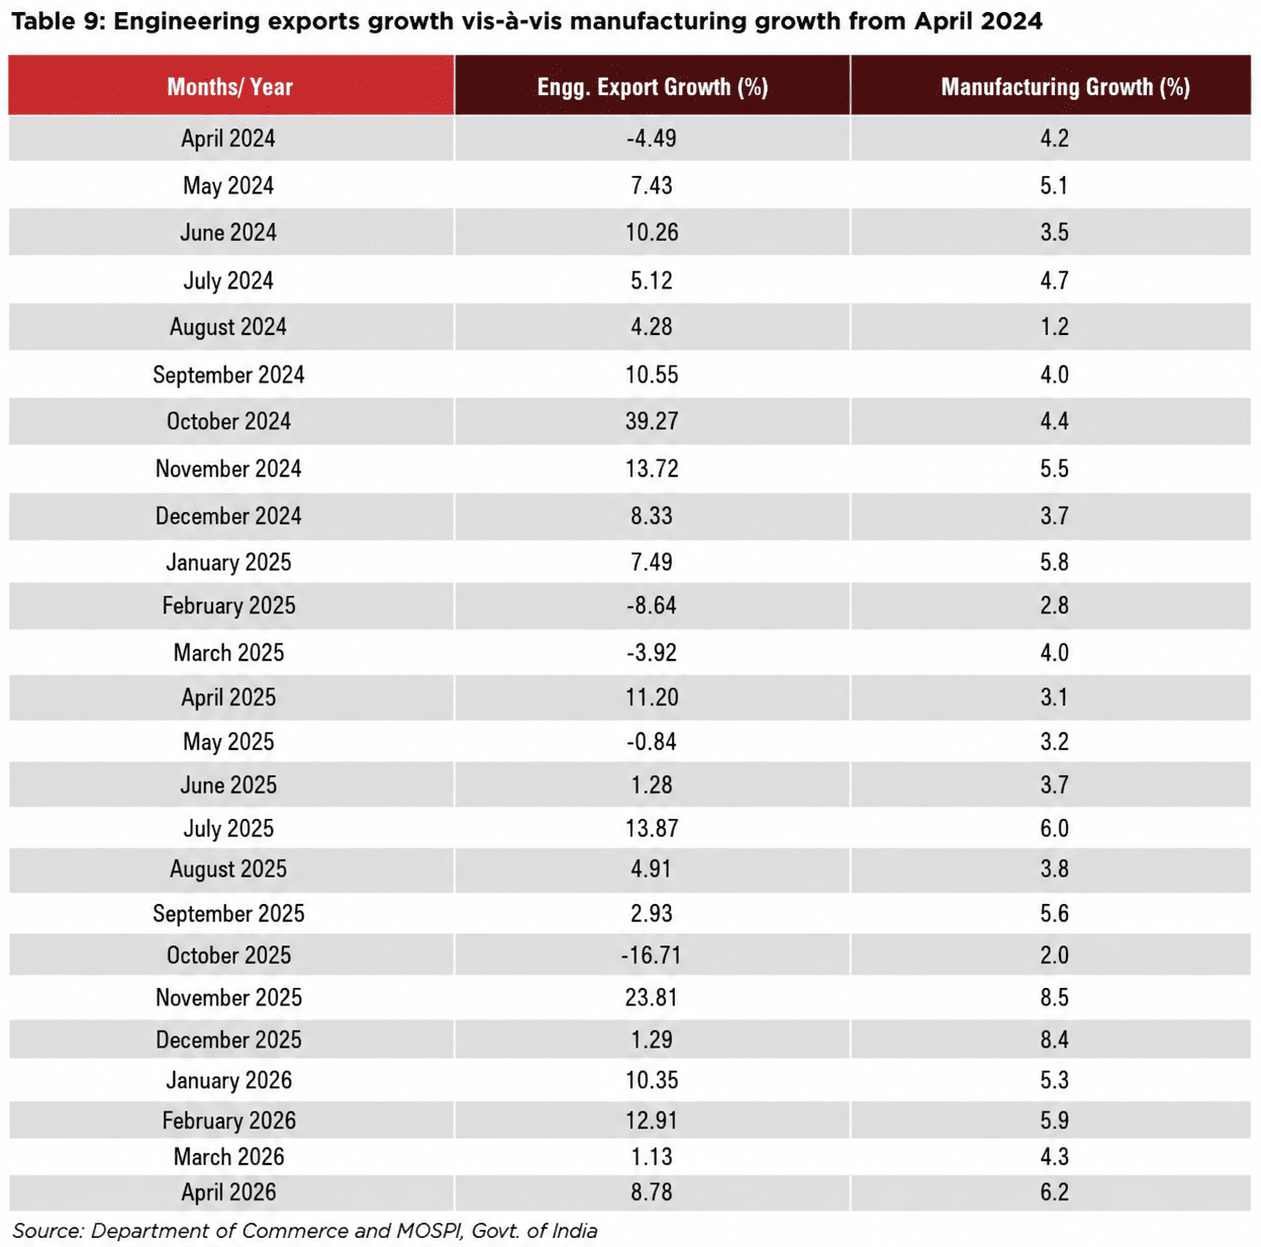
Engineering forms a considerable part of the broader manufacturing sector and the share of engineering production in overall manufacturing output is quite significant. As exports generally come from what is produced within a country, some correlation between manufacturing production growth and engineering export growth should exist.
We briefly look at the trend in manufacturing growth as also engineering export growth to see if they move in tandem. It may be mentioned that manufacturing has 77.63% weightage in India’s industrial production.
Engineering export growth and manufacturing output growth moved in the same direction in as many as nine out of twelve months in each of the fiscal years 2019-20 and 2020-21. During fiscal 202122, engineering export growth and manufacturing growth moved in the same direction in seven out of twelve months while in each of fiscal 2022-23 and 2023-24, as many as 10 out of 12 months saw engineering exports and manufacturing output moved in the same direction. In 2024-25, both moved in the same direction in eight out of 12 months and in202526, both engineering export growth and manufacturing growth moved in the same direction in seven out of 12 months.
The first month of fiscal 2026‑27 saw manufacturing output growth (new series with base year 2022‑ 23) engineering export growth and moved in the same direction with both securing higher growth over the previous month.
The link between these two may not be established in one or two months, but a positive correlation may be seen if medium to long term trend is considered.
IMPACT OF EXCHANGE RATE ON INDIA’S EXPORTS
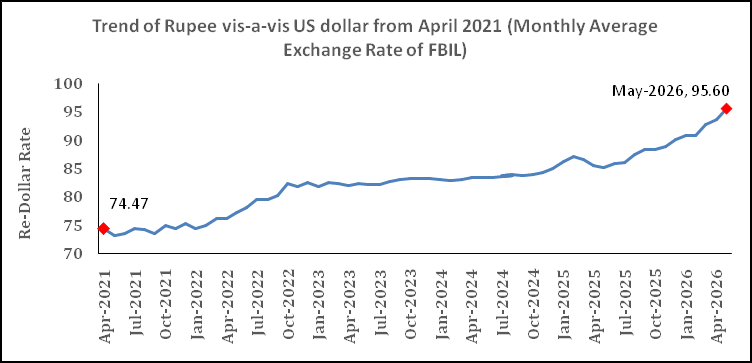
How did the exchange rate fare during May 2026 and what was the recent trend in Re‑Dollar move‑ ment? In order to get a clearer pic‑ ture of the recent Re‑Dollar trend, not only we took the exchange rate of May 2026, but also considered monthly average exchange rate of Rupee vis‑à‑vis the US Dollar for each month of fiscal 2024‑25 and fiscal 2025‑26 as per the latest data published, as mere one‑month fig‑ ure does not reflect any trend. The following two tables clearly depicts the short‑term trend.
Table 10: USD-INR monthly average exchange rate in 2026-27 vis-à-vis 2025-26
(As per latest data released by FBIL)
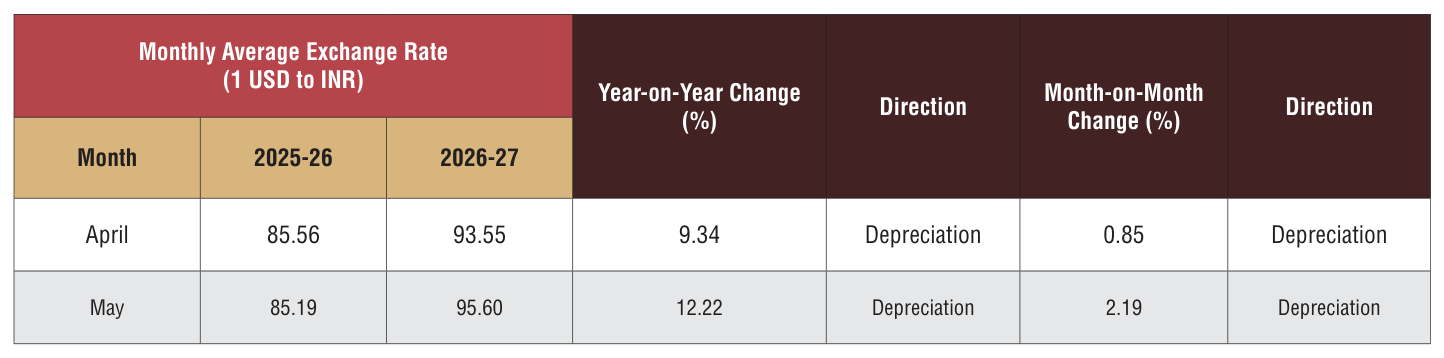
Rupee depreciation vis-à-vis the US dollar continued, rather accelerated on the back of geopolitical uncertainty in the West Asia region and high crude prices.
Flight of foreign capital from Indian market especially by FPIs also accelerated rupee’s fall. Rupee weakened by around 2.19% month‑ on‑month in May 2026 while the depreciation was12.22% on a year‑ on‑year basis.
Table 11: USD-INR monthly average exchange rate in 2025-26 vis-à-vis 2024-25
(As per latest data released by FBIL)
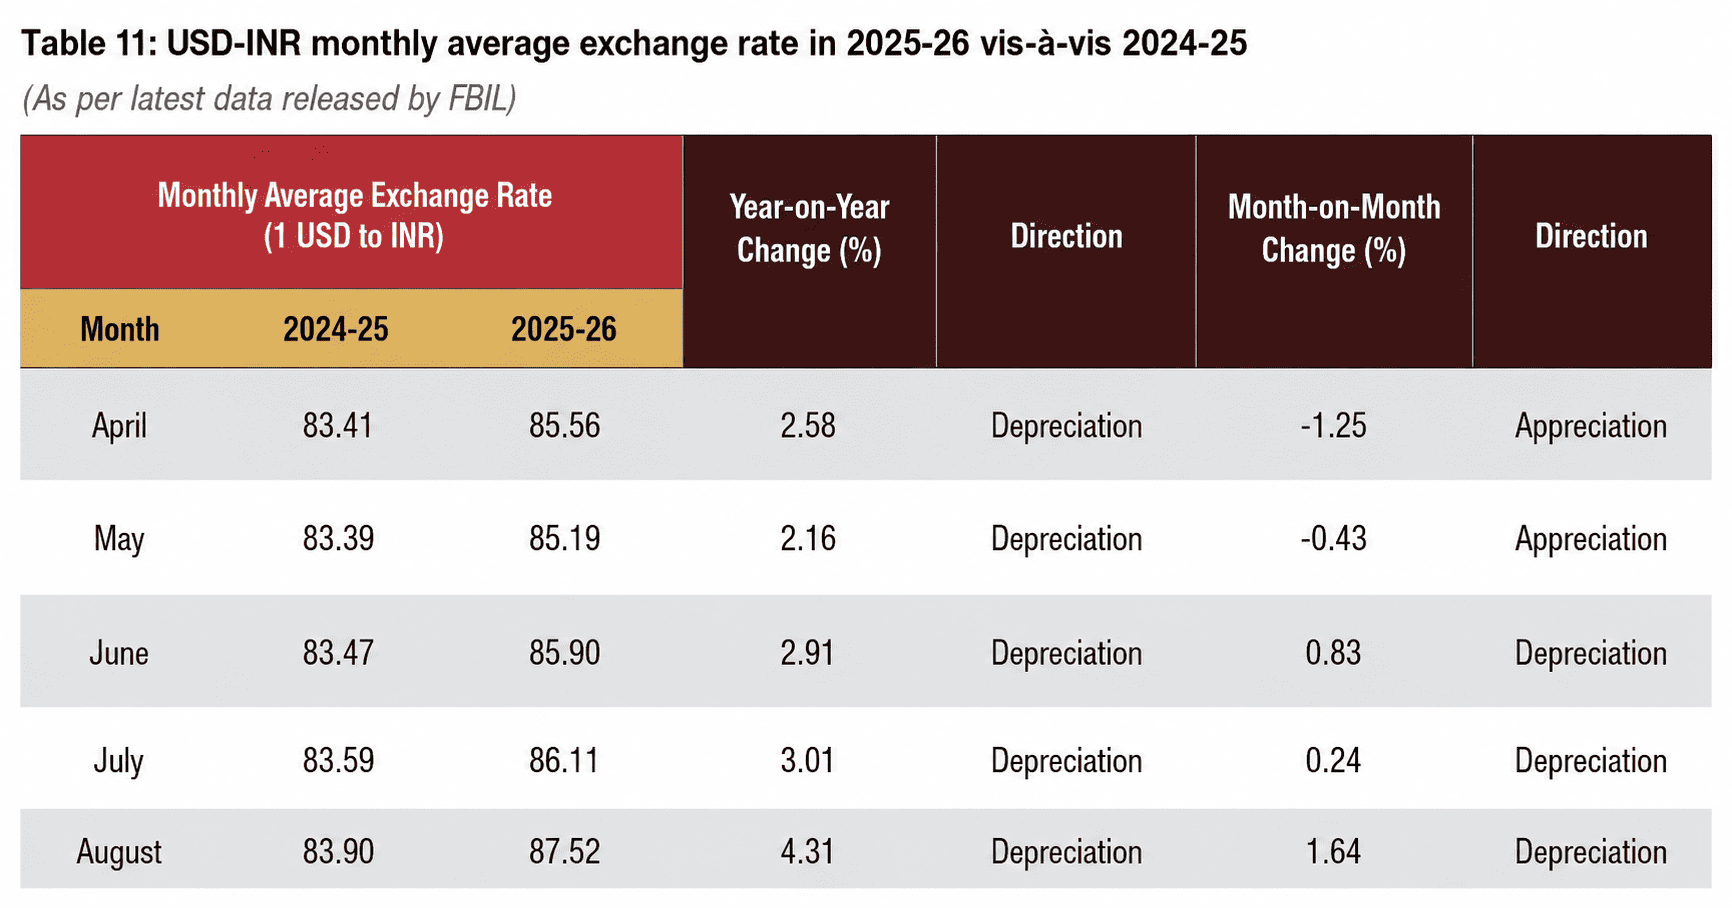
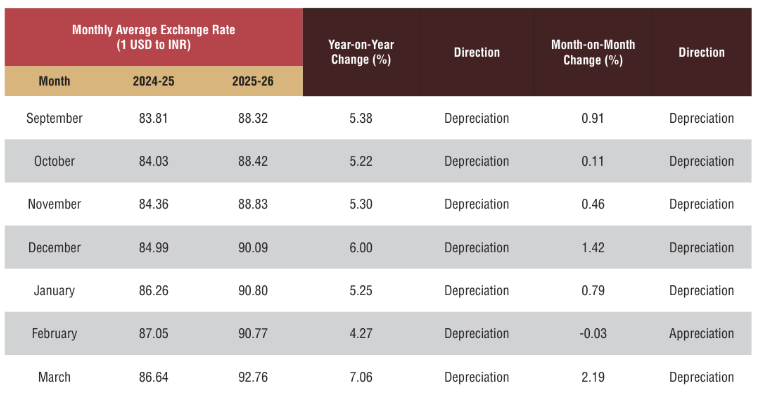
Fig 2: Trend of Rupee vis-a-vis US dollar from April 2021 (Monthly Average Rate of FBIL has been considered)
Source: FBIL
ANALYSIS OF INDIA’S ENGINEERING IMPORTS
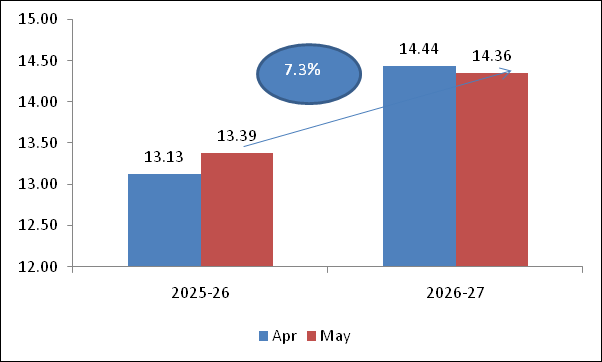
- India’s Engineering imports during May 2026 were valued at US$ 14.4 billion compared to US$ 13.4 billion in May 2025 registering a positive growth of 7.3 percent in dollar terms. In cumulative terms (Apr‑May 2026), India’s imports increased by 8.6 percent.
- In May 2026, imports increased sharply for Two and Three Wheelers ,Bicyle& parts, Tin & Products made of Tin, Motor Vehicle/Cars, Electric machinery &equipments, Aluminium & Aluminium products, and Copper and its products along with increase in, Aircraft & parts and other Construction machinery.
- In May 2026, import increased from all region, with significant imports from Latin America, Oceania, South Asia, ASEAN, NE Asia ,SSA( Sub Saharan Africa), and Others. In cumulative terms, imports increased from all regions barring CIS, WANA and North America.
- The share of engineering imports in India’s total merchandise imports in Apr‑May 2026 was estimated at 32.4 percent.
- 41.6 % of India’s engineering imports come from N E Asia and 20.1 % from the EU. The next major suppliers are ASEAN (13.2%), North America (7.6%) and WANA (6.2%) during Apr‑ May 2026.
Fig 3: Monthly Engineering Imports for April-May 2026-27 vis-a-vis April-May2025-26
TREND IN ENGINEERING TRADE BALANCE
We now present the trend in two‑way yearly trade for the engineering sector for the 2026‑27 depicted in the table below:
Table 12: Monthly Trend in Engineering Trade Balance for the current FY 2026-27 (US$ Billions)

Source: DGCI&S, EEPC India Analysis
CONCLUSION:
India’s engineering exports gave a stellar performance in May 2026 as it reached a monthly all‑time high of USD 12.3 billion and recorded a substantial growth of 24.5 percent. This performance was possible at a time when the exporting community is navigating a complex global environment marked by slower growth, geopolitical uncertainty, supply‑chain realignment, and protectionist trade behavior in several major markets. At the same time, the global economy is still being shaped by uneven recovery, high borrowing costs in some economies, and fragile manufacturing demand.
The broader trade setting in the world remains mixed. Many economies are still managing inflation, weak consumer demand, and trade fragmentation. Companies are also reworking supply chains to reduce overdependence on any single country, especially China. For India, that means there is room to expand, but only if exporters can improve scale, quality, logistics, and compliance with destination‑ country standards. In this regard, the support of the Ministry of Commerce and Industry is of utmost importance for the Indian exporters.
Faster policy relief, cheaper trade finance, and stronger risk protection is the need of the hourto help exporters absorb the shock of volatile global markets. While we are thankful to the government for the announcement of the Export promotion Mission, faster implementation of the scheme would be of much benefit for the exporters. Overall, India’s engineering export story is one of cautious optimism. We are positive that with the proper guidance of the Government we will be able to achieve the desired export target of USD 250 billion by 2030.
ANNEXURE-I
ENGINEERING PRODUCT PANELS – COUNTRY-WISE ANALYSIS
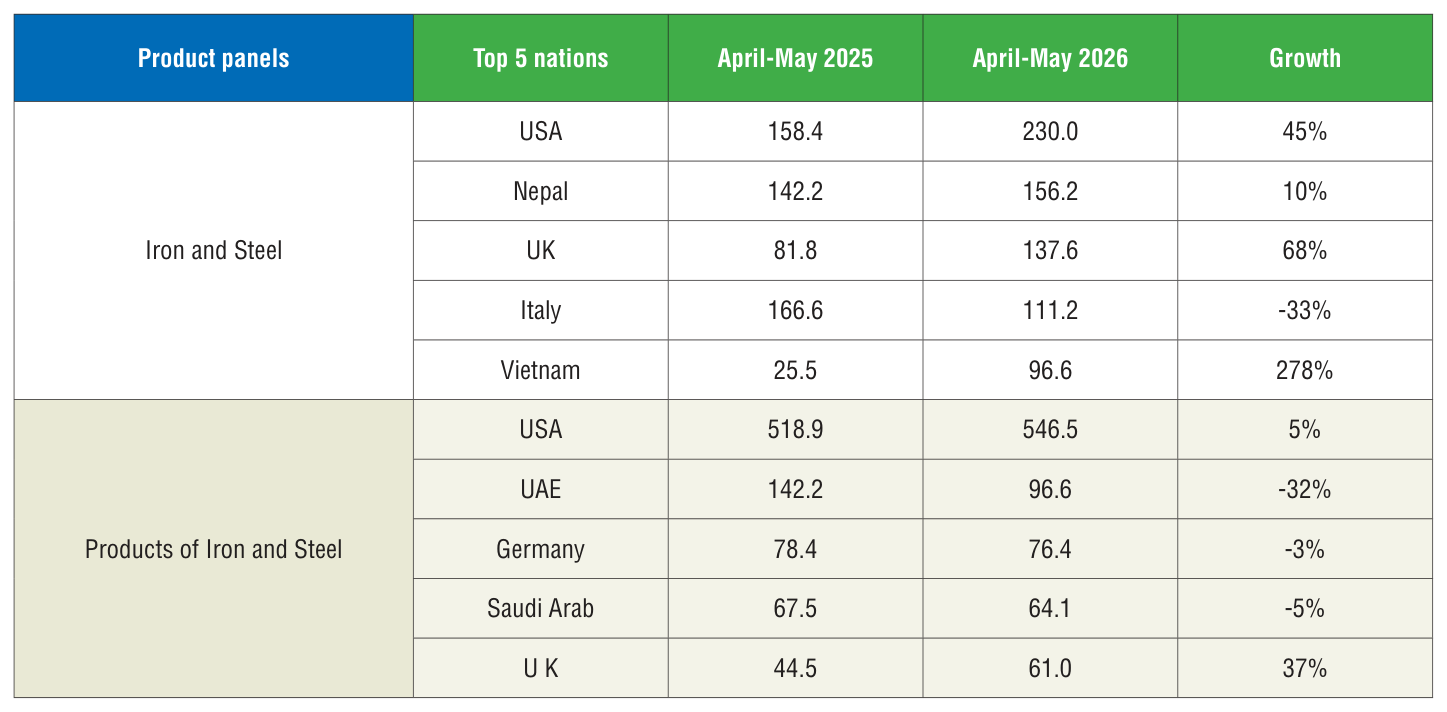
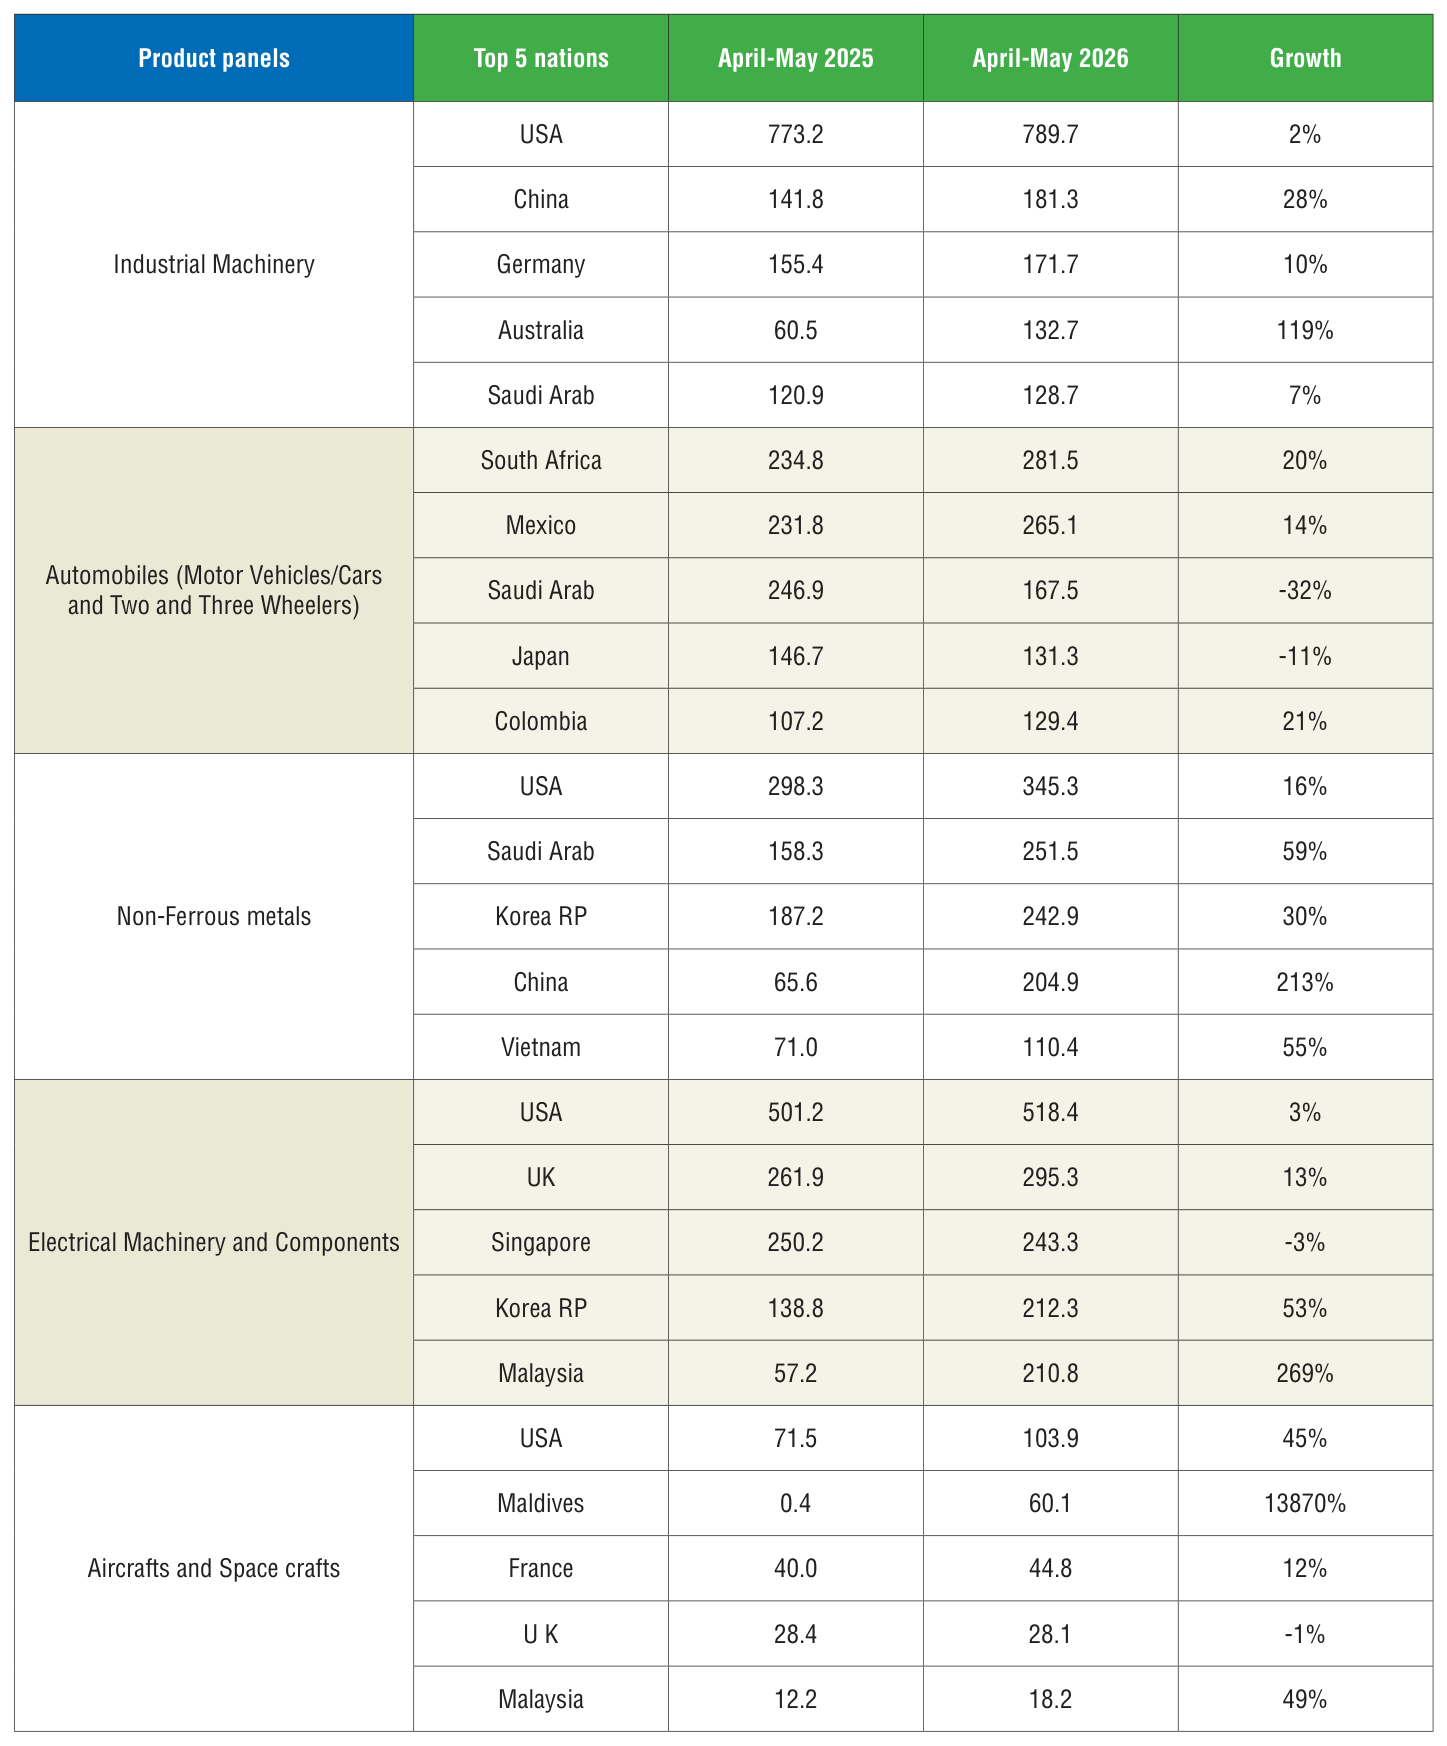
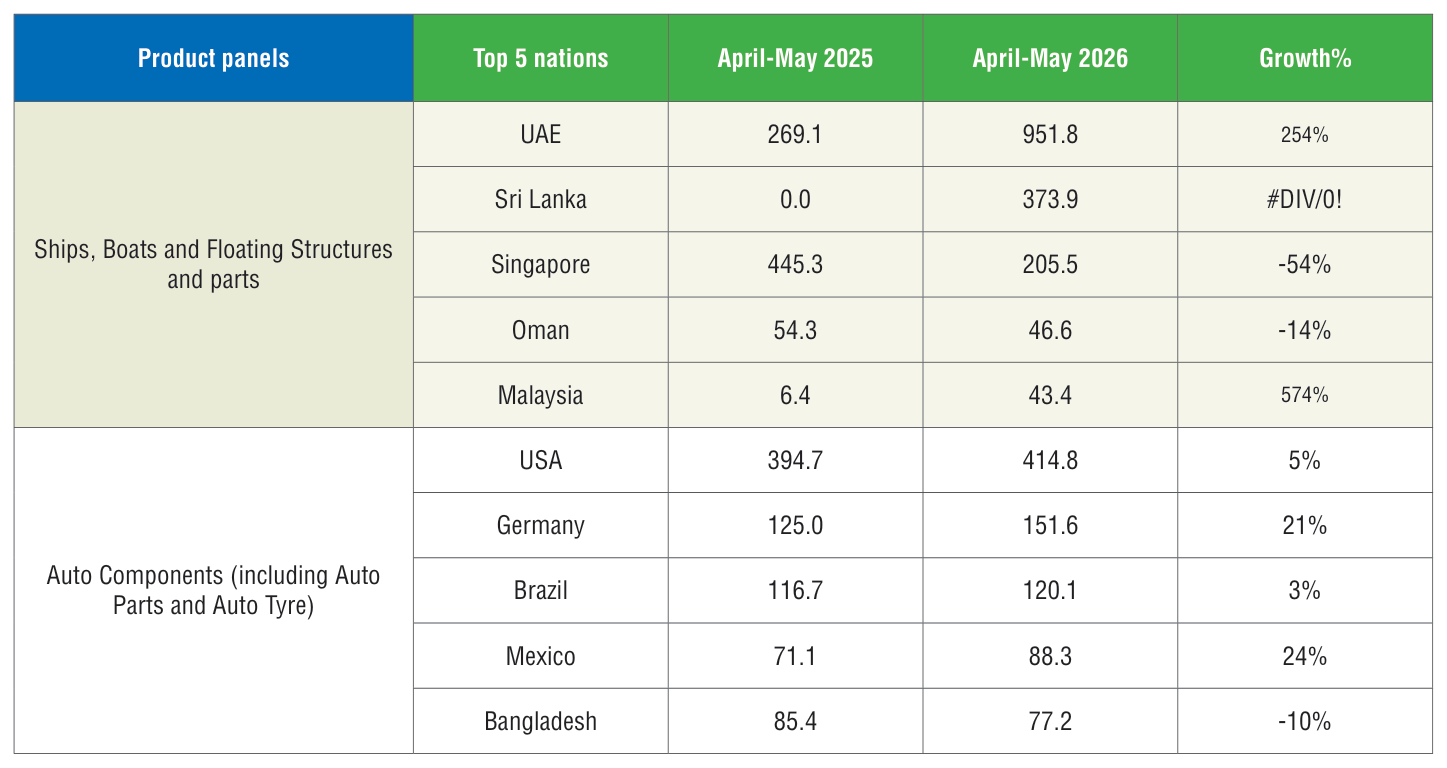
We now analyze the performance of some of the important products for the fiscal April‑May 2026 vis‑à‑vis April‑ May 2025. We have taken the major panels and computed the top importers to get an idea of the current trade pattern.
Engineering Product Panel - Country matrix (Value in US$ million)
Source: DGCI&S
- In April‑May 2026, USA, Nepal andUK ranked as the top importers of Indian Iron and Steel, while the USA, UAE and Germany lead in import of products of Iron & Steel.
- The USA stood out as the primary importer of Indian ‘Industrial machinery,’ making up 21% of India’s global exports in this category, followed by China and Germany with 5% ad 5% shares, respectively.
- South Africa, Mexico and Saudi Arab were top importers of India’s Automobiles during Arab were top importers of India’s Automobiles during exports respectively over the same period previous fiscal.
- USA, Saudi Arab and South Korea were the top three importers of India’s Nonferrous metals and products during April‑May 2026.
- USA, UK and Singapore were the top importers of Indian Electrical Machinery & Components during the same period with 18%, 10% and 8% shares, respectively.
- USA, Maldives, France and UK were the top importers of India’s Aircrafts and Spacecraft during April‑May 2026, making up to 68% of India’s total export of Aircrafts and Spacecraft
- UAE, Sri Lanka and Singaporebecame the largest importer of ships, boats and floating structures during April‑ May 2026 in India’s global exports respectively over the same period previous fiscal.
- For the auto components’ product group, USA remained the top importer in April‑May 2026 followed by Germany, Brazil, Mexico and Bangladesh.

© Copyright , All rights reserved. Design by Andreal