


VOL. 18, ISSUE NO. 4 | July 2025
Oversight


| Trade Flow | Export figures (in US$ billion) | Growth (%) | ||||
|---|---|---|---|---|---|---|
| May-2024 | May-2025 | Apr - May 2023-24 | Apr - May 2024-25 | May 2025 over May 2024 | Apr-May 2025 over Apr-May 2024 | |
| Engineering exports | 9.97 | 9.89 | 18.52 | 19.40 | -0.82% | 4.77% |
| Overall merchandise exports | 39.59 | 38.73 | 74.89 | 77.19 | -2.17% | 3.07% |
| Share of engineering (%) | 25.18% | 25.53% | 24.72% | 25.13% | --- | --- |
| Service Exports | 29.61 | 32.39 | 59.79 | 65.24 | 9.39% | 9.12% |
Source: Compiled from data by DGCI&S and Quick Estimates published by the Government of India.
After achieving a high growth of 11.28 percent year-on-year in April 2025, Indian engineering exports conceded a marginal 0.82 percent decline in May 2025 over the same month last fiscal. Engineering exports from India in May 2025 was recorded at USD 9,887.01 million as against USD 9,968.45 million in May 2024. Although, engineering exports was higher in May 2025 in comparison to April 2025, the year-on-year decline in May 2025 was due to higher statistical base. Among the major product groups, exports of ‘Aircraft, Spacecrafts and Parts’ slumped by 85 percent and that of ‘Ships, Boats and Floating Structures’ dropped by 25 percent year-on-year in May 2025 that mainly caused the decline in overall engineering exports. Country-wise analysis revealed that substantial decline in engineering exports to UAE and Saudi Arabia among the top exporting countries impacted overall engineering exports negatively.
HIGHLIGHTS
- After achieving a high growth of 11.28 percent year-on-year in April 2025, Indian engineering exports conceded a marginal 0.82 percent decline in May 2025 over the same month last fiscal.
- Engineering exports from India in May 2025 was recorded at USD 9,887.01 million as against USD 9,968.45 million in May 2024, registering 0.82 percent drop in shipment.
- Engineering exports was higher in May 2025 in comparison to April 2025 but the year-on-year decline in May 2025 was due to higher statistical base.
- On a cumulative basis however, India’s engineering export recorded 4.77 percent growth as it went up to USD 19,398.58 million during Apr-May 2025-26 from USD 18,516.06 million during the same period last fiscal.
- According to the Quick Estimates of Department of Commerce, Government of India, share of engineering in India’s total merchandise exports increased to 25.53 percent in May 2025 from 24.71 percent in April 2025.
- On a cumulative basis, share of engineering in total merchandise exports druing Apr-May 2025-26 stood at 25.13 percent.
- In May 2025, 26 out of 34 engineering panels witnessed positive year-on-year growth. While 8 engineering panels including mainly Non ferrous metals like Aluminium, Zinc, Lead, Tin, Machine Tools, Aircrafts and Spacecrafts, Ship and Boats, etc witnessed decline in exports during May 2025 vis-à-vis May 2025.
- On a cumulative basis, 29 out of 34 engineering panels recorded positive growth and remaining 5 engineering panels including Non-ferrous sectors including Aluminium products, Zinc products, Aircraft and Spacecrafts, Cranes and Winches recorded negative growth during April-May 2025-26.
- Region wise, North America maintained itsspot as the number one export destination with a share of 21.3% followed by EU (17.7%) and WANA (14.3%) in Apr-May 2025. Significant export growth was noted in Oceania (26.8%), SSA (24.1%) and ASEAN (8.8%)in May 2025.
- Country-wise, USA remained the top destinations followed by UAE and Singapore in May 2025 while maximum increase was noted in Belgium (54.3%), Netherlands (51.3%), Nepal (30.1%) and Singapore (29.2%).
ENGINEERING EXPORTS: MONTHLY TREND
The monthly engineering figures for 2025-26 vis-à-vis 2024-25 are shown below as per the latest DGCI&S estimates:
Table 1: Engineering Exports: Monthly Trend in 2025-26 (Values in USD Million)
| Month | 2024-25 | 2025-26 | Growth (%) |
|---|---|---|---|
| April | 8547.61 | 9511.56 | 11.28 |
| May | 9968.45 | 9887.01 | -0.82 |
| April – May | 18516.06 | 19398.58 | 4.77 |
Source: DGCI&S, Govt. of India
TOP 25 ENGINEERING EXPORT DESTINATIONS IN MAY 2025
We now look at the export scenario of the top 25 nations that had highest demand for Indian engineering products during May 2025 over May 2024 as well as in cumulative terms during April-May 2025-26 vis-à-vis April-May 2024-25. The data clearly shows that top 25 countries contribute 75.5% of total engineering exports.
Table 2: Engineering exports country-wise (Values in USD Million)
| Countries | May 2024 | May 2025 | Growth (%) | April-May 2023-24 | April-May 2024-25 | Growth (%) |
|---|---|---|---|---|---|---|
| USA | 1659.09 | 1735.42 | 4.6% | 3077.07 | 3396.85 | 10.4% |
| UAE | 811.20 | 683.38 | -15.8% | 1203.73 | 1222.20 | 1.5% |
| SINGAPORE | 283.74 | 366.50 | 29.2% | 659.37 | 865.00 | 31.2% |
| GERMANY | 353.21 | 429.39 | 21.6% | 677.12 | 762.63 | 12.6% |
| SAUDI ARABIA | 587.01 | 337.11 | -42.6% | 1022.76 | 731.55 | -28.5% |
| UK | 349.59 | 388.34 | 11.1% | 650.57 | 723.64 | 11.2% |
| ITALY | 253.97 | 274.69 | 8.2% | 563.75 | 542.99 | -3.7% |
| MEXICO | 317.92 | 281.76 | -11.4% | 614.37 | 525.71 | -14.4% |
| KOREA RP | 202.58 | 219.44 | 8.3% | 411.91 | 473.20 | 14.9% |
| JAPAN | 197.66 | 215.07 | 8.8% | 371.32 | 446.40 | 20.2% |
| NEPAL | 174.41 | 226.94 | 30.1% | 346.16 | 434.51 | 25.5% |
| BRAZIL | 199.87 | 216.08 | 8.1% | 365.44 | 427.74 | 17.0% |
| SOUTH AFRICA | 165.47 | 190.01 | 14.8% | 296.15 | 387.68 | 30.9% |
| CHINA | 218.59 | 207.36 | -5.1% | 429.04 | 373.03 | -13.1% |
| NETHERLAND | 141.78 | 217.95 | 53.7% | 279.53 | 370.67 | 32.6% |
| TURKEY | 457.51 | 176.28 | -61.5% | 676.71 | 368.81 | -45.5% |
| BANGLADESH | 179.96 | 185.84 | 3.3% | 328.14 | 352.36 | 7.4% |
| FRANCE | 153.29 | 190.77 | 24.5% | 306.18 | 351.66 | 14.9% |
| THAILAND | 164.59 | 191.60 | 16.4% | 317.18 | 350.34 | 10.5% |
| INDONESIA | 153.46 | 173.36 | 13.0% | 272.25 | 294.43 | 8.1% |
| BELGIUM | 93.74 | 144.68 | 54.3% | 241.58 | 290.39 | 20.2% |
| AUSTRALIA | 103.11 | 131.25 | 27.3% | 195.96 | 262.77 | 34.1% |
| SPAIN | 115.58 | 117.28 | 1.5% | 212.80 | 244.18 | 14.7% |
| VIETNAM | 130.26 | 116.51 | -10.6% | 246.72 | 233.91 | -5.2% |
| CANADA | 100.50 | 112.32 | 11.8% | 211.95 | 212.42 | 0.2% |
| Total engineering exports to top 25 countries | 7568.09 | 7529.31 | -0.5% | 13977.74 | 14645.05 | 4.8% |
| Total engineering exports | 9968.45 | 9887.01 | -0.8% | 18516.06 | 19398.58 | 4.8% |
Source: DGCI&S
REGION WISE INDIA’S ENGINEERING EXPORTS
The following table depicts region wise India’s engineering exports for April-May 2025 as compared to April-May 2024
Table 3: Region wise engineering exports in April-May 2025-26 vis-à-vis April-May 2024-25 (Values in USD Million)
| Region | May-24 | May-25 | Growth (%) | Apr'23 - May'24 | Apr'24 - May'25 | Growth (%) |
|---|---|---|---|---|---|---|
| NORTH AMERICA | 2077.51 | 2129.50 | 2.5% | 3903.39 | 4134.97 | 5.9% |
| EUROPEAN UNION | 1561.55 | 1779.67 | 14.0% | 3158.62 | 3435.50 | 8.8% |
| WANA | 1904.20 | 1427.85 | -25.0% | 3045.03 | 2770.35 | -9.0% |
| ASEAN | 929.75 | 1011.86 | 8.8% | 1951.10 | 2166.10 | 11.0% |
| N E ASIA | 712.78 | 747.07 | 4.8% | 1383.83 | 1496.61 | 8.1% |
| SSA (Sub Saharan Africa) | 616.78 | 765.34 | 24.1% | 1139.11 | 1452.94 | 27.6% |
| OTHER EUROPE | 869.44 | 602.78 | -30.7% | 1448.84 | 1177.13 | -18.8% |
| LATIN AMERICA | 550.66 | 593.91 | 7.9% | 995.27 | 1159.71 | 16.5% |
| SOUTH ASIA | 499.21 | 549.32 | 10.0% | 975.95 | 1053.28 | 7.9% |
| OCEANIA | 114.57 | 145.31 | 26.8% | 220.07 | 288.63 | 31.2% |
| CIS | 130.54 | 125.29 | -4.0% | 292.50 | 243.42 | -16.8% |
| OTHERS | 1.47 | 9.10 | 519.5% | 2.33 | 19.93 | 753.6% |
| Grand Total | 9968.45 | 9887.01 | -0.8% | 18516.06 | 19398.58 | 4.8% |
Source: DGCI&S
Note: Myanmar has been included in ASEAN and not in South Asia, since ASEAN is a formal economic grouping.
PANEL WISE INDIA’S ENGINEERING EXPORTS
In this section we look at the Engineering Panel wise exports for the month of May 2025 vis-à-vis May 2024 as well as the cumulative exports for April-May 2025-26 vis-à-vis April-May 2024-25. These are indicated in the tables below.
| Product panels | April 2024 | April 2025 | Growth (%) | |||
|---|---|---|---|---|---|---|
| Ferrous | ||||||
| Iron and Steel | 843.8 | 851.8 | 1% | |||
| Products of Iron and Steel | 730.9 | 771.7 | 6% | |||
| Sub Total | 1574.7 | 1623.5 | 3% | |||
| Product panels | May 2024 | May 2025 | Growth (%) | April-May 2024-25 | April-May 2025-26 | Growth (%) |
| Ferrous | ||||||
| Iron and Steel | 748.3 | 772.7 | 3% | 1592.1 | 1624.6 | 2% |
| Products of Iron and Steel | 820.4 | 877.2 | 7% | 1551.3 | 1648.3 | 6% |
| Sub Total | 1568.8 | 1649.9 | 5% | 3143.4 | 3272.8 | 4% |
| Non-ferrous | ||||||
| Copper and products | 159.4 | 191.1 | 20% | 287.1 | 373.3 | 30% |
| Aluminium and products | 598.1 | 538.7 | -10% | 1127.7 | 1033.8 | -8% |
| Zinc and products | 83.8 | 56.8 | -32% | 150.4 | 107.4 | -29% |
| Nickel and products | 12.1 | 13.1 | 8% | 25.3 | 26.5 | 5% |
| Lead and products | 84.3 | 81.7 | -3% | 147.4 | 157.7 | 7% |
| Tin and products | 2.3 | 2.3 | -2% | 3.5 | 4.0 | 13% |
| Other Non-Ferrous Metals | 68.6 | 87.6 | 28% | 129.5 | 169.4 | 31% |
| Sub Total | 1008.6 | 971.2 | -4% | 1871.0 | 1871.9 | 0.1% |
| Industrial Machinery | ||||||
| Industrial Machinery like Boilers, parts, etc. | 54.0 | 65.4 | 21% | 119.9 | 179.3 | 50% |
| IC Engines and Parts | 301.9 | 364.9 | 21% | 589.2 | 690.2 | 17% |
| Pumps of all types | 126.9 | 128.0 | 1% | 235.0 | 248.4 | 6% |
| Air condition and Refrigerators | 147.0 | 189.7 | 29% | 283.7 | 377.3 | 33% |
| Industrial Machinery for dairy, food processing, Textiles etc | 674.1 | 760.0 | 13% | 1359.6 | 1457.7 | 7% |
| Machine Tools | 68.5 | 62.9 | -8% | 128.5 | 129.0 | 0% |
| Machinery for injecting moulding, valves and ATMs | 233.8 | 252.7 | 8% | 440.2 | 495.0 | 12% |
| Sub Total | 1606.4 | 1823.6 | 14% | 3156.0 | 3576.9 | 13% |
| Electrical Machinery | ||||||
| Electrical Machinery | 1138.3 | 1303.4 | 15% | 2169.7 | 2495.7 | 15% |
| Automobile and auto component | ||||||
| Motor Vehicle/cars | 723.9 | 859.8 | 19% | 1326.6 | 1682.3 | 27% |
| Two and Three Wheelers | 268.5 | 300.9 | 12% | 516.8 | 563.4 | 9% |
| Auto Components/Part | 710.0 | 729.6 | 3% | 1315.2 | 1383.1 | 5% |
| Auto Tyres and Tubes | 281.5 | 283.2 | 1% | 534.7 | 540.1 | 1% |
| Sub Total | 1983.8 | 2173.5 | 10% | 3693.3 | 4168.9 | 12.9% |
| Aircrafts and related products | ||||||
| Aircrafts and Spacecraft parts and products | 858.5 | 125.6 | -85% | 1139.2 | 254.1 | -78% |
| Ships Boats and Floating products and parts | ||||||
| Ships Boats and Floating products and parts | 524.0 | 392.3 | -25% | 789.2 | 901.4 | 14% |
| Miscellaneous engineering products | ||||||
| Medical and Scientific instruments | 208.7 | 248.4 | 19% | 402.5 | 474.5 | 18% |
| Railway Transport | 21.8 | 32.8 | 50% | 53.0 | 63.3 | 19% |
| Hand Tools & Cutting Tools | 83.1 | 88.9 | 7% | 160.6 | 177.7 | 11% |
| Bicycle & Parts | 33.5 | 40.6 | 21% | 61.6 | 76.8 | 25% |
| Cranes Lifts & Winches | 92.5 | 93.1 | 1% | 187.4 | 174.7 | -7% |
| Office Equipment | 24.0 | 31.8 | 32% | 42.6 | 56.1 | 32% |
| Other Construction Machinery | 265.0 | 311.5 | 18% | 507.9 | 580.2 | 14% |
| Prime Mica & Mica Products | 2.6 | 3.5 | 31% | 4.9 | 6.3 | 29% |
Source: DGCI&S
Reasons for Decline (As per April-May 2025-26)
Aluminium
- The decline in aluminium exports is mainly due to fall in exports to the ASEAN countries: Vietnam (-57%), Thailand (-18%), Malaysia (-57%) and Indonesia (-17%)
- The decline in ASEAN can be explained by rising aluminium production capacity in the region - Indonesia is focussing on expanding its overall capacity and supply chain. As of 2025, Indonesia has 11 alumina projects under construction or planned, with a total capacity of 25.5 million mt. Other such investments in both alumina and aluminium projects are being planned. On the other hand Malaysia is focusing on expanding its smelting capacity. Also, changes in policy in China towards green production process, scrap generation is also increasing in ASEAN
- The decline in Turkey again may be due to the growing geopolitical tensions between India and Turkey and also growing conflicts in the Middle East and West Asia region.
- The decline in Bangladesh (-25%) is mainly due to export restrictions put by both countries
- Another major reason behind India’s falling aluminium exports is the rising domestic demand – as per latest report, India’s domestic aluminium demand experienced a growth, especially in the secondary aluminium sector prices rose due to growing demand and inadequate supply.
Zinc
- The decline is mainly due to decline in the ASEAN region - The zinc exports in ASEAN decline mainly due to increased competition from Indonesia which is the largest source in the region and has been increasing capacity. Increased competition is also coming from China

Table 5: Panel-wise shares in India’s total engineering exports during April-May 2025-26
| S. No | Product Panels | Apr'24 - May'24 (Share%) | Apr'25 - May'25 (Share %) |
|---|---|---|---|
| 1. Iron and Steel and Products made of Iron and Steel | |||
| A | Iron and Steel | 8.6% | 8.4% |
| B | Products of Iron and Steel | 8.4% | 8.5% |
| Sub Total | 17% | 17% | |
| 2. Non-Ferrous Metals and Products made of Non-Ferrous Metals | |||
| A | Copper and products | 1.6% | 1.9% |
| B | Aluminium and products | 6.1% | 5.3% |
| C | Zinc and products | 0.8% | 0.6% |
| D | Nickel and products | 0.1% | 0.1% |
| E | Lead and products | 0.8% | 0.8% |
| F | Tin and products | 0% | 0% |
| G | Other Non-Ferrous Metals | 0.7% | 0.9% |
| Sub Total | 10.1% | 9.6% | |
| 3. Industrial Machinery | |||
| A | Industrial Machinery like Boilers, parts, etc | 1% | 1% |
| B | IC Engines and Parts | 3.2% | 3.6% |
| C | Pumps of all types | 1% | 1% |
| D | Air condition and Refrigerators | 1.5% | 1.9% |
| E | Industrial Machinery for dairy, food processing, textiles etc | 7% | 8% |
| F | Machine Tools | 0.7% | 0.7% |
| G | Machinery for injecting moulding, valves and ATMs | 2% | 3% |
| Sub Total | 17.0% | 18.4% | |
| 4. Electrical Machinery | |||
| Electrical Machinery | 12% | 13% | |
| 5. Automobiles | |||
| A | Motor Vehicle/cars | 7% | 9% |
| B | Two and Three Wheelers | 3% | 3% |
| C | Auto Components/Part | 7% | 7% |
| D | Auto Tyres and Tubes | 3% | 3% |
| Sub Total | 20% | 21% | |
| 6. Aircrafts and Spacecraft parts and products | |||
| Aircrafts and Spacecraft parts and products | 6% | 1% | |
| 7. Ships Boats and Floating products and parts | |||
| Ships Boats and Floating products and parts | 4% | 5% | |
| 8. Project Goods | |||
| Project Goods | 0% | 0% | |
| 9. Other Rubber Product Except Footwear | |||
| Other Rubber Product Except Footwear | 2% | 2% | |
| 10. Other engineering products | |||
| A | Medical and Scientific instruments | 2% | 2% |
| B | Railway Transport | 0% | 0% |
| C | Hand Tools & Cutting Tools | 1% | 1% |
| D | Bicycle & Parts | 0% | 0% |
| E | Cranes Lifts & Winches | 1% | 1% |
| F | Office Equipments | 0% | 0% |
| G | Other Construction Machinery | 3% | 3% |
| H | Prime Mica & Mica Products | 0% | 0% |
| I | Other Misc. Items | 5% | 5% |
| Sub total | 12% | 13% | |
| Total engineering exports | 100% | 100% | |
Source: DGCI&S
ENGINEERING EXPORTS STATE-WISE ANALYSIS
State wise engineering export performance- Data as on 2024-25 (Note: Current fiscal 2025-26 data not yet updated as per Niryat Portal)
The table below indicates the exports from top Indian states. It is evident from the table that almost 91.5% of India’s exports is contributed by the listed 12 states. Within this almost 50 percent of exports is done by Maharashtra, Tamil Nadu and Gujarat together.
Table 6: Top state wise engineering export performance – April-March 2024-25 (Values in USD Million)
| Top States | 2023-24 | 2024-25 | Growth% | %Share in India's Eng Export | Remark |
|---|---|---|---|---|---|
| Maharashtra | 22992.9 | 22546.4 | -1.9% | 19.7% | 91.5% share covered by top 12 states |
| Tamil Nadu | 16844.6 | 18108.6 | 7.5% | 15.8% | |
| Gujarat | 14753.3 | 16590.5 | 12.5% | 14.5% | |
| Telangana | 3458.0 | 7536.2 | 117.9% | 6.6% | |
| Karnataka | 6709.1 | 7277.3 | 8.5% | 6.3% | |
| Haryana | 6753.8 | 6764.5 | 0.2% | 5.9% | |
| Odisha | 7125.2 | 5910.1 | -17.1% | 5.2% | |
| Delhi | 4599.7 | 4684.5 | 1.8% | 4.1% | |
| Uttar Pradesh | 4117.9 | 4348.7 | 5.6% | 3.8% | |
| Andhra Pradesh | 4885.6 | 4319.4 | -11.6% | 3.8% | |
| West Bengal | 3134.8 | 3523.7 | 12.4% | 3.1% | |
| Rajasthan | 3405.3 | 3375.7 | -0.9% | 2.9% |
- Top 12 states constitute over 91.5% of India’s engineering Exports. Once again, Karnataka maintained its 5th position, Telengana retained its 4th position, Odisha coming down to 7th position, West Bengal coming down to 11th position, while Rajasthan moving up to 12th position and Haryana remarkably moved up to 6th position during the fiscal April-March 2024-25 compared to the same period last fiscal.( as per estimates of Niryat Portal)
- Major negative growth witnessed in states like Maharashtra (decline by 1.9%), Odisha, ( decline by 17.1%), Andhra Pradesh (decline by 11.6%) and Rajasthan (decline by 0.9%) during April- March 2024-25 compared to the same period last fiscal.
- Maharashtra being the highest state in terms of Engineering Goods exports ( constituting a share of 19.7%) is leading by US$ 4.44 billion from Tamil Nadu(Second Highest State) for the period of April-March 2024-25.
INDIA’S REGION WISE ENGINEERING EXPORTS
In terms of region, western region which includes industrial states like Maharashtra and Gujarat is the front runner in terms of exports with 34.1 percent share. Tamil Nadu from the Southern Region has retained its export performance and it ranked second after Maharashtra, while Gujarat and Telengana ranked third and fourth during April-March 2024-25.
Table 7: Region wise exports from India (Values in USD Million)
| Region | 2023-24 | 2024-25 | Growth% |
|---|---|---|---|
| EASTERN REGION | 12236.7 | 11089.7 | -4.3% |
| NORTHERN REGION | 22651.0 | 22571.4 | -64.6% |
| SOUTHERN REGION | 33012.2 | 38262.6 | 22.2% |
| WESTERN REGION | 41415.4 | 42797.8 | 4.6% |
Source: NIRYAT portal
CORRELATION BETWEEN MANUFACTURING PRODUCTION AND ENGINEERING EXPORTS
Engineering forms a considerable part of the broader manufacturing sector and the share of engineering production in overall manufacturing output is quite significant. As exports generally come from what is produced within a country, some correlation between manufacturing production growth and engineering export growth should exist. We briefly look at the trend in manufacturing growth as also engineering export growth to see if they move in tandem. It may be mentioned that manufacturing has 77.63% weightage in India’s industrial production.
Engineering export growth and manufacturing output growth moved in the same direction in as many as nine out of twelve months in each of the fiscal years 2019-20 and 2020-21. During fiscal 2021- 22, engineering export growth and manufacturing growth moved in the same direction in seven out of twelve monthswhile in each of fiscal 2022-23 and 2023-24, as many as 10 out of 12 months saw engineering exports and manufacturing output moved in the same direction. In 2024-25, both moved in the same direction in eight out of 12 months.
The first month of fiscal 2025-26 saw engineering export growth surged to double digit while manufacturing growth decelerated.
The link between these two may not be established in one or two months, but a positive correlation may be seen if medium to long term trend is considered.
Table 8: Engineering exports growth vis-à-vis manufacturing growth from April 2022
| Months/Year | Eng. Export Growth (%) | Manufacturing Growth (%) |
|---|---|---|
| May 2023 | -4.25 | 6.3 |
| June 2023 | -11.12 | 3.5 |
| July 2023 | -6.91 | 5.3 |
| August 2023 | 7.66 | 10.0 |
| September 2023 | 6.50 | 5.1 |
| October 2023 | 6.99 | 10.6 |
| November 2023 | -3.48 | 1.3 |
| December 2023 | 9.82 | 4.6 |
| January 2024 | 4.20 | 3.6 |
| February 2024 | 15.90 | 4.9 |
| March 2024 | 10.66 | 5.9 |
| April 2024 | -4.49 | 4.2 |
Source: Department of Commerce and CSO
| Months/Year | Eng. Export Growth (%) | Manufacturing Growth (%) |
|---|---|---|
| May 2024 | 7.43 | 5.1 |
| June 2024 | 10.26 | 3.5 |
| July 2024 | 5.12 | 4.7 |
| August 2024 | 4.28 | 1.2 |
| September 2024 | 10.55 | 4.0 |
| October 2024 | 39.27 | 4.4 |
| November 2024 | 13.72 | 5.5 |
| December 2024 | 8.33 | 3.7 |
| January 2025 | 7.49 | 5.8 |
| February 2025 | -8.64 | 2.8 |
| March 2025 | -3.92 | 4.0 |
| April 2025 | 11.28 | 3.4 |
IMPACT OF EXCHANGE RATE ON INDIA’S EXPORTS
How did the exchange rate fare during May 2025 and what was the recent trend in Re-Dollar movement? In order to get a clearer picture of the recent Re-Dollar trend, not only we took the exchange rate of May 2025, but also considered monthly average exchange rate of Rupee vis-à-vis the US Dollar for each month of fiscal 2023-24 and 2024-25 as per the latest data published, as mere one-month figure does not reflect any trend. The following two tables clearly depicts the short-term trend:
Table 9: USD-INR monthly average exchange rate in 2025-26 vis-à-vis 2024-25 (As per latest data released by FBIL)
| Monthly Average Exchange Rate (1 USD to INR) | Year-on-Year Change (%) |
Direction | Month-on-Month Change (%) |
Direction | ||
|---|---|---|---|---|---|---|
| Month | 2023-24 | 2024-25 | ||||
| April | 83.41 | 85.56 | 2.58 | Depreciation | -1.25 | Appreciation |
| May | 83.39 | 85.19 | 2.16 | Depreciation | -0.43 | Appreciation |
Rupee appreciated for the third straight month to May 2025 on a month-on-month basis but continued to depreciate on a year-on-year basis: INR appreciated visà-vis the US Dollar by 0.43 percent in May 2025 over the previous month as reciprocal tariff imposed by the USA has created panic about the US economic prospect in the short term leading to weakening of dollar. On a year-on-year basis however, rupee continued to weaken.
Outlook: According to a report by Bank of Baroda, the Indian rupee is expected to strengthen against theUS Dollar in the near term due to imporved domestic fundamental with renewed inward investmnts by foreign instituions suppoted by favourable global trends like weak dollar and falling oil prices. The report projects rupee to trade in the range of 84 – 85 per US Dollar in the near trem but any escalation in US-China trade relation may pose significant threat to rupee.
Table 10: USD-INR monthly average exchange rate in 2024-25 vis-à-vis 2023-24 (As per latest data released by FBIL)
| Monthly Average Exchange Rate (1 USD to INR) | Year-on-Year Change (%) |
Direction | Month-on-Month Change (%) |
Direction | ||
|---|---|---|---|---|---|---|
| Month | 2023-24 | 2024-25 | ||||
| April | 82.02 | 83.41 | 1.69 | Depreciation | 0.49 | Depreciation |
| May | 82.34 | 83.39 | 1.28 | Depreciation | -0.02 | Appreciation |
| June | 82.23 | 83.47 | 1.51 | Depreciation | 0.10 | Depreciation |
| July | 82.15 | 83.59 | 1.75 | Depreciation | 0.14 | Depreciation |
| August | 82.79 | 83.89 | 1.33 | Depreciation | 0.36 | Depreciation |
| September | 83.05 | 83.81 | 0.92 | Depreciation | -0.10 | Appreciation |
| October | 83.24 | 84.02 | 0.94 | Depreciation | 0.25 | Depreciation |
| November | 83.30 | 84.36 | 1.27 | Depreciation | 0.40 | Depreciation |
| December | 83.28 | 84.99 | 2.05 | Depreciation | 0.75 | Depreciation |
| January | 83.14 | 86.27 | 3.76 | Depreciation | 1.51 | Depreciation |
| February | 82.96 | 87.05 | 4.93 | Depreciation | 0.90 | Depreciation |
| March | 83.00 | 86.64 | 4.39 | Depreciation | -0.47 | Appreciation |
Fig 2: Trend of Rupee vis-a-vis US dollar from April 2021 (Monthly Average Rate of FBIL has been considered)
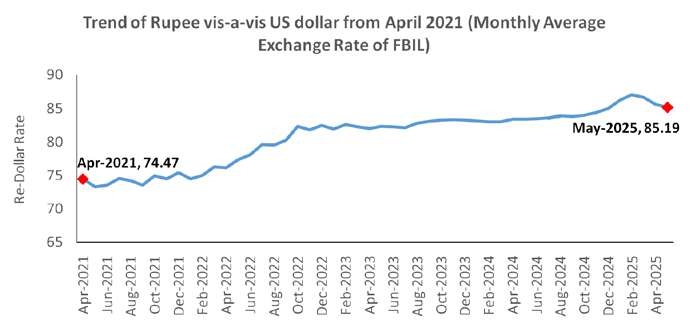
Source: FBIL
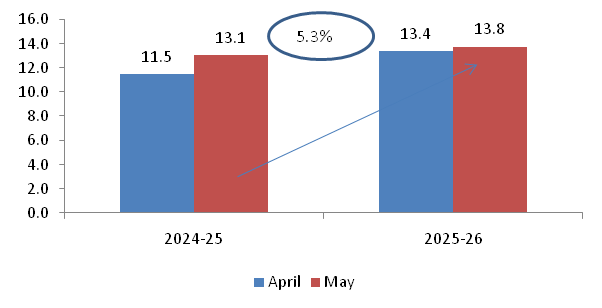
ANALYSIS OF INDIA’S ENGINEERING IMPORTS
India’s Engineering imports during May 2025 were valued at US$ 13.8 billion compared to US$ 13.1 billion in May 2024 registering a positive growth of 5.3 percent in dollar terms. Barring Transport Equipments, all the sectors witnessed a rise in import during May 2025 compared to May 2024 registering positive growth over the same period. The share of engineering imports in India’s total merchandise imports in May 2025 was estimated at 22.8 percent, higher than that of May 2024 which was estimated at 21.2 %. The figure below depicts engineering imports for May 2025 compared to May 2024.
| Values in US$ MN | May '24 | May '25 | Growth % | April-May '24 | April-May '25 | Growth % |
|---|---|---|---|---|---|---|
| India's Engineering Imports | 13077.9 | 13846.2 | 5.3% | 24610.8 | 27205.9 | 10.5% |
Fig 3: Monthly Engineering Imports for April-May 2025-26 vis-a-vis April-May 2024-25
TREND IN ENGINEERING TRADE BALANCE
We now present the trend in two-way yearly trade for the engineering sector for the 2025-26 depicted in the table below:
| Trade Flow (US$ Billions) | Apr | May |
|---|---|---|
| Engineering Export | 9.5 | 9.9 |
| Engineering Import | 13.4 | 13.8 |
| Trade Balance | -3.9 | -3.9 |
CONCLUSION
After a remarkable growth phase, India’s engineering exports experienced a marginal decline of 0.82% for the first time in May 2025. During this period India’s overall merchandise exports also declined by more than 2%. While India’s engineering exports to US and EU grew, significant decline was noted in UAE, Saudi Arabia and Turkey, which are significant markets for India and feature prominently in India’s top 25 destinations. The decline can be explained by the growing geopolitical tensions in the area and the rising threat to logistics. Exports of aluminium and its products was also hit due to increased competition in the ASEAN region. Decline was also noted in exports of metals like zonc and led and aircrafts, scpacecrafts and parts.
The global trade is currently going through a phase of uncertainty. The Euroean Central Bank has revised the global trade growth down by 0.4% to reach 3.1%. They have also revised down the global trade growth in 2026 to 1.7% after which it is expected to grow. The reasons behind this dismal trade performance is explained by the growing geopolitical tensions across Middle East and West Asia, policy uncertainty in the US and protectioist measures by some of the major markets. In these circumatsnces, India has to adopt a cautious approach. The guidance and support from the Ministry of Commerce and Industry would be crucial for the industry especially in developing new technologies in upcoming areas including rare earth magnets and exploring new markets.
ANNEXURE-I
ENGINEERING PRODUCT PANELS – COUNTRY-WISE ANALYSIS
We now analyze the performance of some of the important products for the fiscal April-May 2025-26 vis-à-vis April-May 2024-25. We have taken the major panels and computed the top importers to get an idea of the current trade pattern.
Engineering Product Panel - Country matrix Value in USD million
| Product panels | Top 5 nations | April-May 2024-25 | April-May 2025-26 | Growth% |
|---|---|---|---|---|
| Iron and Steel | Italy | 262.7 | 166.6 | -37% |
| USA | 58.8 | 158.4 | 170% | |
| Nepal | 99.3 | 142.2 | 43% | |
| Belgium | 114.3 | 117.6 | 3% | |
| UAE | 86.2 | 84.2 | -2% | |
| Products of Iron and Steel | USA | 473.6 | 518.9 | 10% |
| UAE | 81.0 | 142.2 | 75% | |
| Germany | 71.0 | 78.4 | 10% | |
| Saudi Arab | 108.6 | 67.5 | -38% | |
| Canada | 50.4 | 50.7 | 1% | |
| Industrial Machinery | USA | 664.4 | 774.1 | 17% |
| UAE | 144.3 | 210.0 | 46% | |
| Germany | 158.4 | 155.4 | -2% | |
| China | 161.2 | 141.8 | -12% | |
| Thailand | 124.8 | 140.8 | 13% | |
| Automobiles (Motor Vehicles/Cars and Two and Three Wheelers) | Saudi Arab | 241.8 | 246.9 | 2% |
| South Africa | 157.9 | 234.8 | 49% | |
| Mexico | 250.9 | 231.8 | -8% | |
| Japan | 98.0 | 146.7 | 50% | |
| UAE | 77.9 | 113.4 | 46% | |
| Non-Ferrous metals | USA | 235.0 | 298.4 | 27% |
| Korea RP | 180.2 | 187.2 | 4% | |
| Saudi Arab | 95.8 | 158.3 | 65% | |
| Taiwan | 47.9 | 89.0 | 86% | |
| Japan | 81.3 | 76.0 | -7% | |
| Electrical Machinery and Components | USA | 455.9 | 500.8 | 10% |
| UK | 161.9 | 263.0 | 62% | |
| Singapore | 203.8 | 250.9 | 23% | |
| Germany | 121.2 | 166.2 | 37% | |
| Korea RP | 90.9 | 138.8 | 53% | |
| Aircrafts and Space crafts | USA | 74.7 | 71.0 | -5% |
| France | 36.3 | 39.0 | 7% | |
| UK | 25.5 | 27.0 | 6% | |
| Singapore | 8.8 | 17.5 | 98% | |
| Germany | 13.8 | 13.7 | -1% | |
| Ships, Boats and Floating Structures and parts | Singapore | 234.8 | 446.0 | 90% |
| UAE | 305.9 | 269.1 | -12% | |
| Oman | 0.1 | 54.3 | - | |
| Togo | 0.0 | 46.8 | - | |
| Indonesia | 12.0 | 38.1 | 217% | |
| Auto Components (including Auto Parts and Auto Tyre) | USA | 394.7 | 394.7 | 0% |
| Germany | 108.3 | 125.0 | 15% | |
| Brazil | 106.0 | 116.7 | 10% | |
| Bangladesh | 66.8 | 85.4 | 28% | |
| UAE | 50.1 | 81.0 | 62% |
Source: DGCI&S
- In April-May 2025, Italy, USA and Nepal ranked as the top importers of Indian Iron and Steel, while the USA, UAE and Germany lead in import of products of Iron & Steel.
- The USA stood out as the primary importer of Indian ‘Industrial machinery,’ making up 22% of India’s global exports in this category, followed by UAE and Germany with 6% ad 4% shares, respectively.
- Saudi Arabia, South Africa, Mexico and Japan were top importers of India’s Automobiles during April-May 2025 in India’s global exports respectively over the same period previous fiscal.
- USA, South Korea and Saudi Arab were the top three importers of India’s Non-ferrous metals and products during April-May 2025.
- USA, UK, Singapore and Germany were the top importers of Indian Electrical Machinery & Components during the same period with 20%, 11%, 10% and 7% shares, respectively.
- USA, France,UK and Singapore were the top importers of India’s Aircrafts and Spacecraft during April-May 2025, making up to 61% of India’s total export of Aircrafts and Spacecraft.
- Singapore, UAE and Oman became the largest importer of ships, boats and floating structures followed by Togo and Indonesia.
- For the auto components’ product group, USA remained the top importer in April-May 2025 followed by Germany, Brazil, Bangladesh and UAE.


© Copyright , All rights reserved. Design by Andreal