


VOL. 18, ISSUE NO. 2 | May 2025
Focus


| Trade Flow | Export figures (in US$ billion) | Growth (%) | ||||
|---|---|---|---|---|---|---|
| Mar-2024 | Mar-2025 | Apr-Mar 2023-24 | Apr-Mar 2024-25 | Mar-2025 over Mar-2024 | Apr-Mar 2024-25 over Apr-Mar 2023-24 | |
| Engineering exports | 11.27 | 10.82 | 109.30 | 116.67 | -3.92% | 6.74% |
| Overall merchandise exports | 41.69 | 41.97 | 437.07 | 437.42 | 0.66% | 0.08% |
| Share of engineering (%) | 27.02% | 25.79% | 25.01% | 26.67% | --- | --- |
| Service Exports | 30.01 | 31.64 | 341.06 | 383.51 | 5.43% | 12.45% |
Source: Compiled from data by DGCI&S and Quick Estimates published by the Government of India.
ENGINEERING EXPORTS DURING 2024-25 – KEY TAKEAWAYS
- Engineering exports from India once again reached its all-time high at USD 116.67 billion in fiscal 2024-25 surpassing the previous high of USD 112.10 billion achieved in fiscal 2021-22.
- Engineering exports from India saw its all-time high five times in the last eleven fiscals.
- During 2024-25, engineering exports registered 6.74 percent year-on-year growth on its way to reach this record high. Exports were recorded at USD 109.30 billion in 2023-24.
- It is mention worthy in this regard that engineering exports outweighed the broader Merchandise Exports in terms of growth as India’s Merchandise exports saw a meagre 0.08 percent year-on-year growth in 2024-25 to reach USD 437.42 billion.
- As a consequence, share of engineering in India’s overall merchandise exports increased to 26.67 percent in 2024-25 from 25.01 percent in the previous fiscal.
- The performance of Indian engineering exports was really remarkable in 2024-25 as it came during a period of extreme global uncertainty following geo-political disturbances and economic slowdown in major developed and emerging nations, which was further aggravated by tariff escalation by the USA.
HIGHLIGHTS
- Despite achieving a record high figure in 2024-25, Indian engineering exports declined on a monthly basis in March 2025. Engineering exports in March 2025 was recorded at USD 10.82 billion as against USD 11.27 billion in March 2024, registering a decline of 3.92 percent year-on-year.
- According to the Quick Estimates of Department of Commerce, Government of India, share of engineering in India’s total merchandise exports increased to25.79 percent in March 2025 from 24.61 percent in February 2025. On a cumulative basis, the share was recorded at 26.67 percent during entire fiscal 2024-25 as against 25.01 percent in the previous fiscal.
- In March 2025, 27 out of 34 engineering panels witnessed positive year-on-year growth. While 13 engineering panels including mainly Iron and Steel and products, Copper, and products, Aircrafts and Spacecrafts, Ship and Boats, Cranes, Lifts Winches, Other Construction Machinery etc witness decline in exports during March 2025 vis-à-vis March 2024.
- On a cumulative basis, 28 out of 34 engineering panels recorded positive growth and remaining 6 engineering panels including Iron and Steel, some Non-ferrous sectors including Copper and Aluminium products, Office Equipment, Other Construction Machinery and Mica Products recorded negative growth during April-March 2024-25.
- Region wise, North America maintained itsspot as the number one export destination with a share of 20.5% followed by EU (17.1%) and WANA (16.7%) in March 2025. Significant export growth was noted in LAC (20.1%), Other Europe (19%) and NE Asia (14.1%), in March 2025. In cumulative terms, all regions experienced growth barring Oceania (-10.4%) and EU (-1.9%).
- Country-wise, USA remained the top destinations followed by UAE and Saudi Arabia in March 2025 while maximum increase was noted in France (43.2%), Nepal (37 %) andUK (32.9%).
- In cumulative terms too USA remained the number one destination. Significant export growth was noted in UAE, Sinagpore, Nepal, Japan and France.
| Trade Flow | Export in Mar 2024 | Export in Mar 2025 | Growth (%) | Exports in Apr-Mar 2023-24 | Exports in Apr-Mar 2023-24 | Growth (%) |
|---|---|---|---|---|---|---|
| Overall engineering exports | 11266.67 | 10824.55 | -3.92 | 109300.95 | 116670.03 | 6.74 |
| Engineering exports excluding Iron and Steel | 10109.34 | 10014.45 | -0.94 | 97441.59 | 107418.99 | 10.24 |
OVERALL ENGINEERING EXPORTS VS ENGINEERING EXPORTS EXCLUDING STEEL SEGMENT(Values in USD Million)
OBSERVATIONS: Excluding the export of iron and steel, engineering exports recorded a lower year-on-year decline on a monthly basisand a higher year-on-year growth on a cumulative basis as exports of Iron and Steel declined substantially on both estimates. In March 2025,exports of Iron and Steel declined by 30 percent while on a cumulative basis, the decline was 22 percent year-on-year for fiscal 2024-25.
ENGINEERING EXPORTS: MONTHLY TREND
The monthly engineering figures for 2024-25 vis-à-vis 2023-24 are shown below as per the latest DG CI&S estimates:

| Month | 2023-24 | 2024-25 | Growth (%) |
|---|---|---|---|
| April | 8949.36 | 8547.61 | -4.49 |
| May | 9310.92 | 9991.25 | 7.43 |
| June | 8515.72 | 9389.75 | 10.25 |
| April–June | 26765.71 | 27928.61 | 4.34 |
| July | 8720.30 | 9166.73 | 5.12 |
| August | 9048.65 | 9435.53 | 4.28 |
| September | 8866.54 | 9824.32 | 10.55 |
| July–September | 26655.49 | 28426.59 | 6.64 |
| October | 8078.48 | 11251.25 | 39.27 |
| November | 7822.25 | 8895.53 | 13.74 |
| December | 10007.56 | 10840.80 | 8.33 |
| October–December | 25908.29 | 30987.58 | 19.60 |
| January | 8768.87 | 9422.79 | 7.46 |
| February | 9936.92 | 9079.99 | -8.64 |
| March | 11266.67 | 10824.55 | -3.92 |
| January–March | 29971.46 | 29327.24 | -2.15 |
| April–March | 109300.95 | 116670.03 | 6.74 |
REGION WISE INDIA’S ENGINEERING EXPORTS
The following table depicts region wise India’s engineering exports for 2024-25 as compared to 2023-24.
Source: DGCI&S
Table 2: Region wise engineering exports in April-March 2024-25 vis-à-vis April-March 2023-24
| Region | March 2024 | March 2025 | Growth (%) | April–March 2023–24 | April–March 2024–25 | Growth (%) |
|---|---|---|---|---|---|---|
| NORTH AMERICA | 2085.0 | 2313.5 | 11.0% | 22072.2 | 23917.4 | 8.4% |
| EUROPEAN UNION | 2120.6 | 1767.6 | -16.6% | 20345.8 | 19960.3 | -1.9% |
| WANA | 2028.1 | 1755.5 | -13.4% | 16652.2 | 19503.1 | 17.1% |
| ASEAN | 1381.9 | 995.2 | -28.0% | 12139.8 | 12245.3 | 0.9% |
| N E ASIA | 743.2 | 848.1 | 14.1% | 8251.9 | 8766.7 | 6.2% |
| SSA (Sub Saharan Africa) | 829.9 | 879.5 | 6.0% | 8010.9 | 8759.8 | 9.3% |
| OTHER EUROPE | 609.0 | 724.8 | 19.0% | 6752.0 | 7553.6 | 12.7% |
| SOUTH ASIA | 672.9 | 615.8 | -8.5% | 6179.8 | 6489.4 | 5.0% |
| LATIN AMERICA | 501.3 | 602.0 | 20.1% | 5747.0 | 6186.0 | 7.6% |
| CIS | 153.5 | 164.8 | 7.3% | 1639.7 | 1848.5 | 12.9% |
| OCEANIA | 139.5 | 146.5 | 5.0% | 1537.8 | 1378.1 | -10.4% |
| OTHERS | 1.8 | 11.2 | 537.4% | 25.1 | 71.4 | 184.4% |
| Grand Total | 11266.7 | 10824.5 | -3.9% | 109301.0 | 116670.0 | 6.7% |
Source: DGCI&S
TOP 25 ENGINEERING EXPORT DESTINATIONS IN MARCH 2025
We now look at the export scenario of the top 25 nations that had highest demand for Indian engineering products during March 2025 over March 2024 as well as in cumulative terms during April-March 2024-25 vis-à-vis April-March 2023-24. The data clearly shows that top 25 countries contribute 73.3% of total engineering exports.
Table 3: Engineering exports country wise (Values in US$ million)
| Country | Feb-24 | Feb-25 | Growth (%) | Apr’23–Feb’24 | Apr’24–Feb’25 | Growth (%) |
|---|---|---|---|---|---|---|
| USA | 1671.90 | 1886.72 | 12.8% | 17624.33 | 19155.98 | 8.7% |
| UAE | 675.34 | 716.88 | 6.2% | 7964.84 | 8277.69 | 4.03% |
| SAUDI ARABIA | 604.19 | 451.39 | -25.3% | 5232.10 | 4954.29 | -5.3% |
| SINGAPORE | 350.79 | 334.61 | -4.6% | 3399.01 | 4469.31 | 31.5% |
| GERMANY | 394.24 | 401.34 | 1.8% | 3939.97 | 4033.68 | 2.4% |
| UK | 322.81 | 429.14 | 32.9% | 3591.99 | 4013.30 | 11.7% |
| MEXICO | 300.12 | 312.64 | 4.2% | 3249.10 | 3534.33 | 8.8% |
| TURKEY | 248.16 | 253.08 | 2.0% | 2751.61 | 3044.60 | 10.6% |
| ITALY | 366.26 | 261.23 | -28.7% | 3886.05 | 2988.63 | -23.1% |
| CHINA | 266.07 | 216.05 | -18.8% | 2651.09 | 2667.03 | 0.6% |
| KOREA RP | 203.99 | 262.14 | 28.4% | 2314.88 | 2597.11 | 12.2% |
| SOUTH AFRICA | 252.54 | 225.56 | -10.7% | 2192.73 | 2517.58 | 14.8% |
| FRANCE | 144.31 | 206.64 | 43.2% | 1954.59 | 2494.93 | 27.6% |
| JAPAN | 161.37 | 211.38 | 31.0% | 1924.73 | 2437.67 | 26.7% |
| NEPAL | 159.30 | 218.24 | 37.0% | 2060.73 | 2247.38 | 9.1% |
| BRAZIL | 259.07 | 214.88 | -17.0% | 2139.73 | 2187.82 | 2.3% |
| BANGLADESH | 225.02 | 214.86 | -4.5% | 2193.75 | 2187.68 | -0.3% |
| THAILAND | 139.68 | 181.69 | 30.1% | 1840.78 | 2005.25 | 9.0% |
| INDONESIA | 121.68 | 130.46 | 7.2% | 1804.08 | 1505.00 | -17.0% |
| NETHERLAND | 168.77 | 172.66 | 2.3% | 1891.75 | 1908.57 | 0.9% |
| MALAYSIA | 417.30 | 127.24 | -69.5% | 2318.09 | 1458.70 | -37.1% |
| VIETNAM | 157.38 | 139.17 | -11.5% | 1319.68 | 1435.26 | 8.7% |
| BELGIUM | 179.82 | 146.60 | -18.5% | 1723.72 | 1400.74 | -18.7% |
| SPAIN | 154.81 | 112.34 | -27.4% | 1595.86 | 1385.62 | -13.2% |
| RUSSIA | 132.11 | 113.27 | -14.3% | 1366.27 | 1263.64 | -7.6% |
| Total engineering exports to top 25 countries | 8012.04 | 7941.47 | -0.9% | 81946.85 | 87534.68 | 6.8% |
| Total engineering exports | 11266.67 | 10824.55 | -3.9% | 109300.95 | 116670.03 | 6.7% |
Source: DGCI&S
PANEL WISE INDIA’S ENGINEERING EXPORTS
| Product panels | March 2024 | March 2025 | Growth (%) | April–March 2023–24 | April–March 2024–25 | Growth (%) |
|---|---|---|---|---|---|---|
| Ferrous | ||||||
| Iron and Steel | 1157.3 | 810.1 | -30% | 11859.4 | 9251.0 | -22% |
| Products of Iron and Steel | 994.7 | 981.1 | -1% | 9892.7 | 10116.3 | 2% |
| Sub Total | 2152.0 | 1791.2 | -17% | 21752.1 | 19367.4 | -11% |
| Non-Ferrous | ||||||
| Copper and products | 243.2 | 205.9 | -15% | 2526.2 | 2320.5 | -8% |
| Aluminium and products | 577.5 | 655.0 | 13% | 7681.0 | 6890.2 | -10% |
| Zinc and products | 46.8 | 47.8 | 3% | 727.4 | 740.9 | 2% |
| Nickel and products | 20.4 | 21.2 | 4% | 167.5 | 190.5 | 14% |
| Lead and products | 101.1 | 108.9 | 8% | 780.5 | 945.7 | 21% |
| Tin and products | 1.9 | 3.2 | 71% | 5.2 | 7.4 | 42% |
| Other Non-Ferrous Metals | 70.4 | 86.0 | 22% | 748.1 | 870.3 | 16% |
| Sub Total | 1061.3 | 1144.8 | 8% | 12646.8 | 11980.7 | -5% |
| Industrial Machinery | ||||||
| Industrial Machinery like Boilers, parts, etc. | 84.4 | 101.4 | 20% | 741.6 | 853.8 | 15% |
| IC Engines and Parts | 334.3 | 396.0 | 19% | 3633.3 | 3891.7 | 7% |
| Pumps of all types | 139.6 | 142.5 | 2% | 1439.7 | 1549.5 | 8% |
| Air condition and Refrigerators | 187.5 | 220.2 | 17% | 1725.4 | 1964.5 | 14% |
| Industrial Machinery for dairy, food processing, textiles etc. | 812.3 | 893.3 | 10% | 8059.3 | 8856.5 | 10% |
| Machine Tools | 79.5 | 83.7 | 5% | 787.9 | 808.3 | 3% |
| Machinery for injecting moulding, valves and ATMs | 260.2 | 287.6 | 11% | 2530.6 | 2845.1 | 12% |
| Sub Total | 1898.2 | 2129.6 | 12% | 18847.9 | 20259.1 | 7% |
| Electrical Machinery | ||||||
| Electrical Machinery | 1201.8 | 1385.9 | 15% | 12370.9 | 14380.3 | 16% |
| Automobile and Auto Component | ||||||
| Motor Vehicle/cars | 741.7 | 911.1 | 23% | 8254.6 | 8990.5 | 9% |
| Two and Three Wheelers | 302.6 | 303.7 | 0% | 2772.4 | 3206.6 | 16% |
| Auto Components/Part | 716.1 | 784.3 | 10% | 5305.6 | 5336.1 | 1% |
| Auto Tyres and Tubes | 284.1 | 294.9 | 3% | 2889.5 | 3147.3 | 9% |
| Sub Total | 2065.5 | 2293.3 | 11% | 21618.5 | 23470.7 | 8.6% |
| Aircrafts and Related Products | ||||||
| Aircrafts and Spacecraft parts and products | 894.2 | 243.0 | -73% | 3242.7 | 6963.4 | 115% |
| Ships Boats and Floating products and parts | ||||||
| Ships Boats and Floating products and parts | 475.8 | 254.2 | -47% | 4059.5 | 4296.7 | 6% |
| Miscellaneous engineering products | ||||||
| Medical and Scientific instruments | 246.5 | 309.6 | 26% | 2428.1 | 2820.9 | 16% |
| Railway Transport | 24.3 | 28.1 | 16% | 315.3 | 357.1 | 13% |
| Hand Tools & Cutting Tools | 89.3 | 98.8 | 9% | 928.4 | 1040.5 | 12% |
| Bicycle & Parts | 36.7 | 46.6 | 27% | 364.6 | 410.7 | 13% |
| Cranes Lifts & Winches | 115.0 | 102.9 | -10% | 1097.9 | 1012.6 | -8% |
| Office Equipment | 31.6 | 31.7 | 0% | 312.9 | 288.0 | -8% |
| Other Construction Machinery | 331.4 | 300.9 | -9% | 3032.7 | 3027.4 | 0% |
| Prime Mica & Mica Products | 3.3 | 3.6 | 9% | 37.0 | 31.7 | -14% |
| Project Goods | 0.1 | 0.9 | 969% | 2.6 | 3.2 | 22% |
| Other Rubber Product Except Footwear | 165.4 | 171.6 | 4% | 1680.6 | 1778.4 | 6% |
| Other Misc. Items | 472.7 | 488.0 | 3% | 4597.1 | 5116.0 | 11% |
| Sub total | 1517.9 | 1582.7 | 4.3% | 14762.6 | 15952.5 | 8.1% |
| Total engineering exports | 11266.7 | 10824.5 | -3.9% | 109301.0 | 116670.0 | 6.74% |
Table 5: Panel-wise shares in India’s total engineering exports during April-March 2024-25
| Product panels | Share % (April–March 2023-24) | Share % (April–March 2024-25) |
|---|---|---|
| Electric machinery and equipment | 11.3% | 12.3% |
| Products of iron and steel | 9.1% | 8.7% |
| Iron and steel | 10.9% | 9.7% |
| Motor vehicles/cars | 7.6% | 7.7% |
| Industrial machinery for dairy etc. | 7.4% | 7.2% |
| Auto components/parts | 7.0% | 7.0% |
| Aircraft, spacecraft and parts | 3.0% | 6.0% |
| Aluminium, products of aluminium | 7.0% | 5.9% |
| Other miscellaneous engineering items | 4.2% | 4.4% |
| Ship, boat and floating structures | 3.7% | 3.7% |
| IC engines and parts | 3.3% | 3.2% |
| Two and three wheelers | 2.5% | 2.7% |
| Auto tyres and tubes | 2.6% | 2.6% |
| Other construction machinery | 2.8% | 2.4% |
| ATM, injection-moulding machinery etc. | 2.3% | 2.4% |
| Medical and scientific instruments | 2.2% | 2.4% |
| Copper and products made of copper | 2.3% | 2.0% |
| Product panels | Share % (April–March 2023-24) | Share % (April–March 2024-25) |
|---|---|---|
| AC, refrigeration machinery etc | 1.6% | 1.7% |
| Other rubber products except footwear | 1.5% | 1.5% |
| Pumps of all types | 1.3% | 1.3% |
| Cranes, lifts and winches | 1.0% | 0.9% |
| Hand tool, cutting tool of metals | 0.8% | 0.9% |
| Lead and products made of lead | 0.7% | 0.8% |
| Other non-ferrous metal and products | 0.7% | 0.7% |
| Nuclear reactor, industrial boiler, parts | 0.7% | 0.7% |
| Machine tools | 0.7% | 0.7% |
| Bicycle and parts | 0.3% | 0.3% |
| Railway transport equipment, parts | 0.3% | 0.3% |
| Office equipments | 0.3% | 0.2% |
| Nickel, product made of nickel | 0.2% | 0.2% |
| Prime mica and mica products | 0.0% | 0.0% |
| Tin and products made of tin | 0.0% | 0.0% |
| Project goods | 0.0% | 0.0% |
| Zinc and products made of zinc | 0.7% | 0.6% |
Reasons for Decline (As per April-March 2024-25):
1. Ferrous Products
- Export Performance
- Iron and Steel: Significant decline of 30% from March 2024 to March 2025, and a 22% decline from April-March 2023-24 to April-March 2024-25.
- Products of Iron and Steel: Slight decline of 1% from March 2024 to March 2025, but a 2% growth from April-March 2023-24 to April-March 2024-25.
- Overall Ferrous Products: Decline of 17% from March 2024 to March 2025, and an 11% decline from April-March 2023-24 to April-March 2024-25.
- US Tariffs: The 25% tariffs imposed by the US on steel imports ( as per the proclamation order dated on 18th March 2025) have created a challenging environment for Indian steel exporters. Although India’s direct steel exports to the US are relatively low, the tariffs have led to increased global competition and price pressures. The tariffs have also resulted in a shift in trade flows.
-
Impact of US Tariffs on India’s Steel Exports: (i) While the direct impact of US tariffs on India’s steel exports is limited due to the low volume of exports to the US, the indirect effects are significant. The tariffs have led to increased global competition and price pressures, affecting India’s export competitiveness (ii) India’s Directorate General of Trade Remedies (DGTR) initiated a 12% safeguard duty on a broad range of steel products for 200 days, starting from April 21, 2025. This measure aims to protect the domestic market from a surge in imports. While this move is intended to shield local producers, it has also led to increased costs for user industries, potentially impacting their competitiveness
- Overall price scenario in various countries post imposition of US tariff:
- i. US: The US imposed a 25% tariff on all steel imports, which has significantly boosted domestic steel prices. Hot-rolled coil (HRC) prices soared, with the Midwest HRC price averaging $807 per short ton in March, up from $698 in January. The tariffs have led to increased demand for domestic steel, extending delivery lead times and pushing up prices further. (Source: SPG Platts Connet)
- ii. China: The Chinese steel market experienced muted sentiment due to the US tariffs. Steel prices have remained relatively flat, with hotrolled coil prices averaging 3,419 yuan per metric ton in March 2025. The tariffs have created uncertainty, leading to cautious buying behavior and concerns about a potential trade war. (Source: SPG Platts Connet)
- iii.European Union: EU flat steel prices have risen due to expectations of tighter import quotas in response to the US tariffs and improving manufacturing activity. Northern EU flat steel prices reached a six-month high of €615 per metric ton in early March 2025. (Source: SPG Platts Connet)
- iv.Turkey: Turkey’s scrap prices have strengthened due to higher US steel and scrap prices. However, slow rebar sales have capped further gains.
- v. India: The Indian government has imposed a provisional 12% safeguard duty on specific non-alloy and alloy steel flat products, effective from April 21, 2025. This measure, following DGTR’s findings of a surge in imports causing harm to domestic producers, aims to protect local steel manufacturers. Exemptions apply to imports from developing countries (excluding China and Vietnam) and products priced above certain thresholds. The duty will be in effect for 200 days, providing temporary relief to stabilize domestic steel prices and support the industry.( Source: BigMint).
- 2. Non- Ferrous Sector (Copper and Aluminium)
Copper:
The copper exports declined by 15% in March 2025 and 8% in April-March 2024-25. The decline can be majorly attributed to India’s growing copper demand and its position as a net copper importer due to the shutdown of the Sterlite Copper plant in Tamil Nadu’s Tuticorin in 2018. As per the Ministry of Mines, India’s domestic demand for copper is expected to increased by 1.7 million tonnes by 2027.
Aluminium:
The Aluminium exports declined by 10% in April-March 2024-25. However, it exhibited growth of 13% in March 2025. The decline in aluminium can be attributed to the following reason - RODTEP benefit to SEZ units was only provided in October, November and December 2024 although the scheme was implemented from April 2024 for entire financial year. This is making exports unviable, and not competitive. Declining exports to the US due to the tariff situation is also a cause of concern
ENGINEERING EXPORTS STATE-WISE ANALYSIS
State wise engineering export performance
The table below indicates the exports from top Indian states. It is evident from the table that almost 94.7 % of India’s exports is contributed by the listed 12 states. Within this almost 56.5 percent of exports is done by Maharashtra, Tamil Nadu and Gujarat together.
Table 6:Top state wise engineering export performance – April-March 2024-25 (Values in USD Million)
| Top States | 2023-24 | 2024-25 | Growth % | % Share in India’s Eng Export | Remark |
|---|---|---|---|---|---|
| Maharashtra | 22992.9 | 22546.4 | -1.9% | 18.1% | 94.9% share covered by top 12 states |
| Tamil Nadu | 16844.6 | 18108.6 | 7.5% | 16.6% | |
| Gujarat | 14753.3 | 16590.5 | 12.5% | 7.5% | |
| Telangana | 3458.0 | 7536.2 | 117.9% | 7.3% | |
| Karnataka | 6709.1 | 7277.3 | 8.5% | 5.9% | |
| Odisha | 7125.2 | 5910.1 | -17.1% | 4.4% | |
| Uttar Pradesh | 4117.9 | 4348.7 | 5.6% | 4.3% | |
| Andhra Pradesh | 4885.6 | 4319.4 | -11.6% | 3.5% | |
| West Bengal | 3134.8 | 3523.7 | 12.4% | 2.0% | |
| Madhya Pradesh | 1849.6 | 2013.1 | 8.8% | 1.3% | |
| Rajasthan | 3405.3 | 1346.3 | -60.5% | 1.2% | |
| Daman & Diu and Dadra & Nagar Haveli | 1475.0 | 1242.0 | -15.8% | 22.6% |
Source: NIRYAT portal
- Top 12 states constitute over 94.9 % of India’s engineering Exports. Once again, Karnataka maintained its 5th position, Telengana retained its 4th position, Odisha maintaining its 6th position, West Bengal moving up to 9th position, while Daman and Diu remained at 12th position and Haryana moved down to 13th position during the fiscal April-March 2024-25 compared to the same period last fiscal.( as per estimates of Niryat Portal)
- Major negative growth witnessed in states like Maharashtra, Odisha, Andhra Pradesh, Rajasthan and Daman and Diu during April-March 2024-25 compared to the same period last fiscal.
- Maharashtra being the highest state in terms of Engineering Goods exports (constituting a share of 22.6%) is leading by US$ 4.44 billion from Tamil Nadu(Second Highest State) for the period of April-March 2024-25
INDIA’S REGION WISE ENGINEERING EXPORTS
In terms of region, western region which includes industrial states like Maharashtra and Gujarat is the front runner in terms of exports with 39.2 percent share. Tamil Nadu from the Southern Region has retained its export performance and it ranked second after Maharashtra, while Gujarat and Telengana ranked third and fourth during April-March 2024-25.
Note: Region wise estimates are yet to be uploaded due to some data discrepancy in Niryat Portal.
Note: The total engineering exports given in the above table is taken from NIRYAT as per the latest available data and may not tally with the total engineering exports as given by DGCI&S.


CORRELATION BETWEEN MANUFACTURING PRODUCTION AND ENGINEERING EXPORTS
Engineering forms a considerable part of the broader manufacturing sector and the share of engineering production in overall manufacturing output is quite significant. As exports generally come from what is produced within a country, some correlation between manufacturing production growth and engineering export growth should exist. We briefly look at the trend in manufacturing growth as also engineering export growth to see if they move in tandem. It may be mentioned that manufacturing has 77.63% weightage in India’s industrial production.
Engineering export growth and manufacturing output growth moved in the same direction in as many as nine out of twelve months in each of the fiscal years 2019-20 and 2020-21. During fiscal 2021 22, engineering export growth and manufacturing growth moved in the same direction in seven out of twelve monthswhile in each of fiscal 2022-23 and 2023-24, as many as 10 out of 12 months saw engineering exports and manufacturing output moved in the same direction.
The first two month of fiscal 2024-25 also saw manufacturing output growth and engineering exports growth moving in the same direction. April 2024 saw engineering exports declined from a growth in Mar 2024 and manufacturing output growth decelerated. The month of May 2024 witnessed just the opposite. Engineering exports bounced back to growth path and manufacturing output growth accelerated. Then June and July2024 however saw both moved in the opposite direction but August 2024 saw both engineering export growth and manufacturing growth slowing down.September and October 2024 again saw both moving in the same direction by securing acceleration in growth. November 2024 however saw slowdown in engineering export growth but faster manufacturing growth vis-à-vis October 2024 while growth in both engineering exports and manufacturing output moderated in December 2024. In January 2025 once again, the direction was opposite but in February both moved in the same direction as engineering exports declined and manufacturing growth moderated.
The link between these two may not be established monthly, but a positive correlation may be seen if medium to long term trend is considered.
Table 7: Engineering exports growth vis-à-vis manufacturing growth from April 2022
| Months / Year | Engg. Export Growth (%) | Manufacturing Growth (%) |
|---|---|---|
| April 2023 | -7.52 | 5.5 |
| May 2023 | -4.25 | 6.3 |
| June 2023 | -11.12 | 3.5 |
| July 2023 | -6.91 | 5.3 |
| August 2023 | 7.66 | 10.0 |
| September 2023 | 6.50 | 5.1 |
| October 2023 | 6.99 | 10.6 |
| November 2023 | -3.48 | 1.3 |
| December 2023 | 9.82 | 4.6 |
| January 2024 | -4.10 | 3.6 |
| February 2024 | 15.90 | 4.9 |
| March 2024 | 10.66 | 5.9 |
| Months / Year | Engg. Export Growth (%) | Manufacturing Growth (%) |
|---|---|---|
| April 2024 | -4.49 | 4.2 |
| May 2024 | 7.43 | 5.1 |
| June 2024 | 10.26 | 3.5 |
| July 2024 | 5.12 | 4.7 |
| August 2024 | 4.28 | 1.2 |
| September 2024 | 10.55 | 4.0 |
| October 2024 | 39.27 | 4.4 |
| November 2024 | 13.72 | 5.5 |
| December 2024 | 8.33 | 3.4 |
| January 2025 | 7.49 | 5.8 |
| February 2025 | -8.64 | 2.9 |
Source: (Source: Department of Commerce and CSO)
IMPACT OF EXCHANGE RATE ON INDIA’S EXPORTS
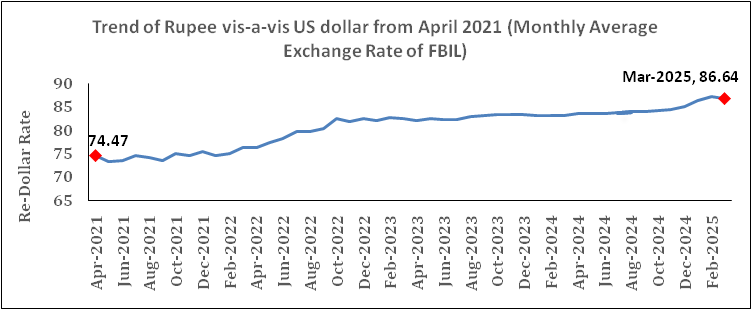
How did the exchange rate fare during March 2025 and what was the recent trend in Re-Dollar movement? In order to get a clearer picture of the recent Re-Dollar trend, not only we took the exchange rate of March 2025, but also considered monthly average exchange rate of Rupee vis-à-vis the US Dollar for each month of fiscal 2023-24 and 2024-25 as per the latest data published, as mere one-month figure does not reflect any trend. The following two tables clearly depicts the short-term trend:
Rupee appreciated over the month in March 2025 for the first time after September 2024 but depreciation continued on a year-on-year basis: INR appreciated vis-à-vis the US Dollar by 0.47 percent in March 2025 over the previous month as reciprocal tariff imposed by the USA has created panic about the US economic prospect in the short term leading to weakening of dollar. On a year-on-year basis however, rupee continued to weaken.

Outlook: Currency market may remain volatile till a stability is seen in tariff war and rupee may witness mild gains in the near term.
Table 8: USD-INR monthly average exchange rate in 2024-25 vis-à-vis 2023-24 (As per latest data released by FBIL)
| Monthly Average Exchange Rate (1 USD to INR) | Year-on-Year Change (%) | Direction | Month-on-Month Change (%) | Direction | ||
|---|---|---|---|---|---|---|
| Month | 2023-24 | 2024-25 | ||||
| April | 82.02 | 83.41 | 1.69 | Depreciation | 0.49 | Depreciation |
| May | 82.34 | 83.39 | 1.28 | Depreciation | -0.02 | Appreciation |
| June | 82.23 | 83.47 | 1.51 | Depreciation | 0.10 | Depreciation |
| July | 82.15 | 83.59 | 1.75 | Depreciation | 0.14 | Depreciation |
| August | 82.79 | 83.89 | 1.33 | Depreciation | 0.36 | Depreciation |
| September | 83.05 | 83.92 | 1.04 | Depreciation | -0.10 | Appreciation |
| October | 83.21 | 84.02 | 0.94 | Depreciation | 0.25 | Depreciation |
| November | 83.30 | 84.36 | 1.27 | Depreciation | 0.40 | Depreciation |
| December | 83.28 | 84.99 | 2.05 | Depreciation | 0.75 | Depreciation |
| January | 83.14 | 86.27 | 3.76 | Depreciation | 1.51 | Depreciation |
| February | 82.96 | 87.05 | 4.93 | Depreciation | 0.90 | Depreciation |
| March | 83.00 | 86.64 | 4.39 | Depreciation | -0.47 | Appreciation |
Table 9: USD-INR monthly average exchange rate in 2023-24 vis-à-vis 2022-23 (As per latest data released by FBIL)
| Monthly Average Exchange Rate (1 USD to INR) | Year-on-Year Change (%) | Direction | Month-on-Month Change (%) | Direction | ||
|---|---|---|---|---|---|---|
| Month | 2022-23 | 2023-24 | ||||
| April | 76.17 | 82.02 | 7.68 | Depreciation | -0.33 | Appreciation |
| May | 77.32 | 82.34 | 6.49 | Depreciation | 0.39 | Depreciation |
| June | 78.04 | 82.23 | 5.37 | Depreciation | -0.13 | Appreciation |
| July | 79.60 | 82.15 | 3.20 | Depreciation | -0.10 | Appreciation |
| August | 79.56 | 82.79 | 4.06 | Depreciation | 0.78 | Depreciation |
| September | 80.23 | 83.04 | 3.50 | Depreciation | 0.30 | Depreciation |
| October | 82.40 | 83.21 | 0.98 | Depreciation | 0.24 | Depreciation |
| November | 81.81 | 83.30 | 1.82 | Depreciation | 0.07 | Depreciation |
| December | 82.46 | 83.28 | 0.99 | Depreciation | -0.02 | Appreciation |
| January | 81.90 | 83.14 | 1.49 | Depreciation | -0.17 | Appreciation |
| February | 82.61 | 82.96 | 0.42 | Depreciation | -0.19 | Appreciation |
| March | 82.29 | 83.00 | 0.86 | Depreciation | 0.05 | Depreciation |
Fig 2: Trend of Rupee vis-a-vis US dollar from April 2020 (Monthly Average Rate of FBIL has been considered)
ANALYSIS OF INDIA’S ENGINEERING IMPORTS

India’s Engineering imports during March 2025 were valued at US$ 13137.07 million compared to US$12907.84 million in March 2024 registering a positive growth of 1.8 percent in dollar terms. Barring Transport Equipments, all the sectors witnessed a rise in import during March 2025 compared to March 2024 registering positive growth over the same period.
The share of engineering imports in India’s total merchandise imports in March 2025 was estimated at 20.7 percent, lower than that of March 2024 which was estimated at 22.6 %. The figure below depicts engineering imports for March 2025 compared to March 2024.
Table 10: India’s engineering imports in April-March 2024-25 vis-à-vis April-March 2023-24
| Values in US$ MN | March 2024 | March 2025 | Growth % | April–March 2023–24 | April–March 2024–25 | Growth % |
|---|---|---|---|---|---|---|
| India’s Engineering Imports | 12907.84 | 13137.07 | 1.8% | 145591.97 | 153519.30 | 5.4% |
Source: Quick Estimates, MoC
Fig 3: Monthly Engineering Imports for April-March 2024-25 vis-a-vis April-March 2023-24
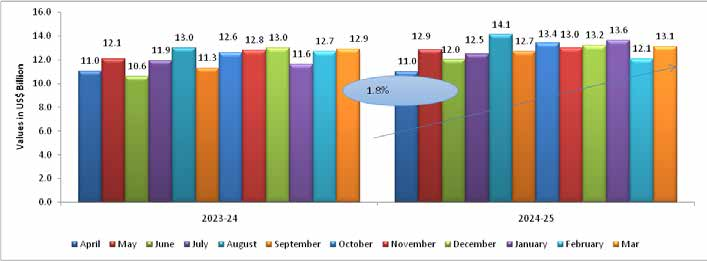
Source: EEPC India analysis
TREND IN ENGINEERING TRADE BALANCE
We now present the trend in two-way yearly trade for the engineering sector for the 2024-25 depicted in the table below:
Table 11: Monthly Trend in Engineering Trade Balance for the current FY 2024-25 (US$ Billions)
| Trade Flow | April | May | June | July | August | September | October | November | December | January | February | March |
|---|---|---|---|---|---|---|---|---|---|---|---|---|
| Engineering Export | 8.7 | 10.0 | 9.4 | 9.0 | 9.4 | 9.8 | 11.2 | 8.9 | 10.6 | 9.4 | 9.1 | 10.8 |
| Engineering Import | 11.0 | 12.9 | 12.0 | 12.5 | 14.1 | 12.7 | 13.4 | 13.0 | 13.2 | 13.6 | 12.1 | 13.1 |
| Trade Balance | -2.3 | -2.9 | -2.6 | -3.5 | -4.7 | -2.9 | -2.2 | -4.1 | -2.4 | -4.2 | -3.0 | -2.3 |
Source: DGCI&S, EEPC India Analysis
CONCLUSION
FY 2024-25 has been an overall positive year for the Indian engineering exports. It was another record breaking performance of Indian engineering exports in 2024-25 as it secured a new all-time high at USD 116.7 billion, surpassing the previous high of USD 112.10 billion achieved in fiscal 2021-22. In this process the engineering exports recorded a growth 6.7% and also outweighed the merchandise exports which recorded a growth of only 0.08% during the same time. The share of engineering exports in total mechandise exports has also risen to 26.7% in the current fiscal as against 25% in the last fiscal. This was possible even though the ex porters faced a number of global adversities.
In the coming days, the engineering exporting community of India needs to prepare for the continually changing and uncertain global trade dynamics. As we enter a new financial year, the global trade is undergoing significant disruptions, the most important being the announcement of US president Donald Trump’s “Liberation Day Tariff” which has already sparked retaliatory measures from other countries and concerns about global economic stability. The WTO has already sounded caution – according to them under the current conditions the volume of global merchandise trade is likely to fall by 0.2 percent in 2025. The organisation has further added that although the temporary pause may arrest some trade contraction, there are significant downside risks including retaliation by other countries and policy uncertainty which may further impact global trade volume by around 1.5%, particularly hurting the export-oriented least developed countries. The tariffs are a new addition to the list of trade disruptions that have been ongoing in the recent years including global conflicts and rise of protectionism.
In this situation it is important for the government and the industry to adopt strategies that will help us mitigate the issue to our advantage. The decision to negotiate a bilateral trade agreement with the US is a welcome step. Simultaneous to this, it is also essential for us to diversify our export destinations. I am thankful to the Ministry of Commerce and Industry for their continuous support and hope that this will continue such that our exporters can strengthen their global market presence.
ANNEXURE-I
ENGINEERING PRODUCT PANELS – COUNTRY-WISE ANALYSIS
We now analyze the performance of some of the important products for the fiscal April-February 2024-25 vis-à-vis April-February 2023-24. We have taken the major panels and computed the top importers to get an idea of the current trade pattern.
Engineering Product Panel - Country matrix (US$ Billions)
| Product panels | Top 5 nations | April–February 2023–24 | April–February 2024–25 | Growth |
|---|---|---|---|---|
| Iron and Steel | Italy | 1895.6 | 1072.1 | -43% |
| Nepal | 755.9 | 780.8 | 3% | |
| UAE | 648.9 | 704.1 | 9% | |
| USA | 475.6 | 587.5 | 24% | |
| U K | 383.8 | 527.0 | 37% | |
| Products of Iron and Steel | USA | 2781.8 | 3105.3 | 12% |
| UAE | 581.0 | 860.6 | 48% | |
| Saudi Arab | 542.3 | 561.9 | 4% | |
| Germany | 445.1 | 466.6 | 5% | |
| U K | 355.5 | 341.1 | -4% | |
| Industrial Machinery | USA | 3750.5 | 4222.7 | 13% |
| UAE | 824.7 | 1012.9 | 23% | |
| Germany | 1026.8 | 899.7 | -12% | |
| China | 719.1 | 852.2 | 19% | |
| Thailand | 769.4 | 779.8 | 1% | |
| Automobiles (Motor Vehicles, Cars and Two and Three Wheelers) | Saudi Arab | 1628.9 | 1570.8 | -4% |
| South Africa | 1170.4 | 1454.0 | 24% | |
| Mexico | 1187.5 | 1345.3 | 13% | |
| Japan | 284.3 | 855.4 | 201% | |
| UAE | 575.7 | 705.6 | 23% | |
| Non-Ferrous metals | USA | 1492.1 | 1533.9 | 3% |
| Korea RP | 1245.4 | 986.6 | -21% | |
| Turkey | 171.7 | 796.3 | 364% | |
| Saudi Arab | 1160.0 | 768.3 | -34% | |
| China | 698.9 | 619.4 | -11% | |
| Electrical Machinery and Components | USA | 2390.9 | 2722.8 | 14% |
| Singapore | 1003.9 | 1526.1 | 52% | |
| U K | 954.5 | 1213.4 | 27% | |
| Germany | 737.8 | 950.5 | 29% | |
| Korea RP | 480.5 | 683.9 | 42% | |
| Aircrafts and Space crafts | UAE | 406.2 | 1699.3 | 318% |
| Saudi Arab | 441.2 | 1114.8 | 153% | |
| France | 201.2 | 747.2 | 271% | |
| USA | 500.8 | 456.7 | -9% | |
| Czech Republic | 63.7 | 353.7 | 456% | |
| Ships, Boats and floating Structures and parts | Singapore | 1063.6 | 1812.5 | 70% |
| UAE | 923.0 | 1107.2 | 20% | |
| USA | 53.1 | 306.4 | 477% | |
| Indonesia | 569.3 | 306.4 | -46% | |
| Sri Lanka | 465.7 | 269.8 | -42% | |
| Auto Components (including Auto Parts and Auto Tyre) | USA | 2388.0 | 2358.1 | -1% |
| Brazil | 512.7 | 609.6 | 19% | |
| Germany | 584.3 | 605.7 | 4% | |
| Bangladesh | 399.3 | 500.7 | 25% | |
| Turkey | 597.5 | 492.1 | -18% |
Source: DGCI&S, EEPC India Analysis
- In April-March 2024-25, Italy, Nepal and UAE ranked as the top importers of Indian Iron and Steel, while the USA, UAE and Saudi Arabia lead in import of products of Iron & Steel.
- The USA stood out as the primary importer of Indian ‘Industrial machinery,’ making up 21% of India’s global exports in this category, followed by UAE 5% and Germany with 4% shares, respectively.
- Saudi Arabia, South Africa, Mexico and Japan were top importers of India’s Automobiles during April-March 2024-25 in India’s global exports respectively over the same period previous fiscal.
- USA, South Korea and Turkey were the top three importers of India’s Non-ferrous metals and products’ during April-March 2024-25 whereas USA, Singapore, UK and Germany were the top importers of Indian Electrical Machinery & Components during the same period
- UAE, Saudi Arabia, France and USA were the top importers of India’s Aircrafts and Spacecraft during April-March 2024-25 in India’s total global exports of the product.
- Singapore, UAE, USA and Indonesia became the largest importer of ships, boats and floating structures followed by Sri Lanka. While for the auto components’ product group, USA remained the top importer in April-March 2024-25 followed by Brazil, Germany, Bangladesh and Turkey.
ANNEXURE-II
COUNTRY-WISE ANALYSIS
During April-March 2024-25 compared to April-March 2023-24, it has been observed that certain key export destinations, which showed significant demand for Indian engineering products, witnessed a decline in cumulative growth from April to March 2024-25 compared to the same period last fiscal.
Table: Negative Engineering exports country wise (Values in US$ million)
| Countries | Mar-24 | Mar-25 | Growth (%) | Apr-Mar 2023–24 | Apr-Mar 2024–25 | Growth (%) |
|---|---|---|---|---|---|---|
| Italy | 366.26 | 261.23 | -28.7% | 3886.05 | 2989.63 | -23.1% |
| Korea RP | 203.99 | 262.14 | 28.5% | 2739.69 | 2597.11 | -5.2% |
| Bangladesh | 225.02 | 214.85 | -4.5% | 2193.75 | 2187.68 | -0.3% |
| Indonesia | 120.21 | 130.46 | 8.5% | 2336.19 | 1938.70 | -17.0% |
| Malaysia | 417.30 | 127.24 | -69.5% | 2318.09 | 1458.70 | -37.1% |
| Belgium | 179.82 | 146.60 | -18.5% | 1723.72 | 1400.74 | -18.7% |
| Spain | 154.81 | 112.34 | -27.4% | 1595.98 | 1385.65 | -13.2% |
| Russia | 132.12 | 113.27 | -14.3% | 1356.27 | 1262.74 | -6.9% |
| Total Engineering Exports to these countries | 1799.54 | 1368.13 | -24.0% | 18149.74 | 15220.94 | -16.1% |
| Total Engineering Exports | 11266.7 | 10824.5 | -3.9% | 109301.0 | 116670.0 | 6.7% |
| Share % | 16% | 13% | 17% | 13% |
Source: DGCI&S
Countries with negative export growth rate to Italy, Belgium and Spain
| Exporting Country | 2023 | 2024 | Growth % |
|---|---|---|---|
| Italy | |||
| Algeria | 15223.1 | 11967.8 | -21.4% |
| Korea, Republic of | 6231.1 | 5669.0 | -9.0% |
| Brazil | 4927.1 | 4915.5 | -0.2% |
| Japan | 5876.4 | 4767.9 | -18.9% |
| Saudi Arabia | 6439.0 | 4426.5 | -31.3% |
| Russian Federation | 4391.8 | 3777.1 | -14.0% |
| Belgium | |||
| United States of America | 38556.8 | 21869.8 | -43.3% |
| China | 33387.9 | 12853.1 | -61.5% |
| Japan | 11087.2 | 8553.8 | -22.9% |
| Türkiye | 5573.3 | 3254.2 | -41.6% |
| Korea, Republic of | 5020.4 | 2556.9 | -49.1% |
| Canada | 4206.6 | 2518.4 | -40.1% |
| Spain | |||
| China | 47555.4 | 39879.0 | -16.1% |
| United States of America | 30500.0 | 26146.7 | -14.3% |
| Algeria | 6733.8 | 6601.1 | -2.0% |
| Nigeria | 6206.1 | 5888.3 | -5.1% |
| Japan | 5011.2 | 4300.7 | -14.2% |
| Vietnam | 4792.7 | 4102.6 | -14.4% |
Source: ITC Trade Map
Italy, Belgium and Spain
India’s engineering exports to Italy, Belgium and Spain have declined by 23.1 percent, 18.7 percent and 13.2 percent during April-March 2024-25 vis-à-vis April-March 2023-24. After examining each country’s import from the other countries of the world, it has been observed that their imports have declined from some of the key players in the global market also.
The EU experienced a notable decrease in imports from the global market in 2024, primarily driven by a confluence of economic challenges. A significant economic slowdown, exacerbated by the ongoing impact of the Ukraine conflict and the European Central Bank’s tight monetary policies to combat persistent inflation, curtailed overall demand. Simultaneously, weak domestic consumption across major EU economies, stemming from declining real incomes, further reduced the appetite for imported goods.
Beyond these economic pressures, a discernible shift towards increased intra-EU trade contributed to the decline in external imports. Faced with global uncertainties and rising import costs, EU member states increasingly favored trade within the internal market. Furthermore, the implementation of non-tariff measures like the Carbon Border Adjustment Mechanism added complexities and costs for external exporters, impacting their competitiveness and contributing to the overall reduction in the EU’s reliance on imports from the global market.
Indonesia and Malaysia
The engineering exports to Indonesia and Malaysiaexperienced a decline of 17 percent and 37.1 percent respectively during April-March 2024-25 vis-à-vis April-March 2023-24. If we look at the monthly engineering exports in March 2025 to March 2024, there has been a significant decline of 69.5 percent in case of Malaysia.
Countries with negative export growth rate to Indonesia and Malaysia (Values in US$ Mn)
| Exporting Country | 2023 | 2024 | Growth % |
|---|---|---|---|
| Indonesia | |||
| Japan | 16516.6 | 14964.9 | -9.4% |
| Korea, Republic of | 10525.8 | 9339.1 | -11.3% |
| Saudi Arabia | 4067.1 | 4047.5 | -0.5% |
| Germany | 4647.3 | 3705.7 | -20.3% |
| Nigeria | 3941 | 3012 | -23.6% |
| Russian Federation | 2433.8 | 2240.4 | -7.9% |
Source: ITC Trade Map
Countries with negative export growth rate to Bangladesh (Values in US$ Mn)
| Exporting Country | 2023 | 2024 | Growth % |
|---|---|---|---|
| China | 22952.5 | 22911.2 | -0.2% |
| Singapore | 3229.7 | 3054.9 | -5.4% |
| Indonesia | 3577.8 | 3019.4 | -15.6% |
| United States of America | 2251.9 | 2213.9 | -1.7% |
| Japan | 1746.7 | 1505.1 | -13.8% |
| Korea, Republic of | 1625.9 | 1300.6 | -20.0% |
| Thailand | 1072.6 | 1036.6 | -3.4% |
| Canada | 971.9 | 768.05 | -21.0% |
Source: ITC Trade Map
Bangladesh
India’s engineering export to Bangladesh has declined by 0.3 percent during April-March 2024-25 vis-à-vis April-March 2023-24 with exports valuing at USD2187.68 million.
The Indian export basket to Bangladesh consists of a variety of products. Disruptions in Bangladesh’s economic activities are likely causing a broad reduction in demand across sectors, impacting imports from numerous global partners. This decreased demand, stemming from internal economic challenges within Bangladesh, affects a wide array of goods, leading to negative export growth for major trading nations beyond just India. Additionally, increased competition, particularly from countries like China in sectors such as engineering, further contributes to the decline in exports from other nations to Bangladesh.
Disclaimer
The analysis in this write-up is prepared by the team at EEPC India. The data used in this write-up is primarily sourced from the DGCI&S database and pertains to products under the purview of EEPC India. Sources are cited where relevant. While every effort has been made to ensure the accuracy and reliability of the data and analysis, EEPC India assumes no responsibility for any errors or decisions based on this information.
© Copyright , All rights reserved. Design by Andreal